Kuaishou Short-term Analysis: Stock Price Poised for Breakthrough, Focus on Key Resistance
$KUAISHOU-W (01024.HK)$ As of January 12, 2026, Kuaishou (01024) surged significantly by 6.89%, closing at HKD 79.85. The intraday high reached HKD 79.9, with the stock price successfully surpassing all key moving averages. The 10-day moving average (MA10) is at HKD 70.73, while the 30-day moving average (MA30) and the 60-day moving average (MA60) are near HKD 68.07 and HKD 69.53 respectively, forming a solid bullish support base. Multiple trend indicators such as the Ichimoku Cloud and MACD signals point to a 'buy,' indicating that medium-term upward momentum is building.
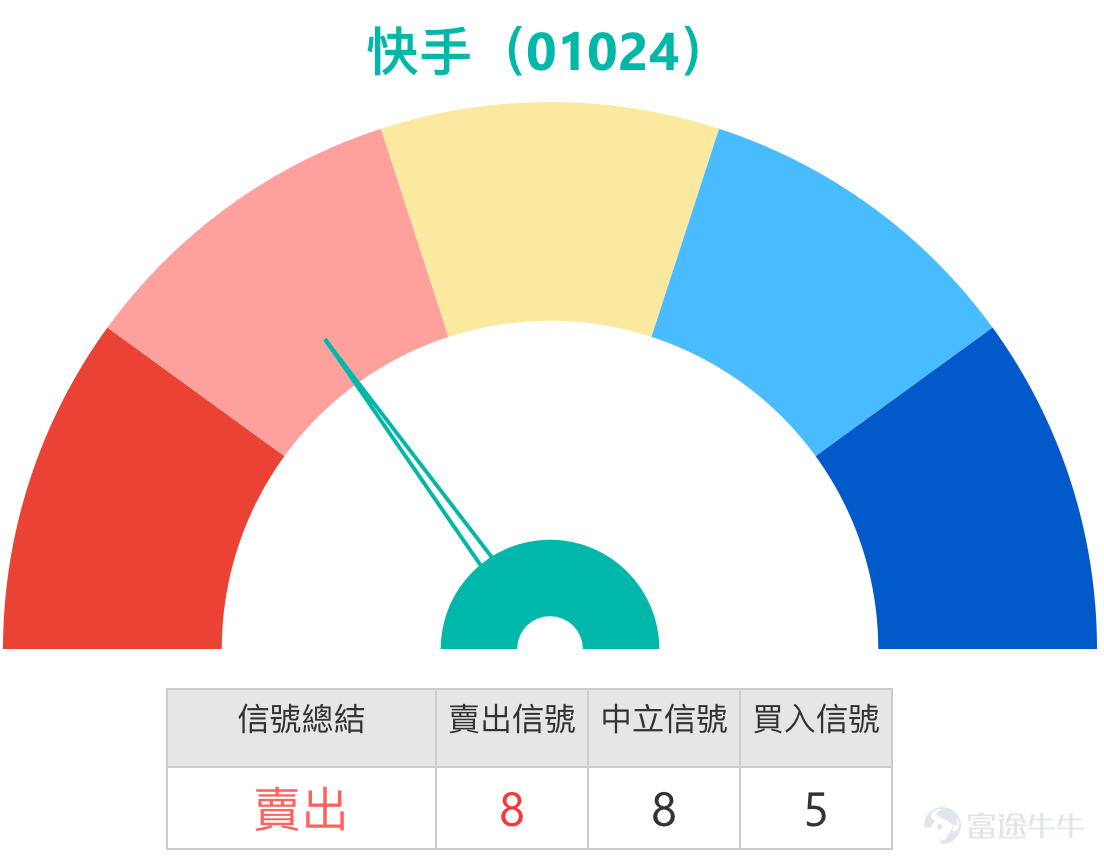
However, the market is currently in a delicate balance in the short term. On one hand, the stock price shows a strong upward trend; on the other hand, multiple oscillation indicators are issuing warning signals. The Relative Strength Index (RSI) has risen to 67, nearing the overbought critical zone, with both the Williams %R and Stochastic Oscillator showing 'overbought' or 'sell' signals. This divergence among technical indicators, combined with the system’s overall technical summary signal being 'sell,' suggests that after a rapid surge, the market is experiencing heightened disagreement between bulls and bears, potentially leading to short-term technical pullbacks or volatility. Investors need to closely monitor volume changes at key price levels to assess the validity of any breakout.
Support and Resistance Analysis: Focusing on the HKD 78 to HKD 83 Range
According to the latest technical analysis data, Kuaishou's stock price has a clearly defined key price range in the short term, which aligns closely with recent commentary from [Hong Kong Stocks Podcast] Simon's analysis.January 9th [Hong Kong Stock Podcast] Hang Seng Index, HSBC, JD.com, Zhaogin, Kuaishou, Luoyang Molybdenum
On the upside resistance, the primary barrier is located at 83.4 yuan. As Simon pointed out in the program, whether the current stock price can successfully challenge 80 yuan hinges on breaking through the resistance near 78 yuan first.If it can effectively stabilize above this level, the next target will be 89.6 yuan. This resistance range is also a crucial path for the stock price to break through previous highs and unlock broader upward potential.
On the downside support, the first strong line of defense is at 72.5 yuan, which is close to the 10-day moving average and is expected to have strong buying support. A more critical support level is near the 69 yuan threshold; if breached, the stock price may further decline to test longer-term moving average support.
![$KUAISHOU-W (01024.HK)$ As of January 12, 2026, Kuaishou (01024) surged significantly by 6.89%, closing at HKD 79.85. The intraday high reached HKD 79.9, with the stock price successfully surpassing all key moving averages. The 10-day moving average (MA10) is at HKD 70.73, while the 30-day moving average (MA30) and the 60-day moving average (MA60) are near HKD 68.07 and HKD 69.53 respectively, forming a solid bullish support base. Multiple trend indicators such as the Ichimoku Cloud and MACD signals point to a 'buy,' indicating that medium-term upward momentum is building. However, the market is currently in a delicate balance in the short term. On one hand, the stock price shows a strong upward trend; on the other hand, multiple oscillation indicators are issuing warning signals. The Relative Strength Index (RSI) has risen to 67, nearing the overbought critical zone, with both the Williams %R and Stochastic Oscillator showing 'overbought' or 'sell' signals. This divergence among technical indicators, combined with the system’s overall technical summary signal being 'sell,' suggests that after a rapid surge, the market is experiencing heightened disagreement between bulls and bears, potentially leading to short-term technical pullbacks or volatility. Investors need to closely monitor volume changes at key price levels to assess the validity of any breakout. Support and Resistance Analysis: Focusing on the HKD 78 to HKD 83 Range According to the latest technical analysis data, Kuaishou's stock price has a clearly defined key price range in the short term, which aligns closely with recent commentary from [Hong Kong Stocks Podcast] Simon's analysis.](https://nnqimage.futunn.com/sns_client_feed/1162342/20260112/web-1768201970456-MvdhksJCuz.png/big?area=1&is_public=true&imageMogr2/ignore-error/1/format/webp)
Market View Summary: Resonance Between Fundamentals and Technicals
Kuaishou's recent strong performance is the result of an improved macro environment, positive company fundamentals, and technical breakthroughs working together. Goldman Sachs and other major firms recently reiterated their 'Buy' rating for Kuaishou with a target price of 83 yuan. Their core rationale is based on optimistic expectations regarding Kuaishou’s Ling AI business. The Goldman Sachs report forecasts that the new Ling AI model will significantly boost user engagement, with AI-related revenue for the fiscal year 2025 potentially exceeding company guidance. This innovative business is considered a key driver for future valuation growth. Morgan Stanley also noted the company’s strategic expansion in overseas markets; while short-term investments may impact profit margins, it is seen as a vital step toward long-term growth.
Derivatives Review: Leverage Effect Highlighted in Trending Markets
When the underlying stock exhibits significant trending movements, using derivatives can enhance capital deployment efficiency. Looking back at the products mentioned on January 8, 2026, during the following two trading days (up to January 10), Kuaishou's stock price surged by 10.29%, fully demonstrating the leverage effect of related derivative products.
Specifically, call warrants performed exceptionally well: Bank of China Call Warrant (23201) $BIKUASO@EC2606C.C (23201.HK)$ and HSBC Call Warrant (18362) $HSKUASO@EC2606A.C (18362.HK)$ saw their prices rise by 48% and 45%, respectively, over two days. Bull contracts also showed strong gains: UBS Bull Contract (67943) and J.P. Morgan Bull Contract (60760) recorded increases of 44% and 40%, respectively.
![$KUAISHOU-W (01024.HK)$ As of January 12, 2026, Kuaishou (01024) surged significantly by 6.89%, closing at HKD 79.85. The intraday high reached HKD 79.9, with the stock price successfully surpassing all key moving averages. The 10-day moving average (MA10) is at HKD 70.73, while the 30-day moving average (MA30) and the 60-day moving average (MA60) are near HKD 68.07 and HKD 69.53 respectively, forming a solid bullish support base. Multiple trend indicators such as the Ichimoku Cloud and MACD signals point to a 'buy,' indicating that medium-term upward momentum is building. However, the market is currently in a delicate balance in the short term. On one hand, the stock price shows a strong upward trend; on the other hand, multiple oscillation indicators are issuing warning signals. The Relative Strength Index (RSI) has risen to 67, nearing the overbought critical zone, with both the Williams %R and Stochastic Oscillator showing 'overbought' or 'sell' signals. This divergence among technical indicators, combined with the system’s overall technical summary signal being 'sell,' suggests that after a rapid surge, the market is experiencing heightened disagreement between bulls and bears, potentially leading to short-term technical pullbacks or volatility. Investors need to closely monitor volume changes at key price levels to assess the validity of any breakout. Support and Resistance Analysis: Focusing on the HKD 78 to HKD 83 Range According to the latest technical analysis data, Kuaishou's stock price has a clearly defined key price range in the short term, which aligns closely with recent commentary from [Hong Kong Stocks Podcast] Simon's analysis.](https://nnqimage.futunn.com/sns_client_feed/1162342/20260112/web-1768202012425-i2RfBH6fFy.png/big?area=1&is_public=true&imageMogr2/ignore-error/1/format/webp)
Derivatives Deployment Strategies Under Current Market Conditions
Based on the assessment that Kuaishou’s share price is consolidating below a key resistance level, investors can select appropriate derivatives for deployment according to their varying expectations of future market direction. It is crucial to note that the prices of all derivative products can rise or fall sharply, and investors may lose their entire principal. Investors should fully understand product risks and review relevant listing documents before investing.
If optimistic about the underlying stock breaking through resistance, one can focus on high-leverage call warrants or bull contracts.
Investors who believe that a rebound in tech stocks and AI-related businesses will drive the share price to break through the resistance zone of 78 to 83.4 yuan can consider the following products.
* BOC Call Warrant (23201) $BIKUASO@EC2606C.C (23201.HK)$ UBS Group Call Warrant (22762) $UBKUASO@EC2606B.C (22762.HK)$ Both products have an exercise price of 77.05 yuan, slightly lower than the current price, placing them in the in-the-money to at-the-money range, offering approximately 4.1 times actual leverage. Their key feature is relatively low implied volatility. Implied volatility measures the market's expectation of the underlying stock's future fluctuations; lower implied volatility means the warrant price is less affected by market sentiment swings, with its value more closely tracking the underlying stock's movement. This makes it suitable for investors expecting a clear breakout in the underlying stock.
* HSBC Bull Contract (68213): This product has a stop-loss level set at 65 yuan, providing a relatively wide gap from the current price and offering approximately 4.5 times actual leverage, the highest among the recommended bull contracts. The profit and loss structure of bull contracts is relatively straightforward, with prices typically moving closely in line with the underlying stock without time decay, making it suitable for swing trading. However, extreme caution is required: if the underlying stock price hits the stop-loss level, the bull contract will be forcibly terminated immediately, potentially leading to a total investment loss.
![$KUAISHOU-W (01024.HK)$ As of January 12, 2026, Kuaishou (01024) surged significantly by 6.89%, closing at HKD 79.85. The intraday high reached HKD 79.9, with the stock price successfully surpassing all key moving averages. The 10-day moving average (MA10) is at HKD 70.73, while the 30-day moving average (MA30) and the 60-day moving average (MA60) are near HKD 68.07 and HKD 69.53 respectively, forming a solid bullish support base. Multiple trend indicators such as the Ichimoku Cloud and MACD signals point to a 'buy,' indicating that medium-term upward momentum is building. However, the market is currently in a delicate balance in the short term. On one hand, the stock price shows a strong upward trend; on the other hand, multiple oscillation indicators are issuing warning signals. The Relative Strength Index (RSI) has risen to 67, nearing the overbought critical zone, with both the Williams %R and Stochastic Oscillator showing 'overbought' or 'sell' signals. This divergence among technical indicators, combined with the system’s overall technical summary signal being 'sell,' suggests that after a rapid surge, the market is experiencing heightened disagreement between bulls and bears, potentially leading to short-term technical pullbacks or volatility. Investors need to closely monitor volume changes at key price levels to assess the validity of any breakout. Support and Resistance Analysis: Focusing on the HKD 78 to HKD 83 Range According to the latest technical analysis data, Kuaishou's stock price has a clearly defined key price range in the short term, which aligns closely with recent commentary from [Hong Kong Stocks Podcast] Simon's analysis.](https://nnqimage.futunn.com/sns_client_feed/1162342/20260112/web-1768202047497-bDxtLKpYrw.jpeg/big?area=1&is_public=true&imageMogr2/ignore-error/1/format/webp)
If expecting the underlying stock to undergo a pullback and consolidation, one can focus on put warrants or bear contracts.
For investors concerned about RSI overbought conditions and divergences in technical indicators, bearish instruments can be used to hedge risks or capture pullback opportunities.
* Morgan Stanley Put Warrant (19624) and Bank of China Put Warrant (19035) $BIKUASO@EP2603A.P (19035.HK)$These two products have exercise prices of 68.33 yuan and 68.83 yuan, respectively, offering approximately 8.2x and 6.5x actual leverage. Their key feature is relatively low implied volatility. Unlike bull/bear certificates, put warrants do not have a forced recall mechanism; their value is primarily determined by the underlying stock price, implied volatility, and time decay.
* Societe Generale Bear Certificate (65908) and UBS Bear Certificate (67316)$UB#KUASORP2804H.P (67316.HK)$: The recovery prices for both bear certificates are set at 88 yuan, providing approximately 7x to 7.3x actual leverage. Among them, Societe Generale Bear Certificate (65908)$SG#KUASORP2812R.P (65908.HK)$is characterized by the highest leverage and lower premium, while UBS Bear Certificate (67316) stands out for having the lowest premium. These certificates are suitable for investors who believe that the stock price will face resistance and retreat within the current range and have a higher risk tolerance.
![$KUAISHOU-W (01024.HK)$ As of January 12, 2026, Kuaishou (01024) surged significantly by 6.89%, closing at HKD 79.85. The intraday high reached HKD 79.9, with the stock price successfully surpassing all key moving averages. The 10-day moving average (MA10) is at HKD 70.73, while the 30-day moving average (MA30) and the 60-day moving average (MA60) are near HKD 68.07 and HKD 69.53 respectively, forming a solid bullish support base. Multiple trend indicators such as the Ichimoku Cloud and MACD signals point to a 'buy,' indicating that medium-term upward momentum is building. However, the market is currently in a delicate balance in the short term. On one hand, the stock price shows a strong upward trend; on the other hand, multiple oscillation indicators are issuing warning signals. The Relative Strength Index (RSI) has risen to 67, nearing the overbought critical zone, with both the Williams %R and Stochastic Oscillator showing 'overbought' or 'sell' signals. This divergence among technical indicators, combined with the system’s overall technical summary signal being 'sell,' suggests that after a rapid surge, the market is experiencing heightened disagreement between bulls and bears, potentially leading to short-term technical pullbacks or volatility. Investors need to closely monitor volume changes at key price levels to assess the validity of any breakout. Support and Resistance Analysis: Focusing on the HKD 78 to HKD 83 Range According to the latest technical analysis data, Kuaishou's stock price has a clearly defined key price range in the short term, which aligns closely with recent commentary from [Hong Kong Stocks Podcast] Simon's analysis.](https://nnqimage.futunn.com/sns_client_feed/1162342/20260112/web-1768202060273-3iY5tHddxp.jpeg/big?area=1&is_public=true&imageMogr2/ignore-error/1/format/webp)
Overall, the core advantage of derivatives such as warrants and bull/bear certificates lies in the leverage effect and flexible two-way trading mechanisms they offer. They allow investors to deploy limited initial capital based on their judgment of market fluctuation direction (upward or downward) and magnitude, thereby managing funds and risk exposure more efficiently.
In summary, under the dual expectations of improved sentiment in tech stocks and the company’s own AI business development, do you think Kuaishou's stock price will first gather momentum to break through the key resistance level of 83.4 yuan, or will it first pull back to consolidate near the support level of 72.5 yuan? In terms of deployment strategy, would you prefer using bull/bear certificates with less time decay but carrying a forced recall mechanism, or choose call warrants without recall risk but subject to time decay?
For analysis on Hong Kong stock warrants and bull/bear certificates, this is Jenny. See you again next time.
#Kuaishou #TechnicalAnalysis #SupportAndResistanceLevels #Warrants #BullAndBearCertificates #Derivatives #HongKongStockDeployment #KelingAI #ShortTermTrading #RiskManagement
This article does not constitute any investment advice.
This article is for reference only and does not constitute any investment advice. The market data, opinions, and analysis contained herein may change at any time without prior notice. We shall not be liable for any loss or damage arising from reliance on the information in this article. Technical analysis merely indicates whether certain technical conditions are met; a comprehensive evaluation of asset performance should incorporate additional data. Trading decisions should not be based solely on the content of this article. Please note that past performance is not indicative of future results.
Risk Disclaimer: The above content only represents the author's view. It does not represent any position or investment advice of Futu. Futu makes no representation or warranty.Read more

Comments
to post a comment
2
1