
Two major banks are both bullish—has gold passed its worst moment?
Zijin Mining (01818) Technical Analysis: Stock Price Holding Above the Moving Average, Strong Technical Pattern
$ZHAOJIN MINING (01818.HK)$ As of January 12, 2026, the latest share price of Zhaojin Mining (01818) was reported at HKD 36.3, up 2.02%. From a technical perspective, the stock price has successfully stabilized above all key moving averages. The 10-day line (MA10), 30-day line (MA30), and 60-day line (MA60) are located at HKD 33.14, HKD 30.9, and HKD 30.24 respectively, forming a clear bullish alignment that provides solid foundational support for the stock price. Notably, recent charts have shown important positive technical patterns. According to publicly available technical analysis data, Zhaojin Mining displayed a 'triple bottom' breakout pattern, which is generally considered a stable bottom signal indicating the formation of an upward trend. Additionally, some analyses point out that the stock exhibited an 'inverse head and shoulders' pattern with an upward breakout above the neckline, another classic bullish signal suggesting that the technical trend could remain strong.
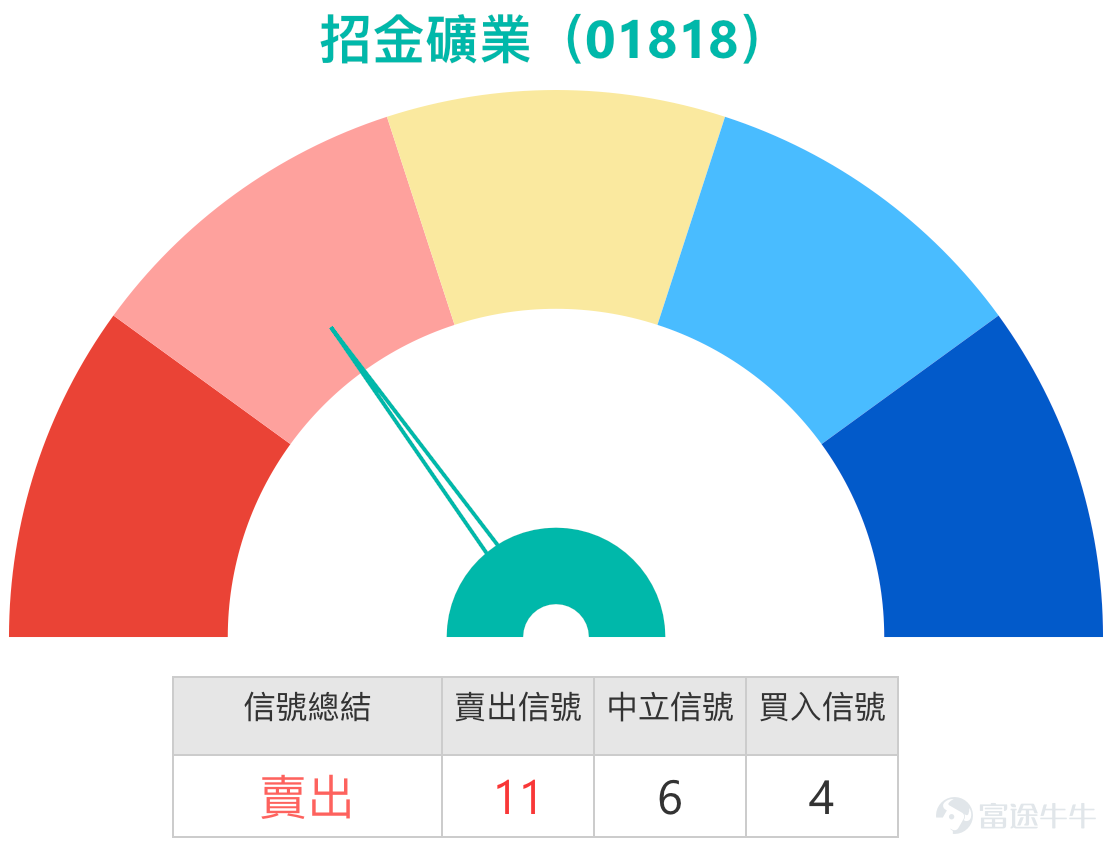
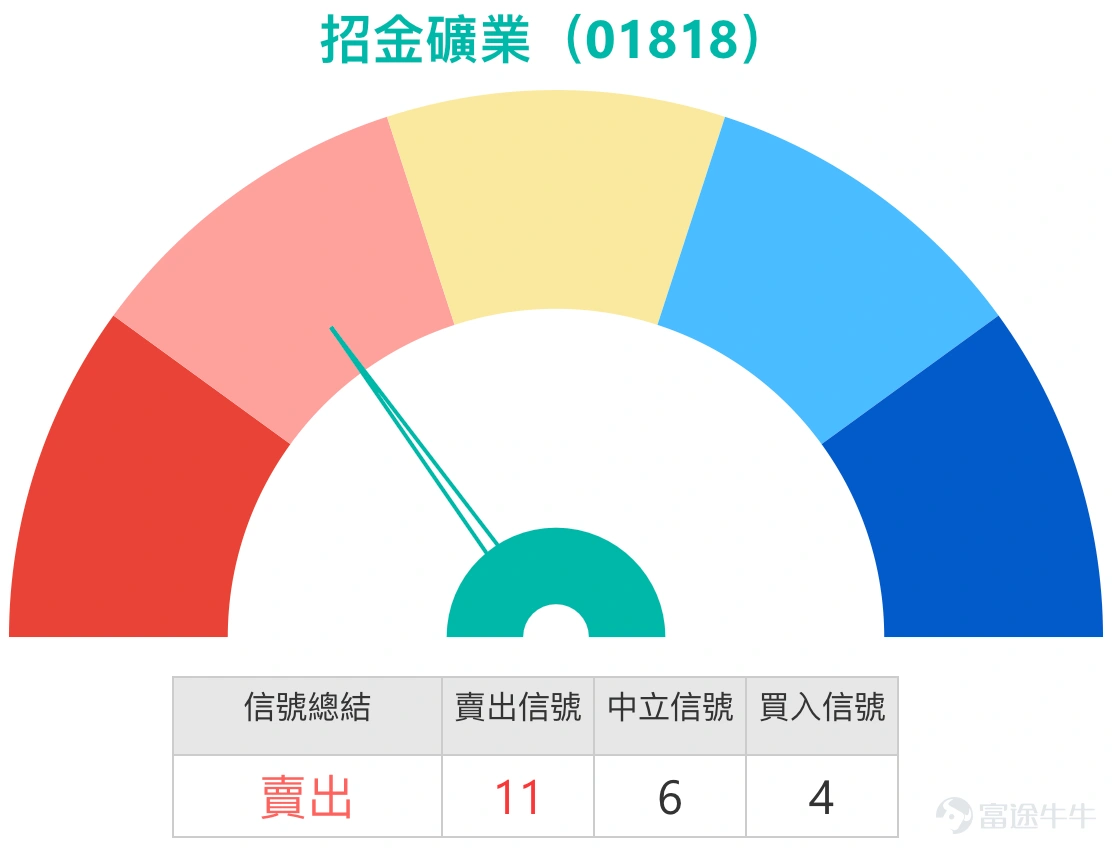
However, investors should also be mindful of signs of short-term overbought conditions. Currently, the Relative Strength Index (RSI) has reached an overbought level of 75, indicating strong upward momentum in the short term but also increasing pressure for a technical pullback. Multiple oscillating indicators currently show a 'neutral' status, while the overall technical indicator summary signal points to 'sell'.
Support and resistance analysis: Key range established
Based on the current technical landscape, the short-term critical price range for Zhaojin Mining has become relatively clear. The primary resistance level is near HKD 37.4; if a successful breakout occurs, the next target will be around HKD 40.3. This aligns with analyst Simon’s viewpoint from the recent [Hong Kong Stocks Podcast], where he mentioned that after breaking through HKD 37.1, the next resistance level for Zhaojin Mining would be around HKD 39.9. To challenge higher levels, the stock must first effectively overcome this area.
On the support side, the primary line of defense is at HK$33.2, which is close to the 10-day moving average, and is expected to see strong buying support. The more critical support level is at HK$30.4, near the 60-day line, which can be regarded as the dividing line for the strength of the mid-term trend. As long as the stock price can remain above this support zone, the overall upward structure will be maintained.
Market View Summary: Dual Drivers of Gold Bull Market and Production Growth
Zijin Mining's recent strong performance is closely tied to two core fundamental drivers.
First, the continuous rise in international gold prices to record highs has been the most direct catalyst. Since January 2026, spot gold prices have broken through the key levels of $3,200 and $4,600 per ounce, setting new historical records. Amid ongoing geopolitical tensions and rising market demand for safe-haven assets, several institutions, including CITIC Securities, believe that the likelihood of further gains in gold remains high. The strong performance of gold prices directly enhances the earnings visibility of gold mining companies, driving the entire sector higher.
Secondly, Zijin Mining’s flagship project, the 'Marine Gold Mine,' is entering its harvest phase, forming the company’s mid-to-long-term growth logic. The Marine Gold Mine is the largest single gold deposit ever discovered in China, with production expected to gradually reach full capacity between 2026 and 2027, yielding 15 to 20 tons annually. Its high-grade advantage is expected to keep production costs extremely low, significantly boosting the company’s profitability. Morgan Stanley (大摩) recently raised Zijin Mining's target price from HK$13.3 to HK$14 in response to the latest progress on the Marine Gold Mine.
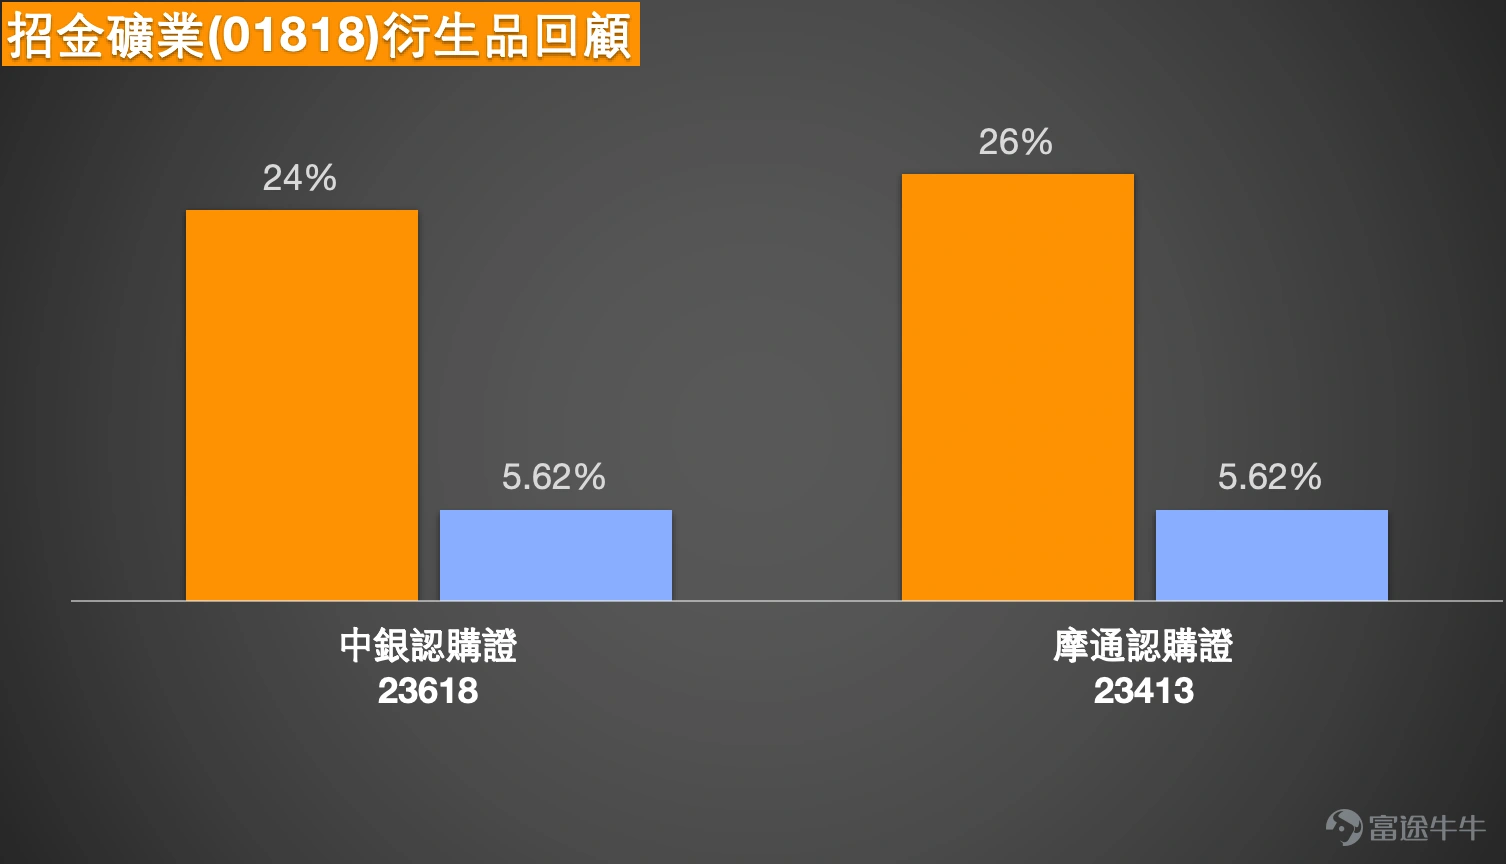
Derivatives Review: Warrants Effectively Amplify Stock Returns
When the underlying stock shows a clear trend, derivatives can provide investors with an efficient deployment option. Looking back at the two call warrants mentioned on January 8, 2026, during the subsequent two trading days (up to January 10), Zijin Mining's stock rose by 5.62%. In this context, related warrant products leveraged their inherent leverage characteristics to achieve growth far exceeding that of the underlying stock.
Specifically, JPMorgan's (摩根大通) call warrant (23413) saw a price increase of 26% over two days, while BOCI's (中銀國際) call warrant (23618) also recorded a 24% gain. This data clearly demonstrates that when the underlying stock exhibits a one-sided trend, investors can use call warrants with suitable terms to capture the same directional volatility using less capital, thereby improving capital efficiency. Of course, this also means that if the underlying stock moves contrary to expectations, losses will similarly be magnified.
Derivatives Deployment Strategy under Current Market Conditions
Based on the assessment that Zijin Mining is consolidating before a key resistance level, investors can deploy using the following products based on different market outlooks. It is important to note that all derivative product prices can rise or fall sharply, and investors may lose their entire principal. Before investing, it is essential to fully understand the product risks and review relevant listing documents.
If you are optimistic about the underlying stock breaking through resistance, you can focus on out-of-the-money call warrants.
Investors who believe that strong gold prices and the company’s fundamentals will push the stock price above the resistance level of 37.4 yuan may consider call warrants with higher actual leverage.
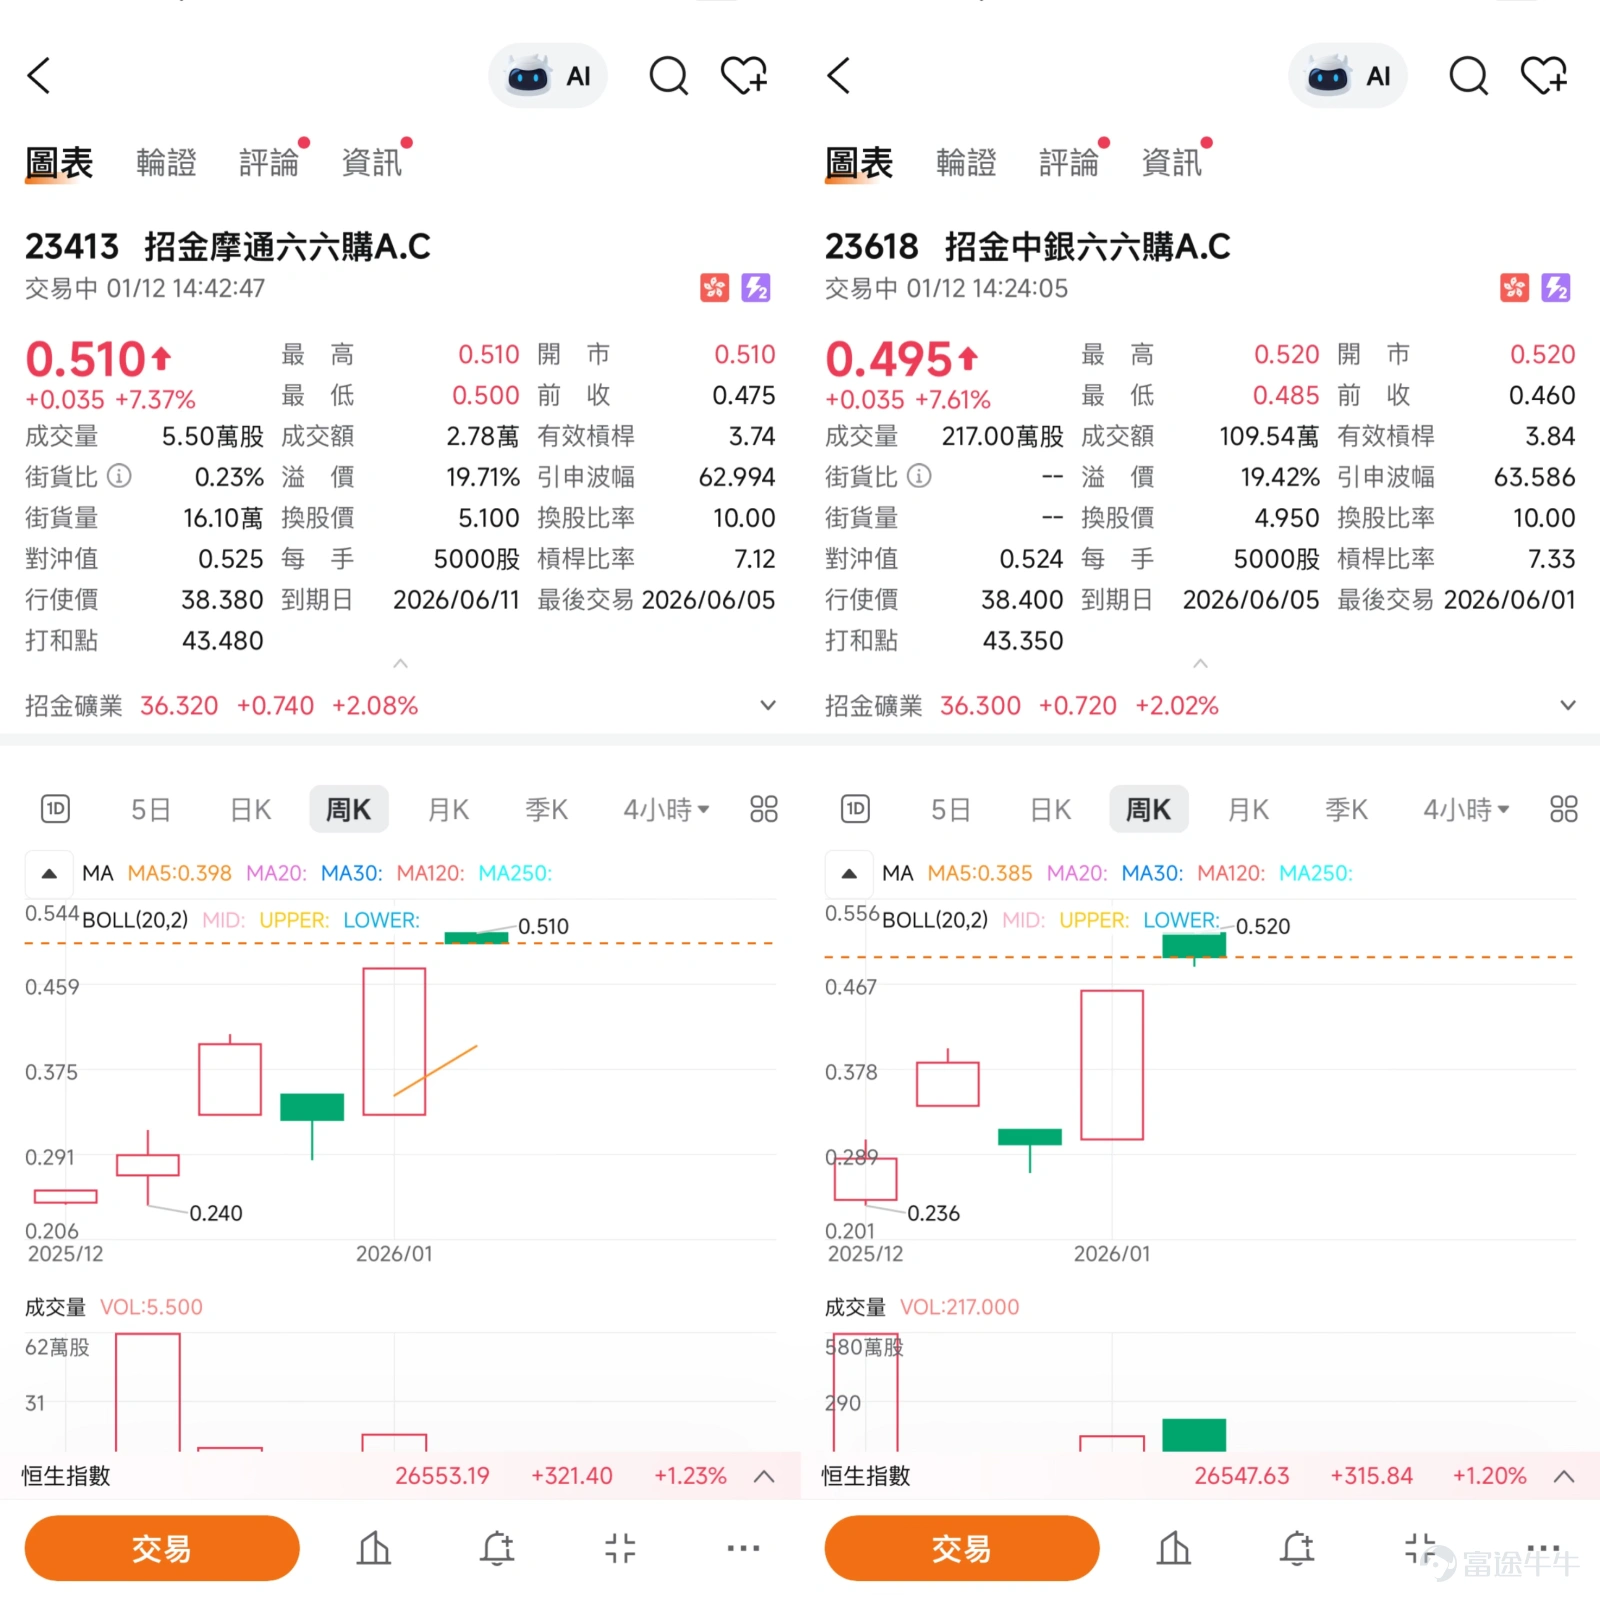
* JPMorgan Call Warrant (23413)$JPZHJIN@EC2606A.C (23413.HK)$: This product has a strike price of 38.38 yuan, making it a slightly out-of-the-money warrant offering approximately 3.8 times actual leverage. Its main feature is that it provides a relatively high leverage level among similar products while maintaining a lower implied volatility. Lower implied volatility means that the price of this warrant is less affected by market sentiment fluctuations, and its value changes more closely follow the movement of the underlying stock, making it suitable for investors who expect a clear breakout in the underlying stock.
* BOCI Call Warrant (23618)$BIZHJIN@EC2606A.C (23618.HK)$: This product has a strike price of 38.4 yuan, also providing around 3.8 times actual leverage. Its terms are similar to those of the JPMorgan call warrant, offering investors another high-leverage and low-implied-volatility option, suitable for those with a higher risk tolerance who anticipate significant short-term gains in the underlying stock.
Driven by the dual momentum of strong gold prices reaching new highs and the company's own production growth, do you think Zhaoyin Mining’s stock price will first gather strength to break through the resistance level at 37.4 yuan, or will it first pull back to consolidate near the support level at 33.2 yuan? Would you prefer to use call warrants or bull/bear contracts to implement your market view?
For analysis of Hong Kong stock warrants and bull/bear contracts, I’m Jenny. See you again next time.
#Zhaojin Mining #Technical Analysis #Support and Resistance Levels #Gold Stocks #Warrants #Bull and Bear Certificates #Derivatives #Hong Kong Stock Deployment #Marine Gold Mines #Risk Management
This article does not constitute any investment advice.
This article is for reference only and does not constitute any investment advice. The market data, opinions, and analysis contained herein may change at any time without prior notice. We shall not be liable for any loss or damage arising from reliance on the information in this article. Technical analysis merely indicates whether certain technical conditions are met; a comprehensive evaluation of asset performance should incorporate additional data. Trading decisions should not be based solely on the content of this article. Please note that past performance is not indicative of future results.
Risk Disclaimer: The above content only represents the author's view. It does not represent any position or investment advice of Futu. Futu makes no representation or warranty.Read more

Comments
to post a comment
3