
[Warrant Insights] Buy signal emerges for Alibaba! High-elasticity warrants rise in tandem
Last Friday (September 9) at the market close, $BABA-W (09988.HK)$
The stock closed at HKD 146.5, up 2.73% for the day, with a turnover of HKD 17.003 billion.
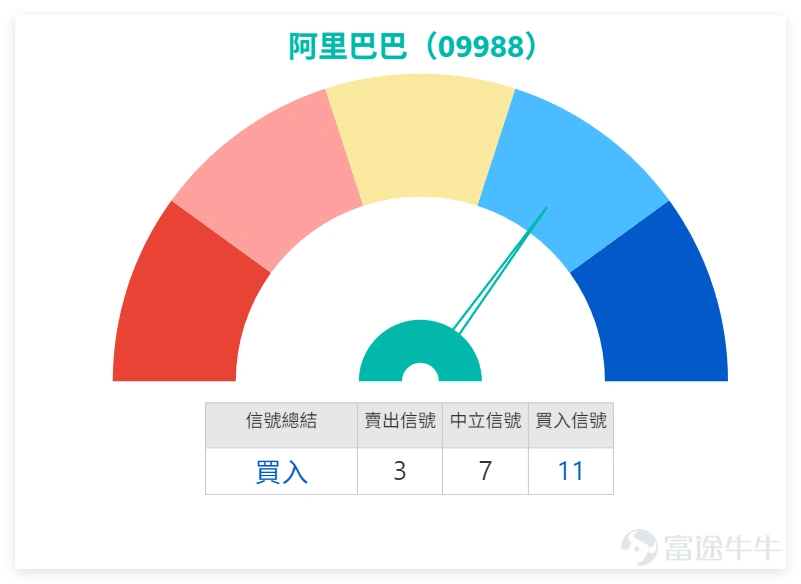
From a technical perspective, Friday’s closing price was oscillating between the MA10 (HKD 146.42) and MA30 (HKD 149.33). The overall technical indicators suggest a “buy” signal, with moderate strength at level 11; the RSI indicator is neutral at 48, while the CCI indicator shows a buy signal. The Bull-Bear Power indicator also leans towards buying, but the MACD indicates a sell signal, and Bollinger Bands show a sell signal, reflecting slight divergence among several indicators. As of today (September 12) at 10:08 AM,Alibaba's latest price is HKD 149.9. Resistance levels are concentrated at HKD 151.9 and HKD 155.9, while support levels stand at HKD 142.6 for primary support and HKD 138.4 for strong support. The probability of an upward movement is 56%, with a 5-day volatility of 8.7%, indicating moderate trading range.
E-commerce platform stocks showed mixed performances, with peers like
$JD-SW (09618.HK)$ JD.com standing out as it closed at HKD 114.6, rising 2.60% for the day. Technical indicators also suggested a “buy” signal, with the share price successfully moving above the MA10 (HKD 113.46), strengthening short-term momentum.
Stocks related to the technology ecosystem performed unevenly, with $TENCENT (00700.HK)$ Kuaishou closing at HKD 611, down 0.81%. Despite a “buy” signal from technical indicators, its strength is weak, and the share price remains below the MA10 (HKD 613), suggesting short-term pressure.
$MEITUAN-W (03690.HK)$ another stock closing at HKD 98.5, falling 2.48%. The technical signal is “neutral,” with the share price below key moving averages, indicating weakness in consolidation.
Among other tech stocks, $KUAISHOU-W (01024.HK)$ Surging against the trend by 3.89%, closing at 74.7 yuan. Although technical indicators show a 'sell' signal, the stock price broke through the MA10 (69.26 yuan), reflecting strong rebound momentum.
$BIDU-SW (09888.HK)$ It fell by 2.07%, closing at 137.4 yuan. The technical signal is 'sell', with the stock price below the MA30 (124.37 yuan), indicating a weak trend.
Overall, on January 9, e-commerce and technology peers showed divergent performances. Although Alibaba is in a technical buy zone, JD.com and Kuaishou have shown stronger momentum, reflecting market differences in growth expectations for sub-sectors.
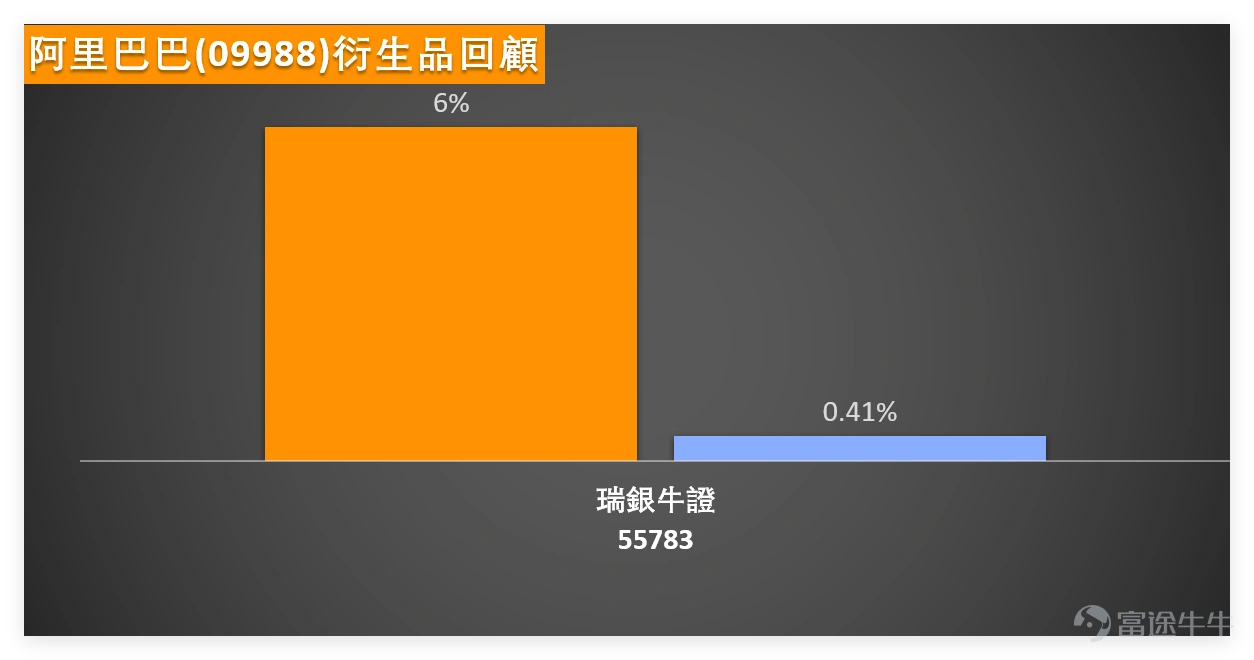
Reviewing the performance of Alibaba-related warrants, as of January 7, 2026, $UB#ALIBARC2608I.C (55783.HK)$ the increase reached 6% two days later, while the underlying stock rose only 0.41%. This shows that this bull warrant has sufficient elasticity and high Delta sensitivity, meaning minor fluctuations in the underlying stock can lead to significant rebounds in the warrant. Historically, these highly elastic products tend to offer higher short-term returns during periods when the underlying stock moves upward with volatility, though they come with higher risks.
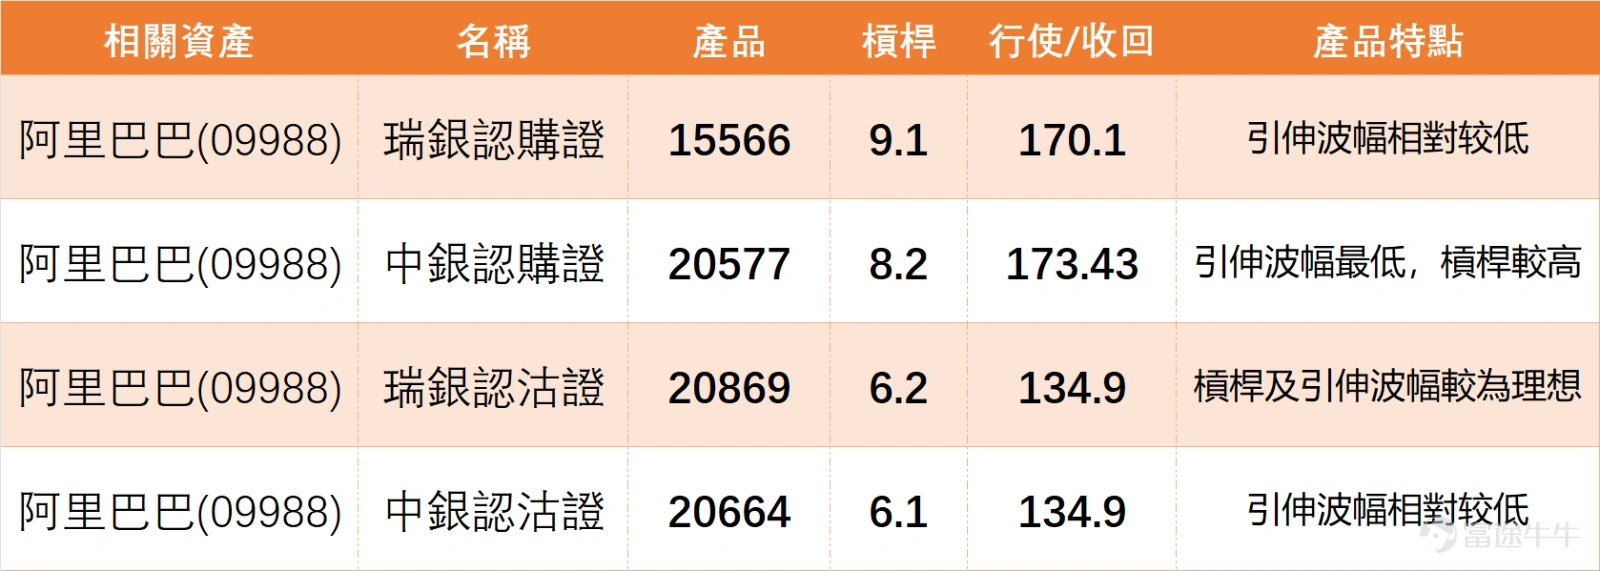
In terms of selected targets, we first recommend $BIALIBA@EC2604B.C (20577.HK)$ This product offers a leverage of 8.2 times, which is moderate, ensuring some elasticity while avoiding the risks associated with excessive leverage. The strike price is 173.43 yuan, slightly out-of-the-money, balancing risk and elasticity. Its core advantage lies in having the lowest implied volatility, effectively reducing costs, making it suitable for cost-efficient investors who are optimistic about Alibaba breaking through resistance levels.
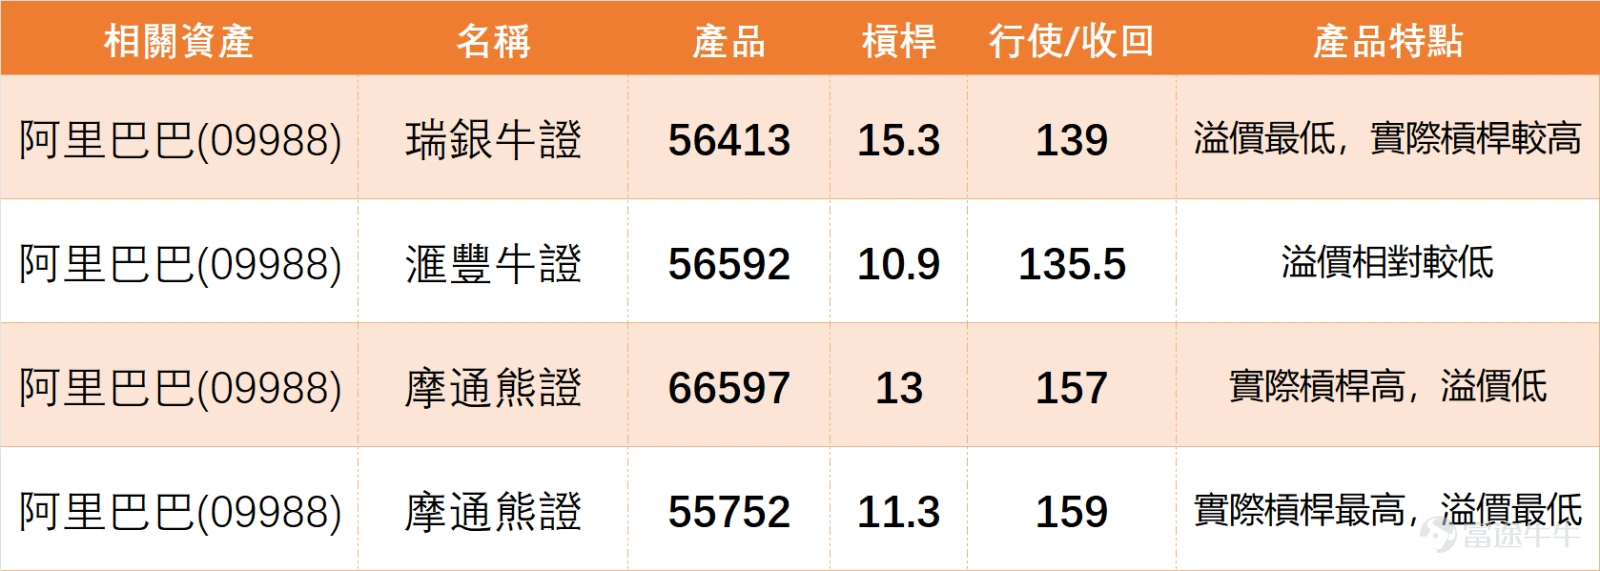
Another selected target is $UB#ALIBARC2607I.C (56413.HK)$ With an actual leverage of up to 15.3 times and the lowest premium, the stop-loss price is 139 yuan, and liquidity remains robust. For investors optimistic about Alibaba holding its support level and continuing to rebound, this bull warrant offers sufficient elasticity to maximize gains from the underlying stock's rise.
For those preferring defensive deployment, $UBALIBA@EP2604B.P (20869.HK)$It is also a good choice, with a leverage of 6.2 times. Both the leverage and implied volatility are relatively ideal. The strike price is HK$134.9, which can serve as a tool to hedge against downside risks in the underlying stock.
Risk Warning:UBS Group's bull certificate (56413) has a call price of HK$139. With the current underlying stock price at HK$146.5, it is relatively close to the call price, so there is a need to be cautious about the risk of short-term pullbacks triggering forced redemption. Additionally, some short-term CBBCs have shorter remaining durations, leading to accelerated time decay, and thus are not recommended for long-term holding. Meanwhile, the e-commerce sector is showing divergence in performance, with market expectations for industry growth varying. It remains uncertain whether Alibaba can successfully break through the resistance level of HK$151.9. Investors should weigh the certainty of the underlying stock’s movement when choosing CBBCs, and avoid blindly chasing high prices.
Alibaba is showing a technical buy signal, but there is clear divergence in the sector. Would you choose a low implied volatility product like BOC Call Warrant (20577) for a conservative approach, or a high-leverage product like UBS Group Bull Certificate (56413) to bet on a rebound? Alternatively, would you allocate put warrants to hedge the risks?Feel free to leave your thoughts in the comment section! Want more analysis? Don’t forget to follow ‘HK Stock Warrants Jenny’ for daily updates!
Disclaimer: This article does not constitute any investment advice.
This article is for reference only and does not constitute any investment advice. The market data, opinions, and analysis contained herein may change at any time without prior notice. We shall not be liable for any loss or damage arising from reliance on the information in this article. Technical analysis merely indicates whether certain technical conditions are met; a comprehensive evaluation of asset performance should incorporate additional data. Trading decisions should not be based solely on the content of this article. Please note that past performance is not indicative of future results.
#Alibaba #HongKongStocks #RealTimeAnalysis #WarrantsSelection #WarrantsStrategy #DerivativesHedging #HongKongWarrantsJenny #Alibaba(09988) #EcommerceStocks #TechnicalAnalysis
Risk Disclaimer: The above content only represents the author's view. It does not represent any position or investment advice of Futu. Futu makes no representation or warranty.Read more

Comments
to post a comment
3