
[Warrant Insights] Hang Seng Index holds steady above three moving averages! Seize the rebound opportunity with low-premium call warrants?
Last Friday (September 9th) $Hang Seng Index (800000.HK)$
The index closed at 26,231.79 points, up slightly by 0.32%. The trading volume was 245.13 billion yuan, with a 5-day volatility of 3.4%.
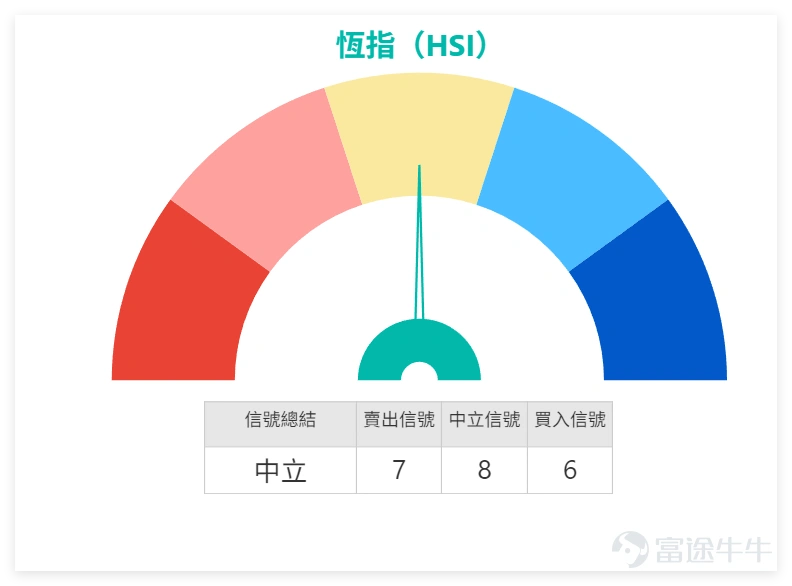
Technically, the Hang Seng Index is currently between the support level at 25,769 points and the resistance level at 26,593 points. The MA10, MA30, and MA60 are at 26,117.55 points, 25,872.12 points, and 25,981.93 points respectively. The stock price is above the major moving averages, showing a mildly bullish pattern.The RSI index is at 56, within the neutral range. The overall technical indicator signal is neutral with a strength of 8. Multiple oscillation indicators such as the Stochastic Oscillator and CCI are showing neutral signals, while indicators like MACD, ADX, and Bollinger Bands are issuing buy signals, reflecting intense short-term market volatility with a strong wait-and-see sentiment.
Tech stocks showed mixed performance, $TENCENT (00700.HK)$ Closing at 611.00 yuan, down 0.81% for the day. The stock price is slightly below the MA10 (613.00 yuan) and MA30 (610.33 yuan). Technical indicators show a neutral signal, suggesting a consolidation pattern; $BABA-W (09988.HK)$ Closing at 146.50 yuan, up 2.73%, with the closing price near the MA10 (146.42 yuan). Technical indicators suggest a buy signal, indicating stronger short-term momentum; $MEITUAN-W (03690.HK)$ Closing at 98.50 yuan, down 2.48%. The stock price is below the MA10 (103.51 yuan) and MA30 (101.57 yuan), with technical indicators showing a neutral signal and being in an oversold zone.
Financial stocks mostly saw slight gains, $HSBC HOLDINGS (00005.HK)$ Closing at 124.80 yuan, up slightly by 0.40%. The stock price is above the MA10 (124.54 yuan) and MA30 (117.32 yuan). Technical indicators show a neutral signal, with a stable trend; $AIA (01299.HK)$ Closed at HKD 84.30, up 0.54%. The closing price was higher than the 10-day moving average (MA10) of HKD 83.44, but technical indicators show an overbought condition, suggesting short-term resistance. $PING AN (02318.HK)$ Closed at HKD 70.00, down 0.28%. The stock price is close to the 10-day moving average (MA10) of HKD 68.24, with technical indicators being neutral, showing no clear direction.
Consumer and real estate stocks showed mixed performance. $CCB (00939.HK)$ Closed at HKD 7.59, down 0.26%. The stock price is below the 10-day moving average (MA10) of HKD 7.66, and technical indicators suggest oversold conditions, potentially forming a bottom. $ICBC (01398.HK)$ Closed at HKD 6.13, up 0.49%. Technical indicators show a buy signal, but trading volume has decreased. $SANDS CHINA LTD (01928.HK)$ Closed at HKD 18.75, slightly up by 0.05%. The stock price is below the 10-day moving average (MA10) of HKD 19.68, and technical indicators suggest oversold conditions, with potential for a rebound.
Among other blue chips, $CHINA MOBILE (00941.HK)$ Closed at HKD 80.95, unchanged. The stock price is below the 10-day moving average (MA10) of HKD 81.97, with technical indicators being neutral, lacking short-term catalysts. $CNOOC (00883.HK)$ Closed at HKD 20.94, up 1.26%. Technical indicators show a buy signal, with strong momentum.
Overall, several blue-chip stocks exhibited narrow fluctuations on January 9th, with technical indicators mainly showing neutral or oversold conditions, further reflecting a strong market观望 sentiment.
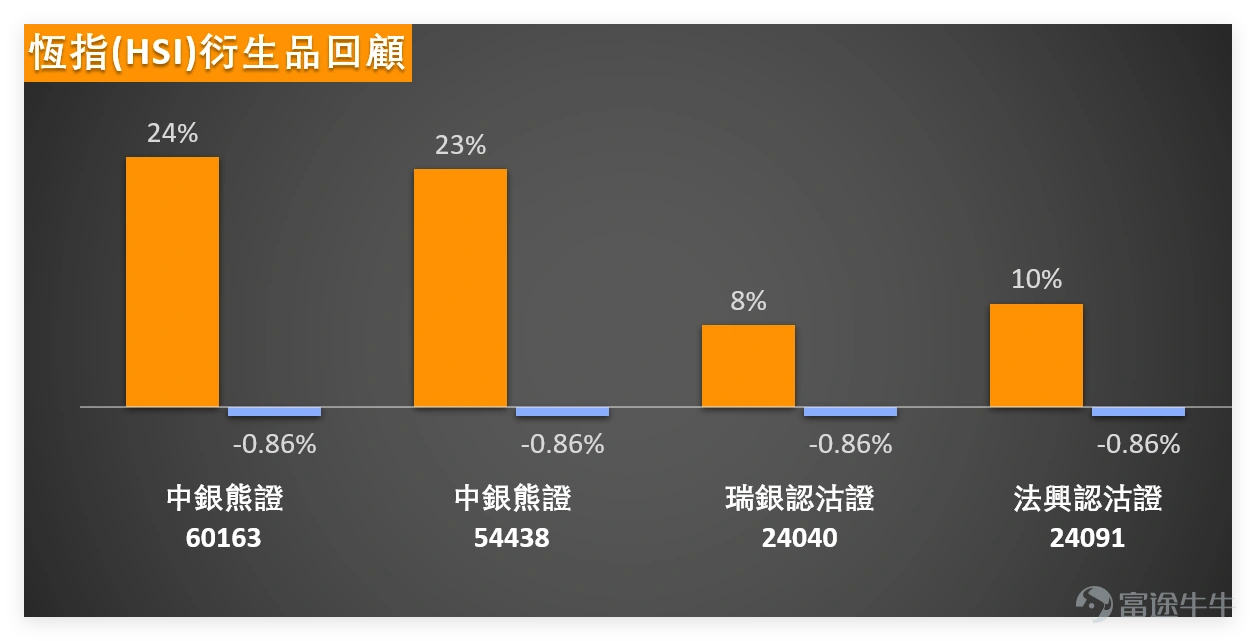
Looking back at the performance of recently popular Hang Seng Index derivatives, the put warrants and bear contracts on January 7 showed active performance in the following two days. Among them, $SG-HSI @EP2606A.P (24091.HK)$ two days later, the increase reached 10%, while the Hang Seng Index fell by 0.86% during the same period; $UB-HSI @EP2606A.P (24040.HK)$ after two days, there was an 8% increase, again corresponding to a 0.86% drop in the Hang Seng Index, demonstrating that when the Hang Seng Index weakened in the short term, the delta sensitivity of put warrants effectively amplified profit elasticity. Regarding bear contracts, $BI#HSI RP2801L.P (60163.HK)$ the increase reached as high as 24% after two days, $BI#HSI RP2804K.P (54438.HK)$ and another contract rose 23% after two days, both significantly outperforming the Hang Seng Index's decline during the same period, highlighting the high leverage advantage of bear contracts during index declines.
Based on the current trend and technical signals of the Hang Seng Index, the following high cost-performance ratio CBBCs (Callable Bull/Bear Contracts) are recommended for reference.
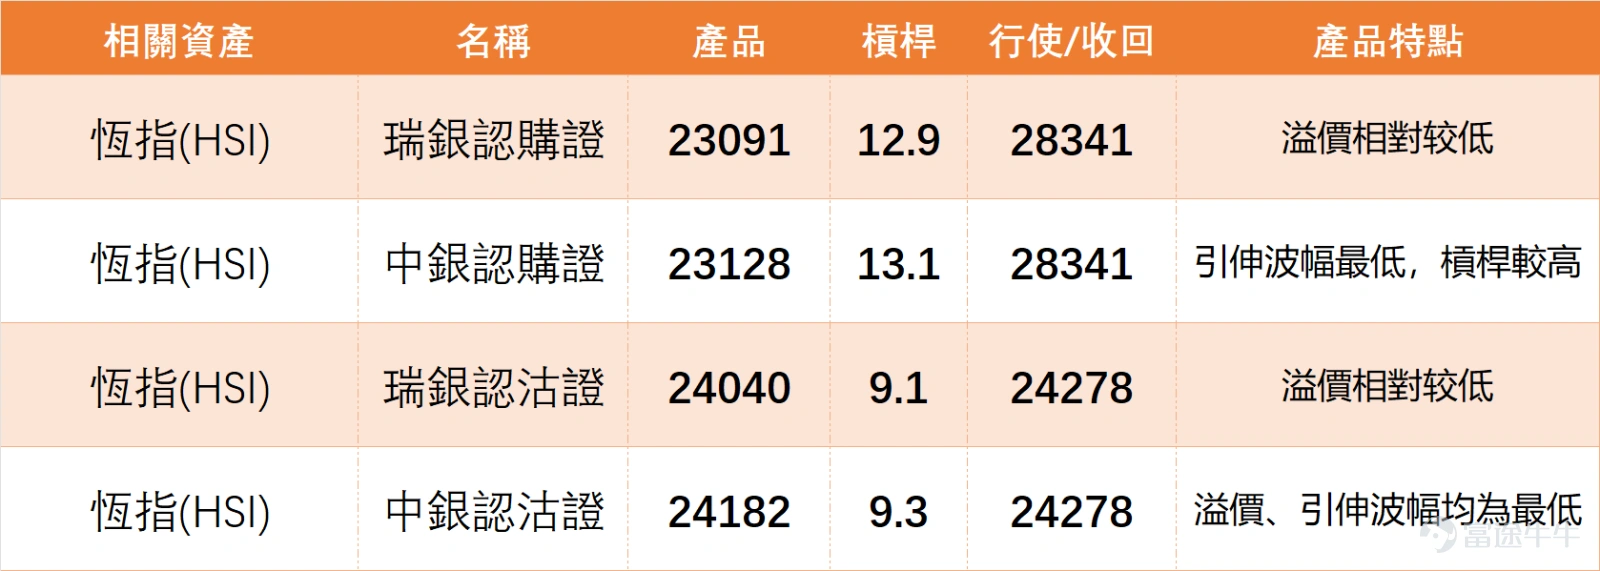
In terms of call warrants, $UB-HSI @EC2605B.C (23091.HK)$ Leverage of 12.9 times, strike price at 28,341 points, relatively low premium, good cost efficiency, suitable for investors optimistic about the Hang Seng Index breaking through the resistance level of 26,593 points and moving towards 27,219 points; $BI-HSI @EC2605B.C (23128.HK)$ Also with a strike price of 28,341 points and leverage of 13.1 times, not only higher leverage but also the lowest implied volatility among similar products, making time decay relatively controllable, offering excellent balance between flexibility and cost.
Regarding put warrants, $UB-HSI @EP2606A.P (24040.HK)$ Leverage of 9.1 times, strike price at 24,278 points, with relatively low premium, suitable for investors concerned about the Hang Seng Index testing the support level at 25,769 points; $BI-HSI @EP2606A.P (24182.HK)$ Leverage of 9.3 times, strike price at 24,278 points, with the lowest premium and implied volatility among similar products, making it an optimal choice for defensive deployment.
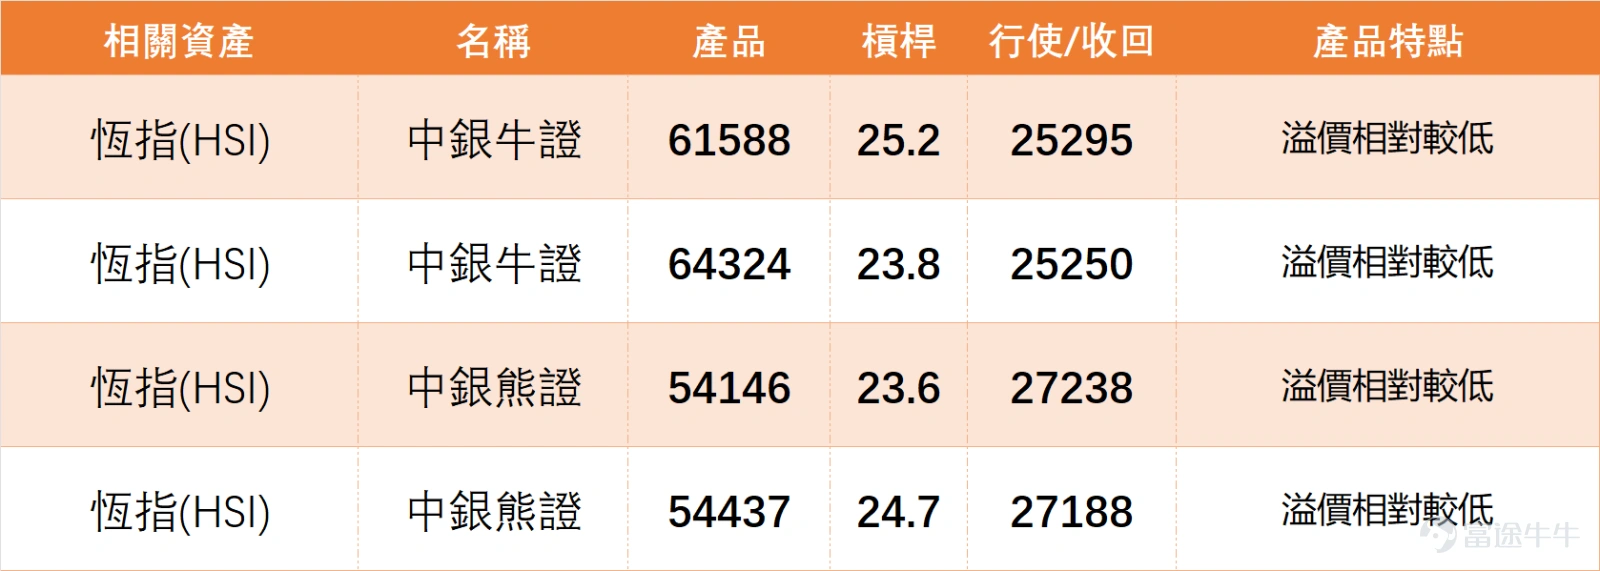
For CBBCs, $BI#HSI RC28082.C (61588.HK)$With a leverage of 25.2 times and a recovery price of 25,295 points, the premium is relatively low, providing a certain safety margin from the current Hang Seng Index level, making it suitable for investors betting on a rebound in the Hang Seng Index; BOC Bear Certificate (54146) has a leverage of 23.6 times and a recovery price of 27,238 points, with a relatively low premium. If the Hang Seng Index fails to break through the resistance at 26,593 points, this product may present some trading opportunities.
Risk Warning:It should be noted that the leverage of the currently selected bull and bear certificates generally exceeds 20 times, offering ample elasticity but also higher volatility risks. Particularly, the recovery price of 25,295 points for the BOC Bull Certificate (61588) is close to the strong support level at 25,245 points, and if the Hang Seng Index unexpectedly plunges significantly, there is a risk of triggering forced redemption. Additionally, some short-term warrants have shorter remaining durations, and their time value erosion will accelerate as the expiration date approaches. It is not recommended to hold them long-term; instead, adjustments should be made promptly according to short-term movements and technical signal changes in the Hang Seng Index. At the same time, with the current market's wait-and-see sentiment being strong, the probability of the Hang Seng Index fluctuating within the range of 26,000 to 26,600 points is high. Whether choosing call warrants, put warrants, or bull and bear certificates, the certainty of directional judgment must be considered to avoid blindly chasing highs or bottom-fishing.
The Hang Seng Index’s technical outlook shows a divergence between bulls and bears. Would you choose low-premium call warrants for a steady layout, high-leverage bull certificates to bet on a breakout, or would you allocate put warrants to hedge against a market pullback?Feel free to leave your thoughts in the comment section! Want more analysis? Don’t forget to follow ‘HK Stock Warrants Jenny’ for daily updates!
Disclaimer: This article does not constitute any investment advice.
This article is for reference only and does not constitute any investment advice. The market data, opinions, and analysis contained herein may change at any time without prior notice. We shall not be liable for any loss or damage arising from reliance on the information in this article. Technical analysis merely indicates whether certain technical conditions are met; a comprehensive evaluation of asset performance should incorporate additional data. Trading decisions should not be based solely on the content of this article. Please note that past performance is not indicative of future results.
#Hang Seng Index #Hong Kong Stocks #Real-time Analysis #Warrants Selection #Warrants Strategy #Derivatives Hedging #Hong Kong Warrants Jenny #Blue Chip Stocks #Technology Stocks #Financial Stocks #Technical Analysis
Risk Disclaimer: The above content only represents the author's view. It does not represent any position or investment advice of Futu. Futu makes no representation or warranty.Read more

Comments
to post a comment
3