
跟聰明錢學投資!分享你的心水潛力股
Technical Analysis of Chinese Stocks (January 8): Alibaba/Baidu/Bilibili/Futu/PDD Holdings/Tencent Music/NetEase/JD.com/Tencent/Meituan/Kuaishou/Xiaomi
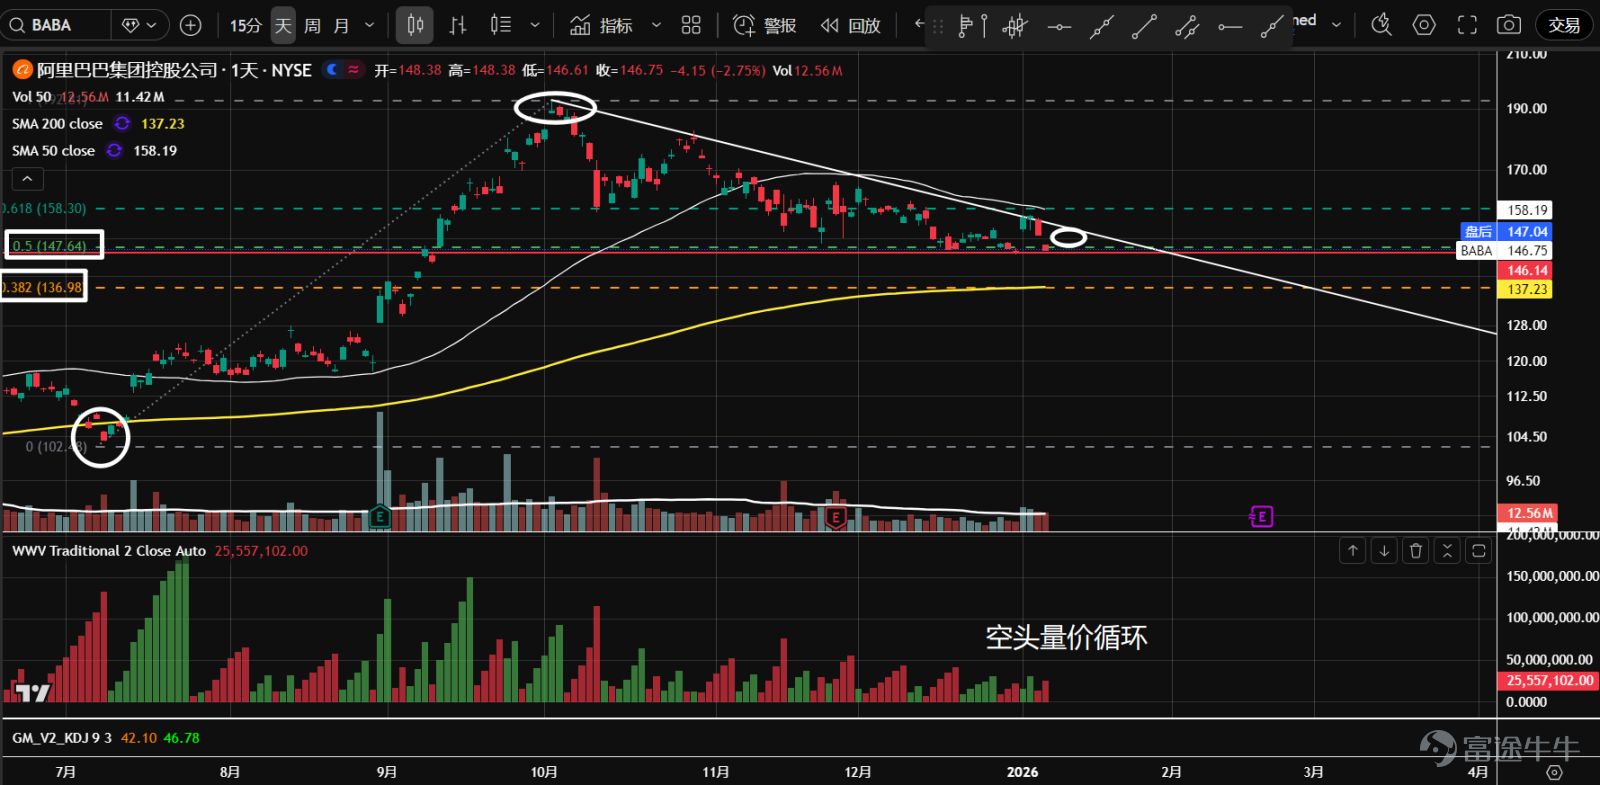
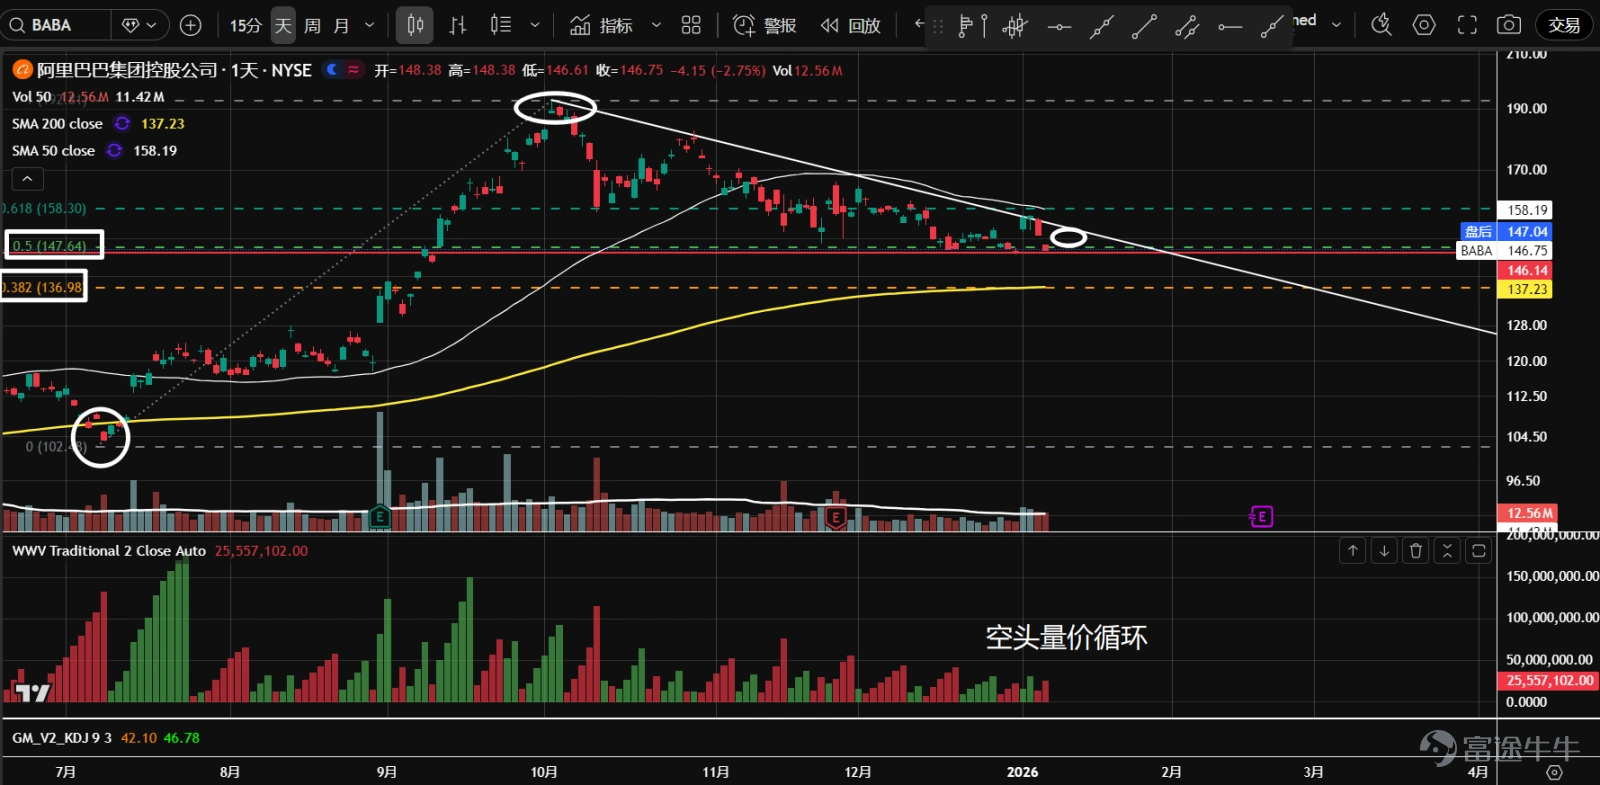
1、 $Alibaba (BABA.US)$ A descending triangle consolidation has found support at the 50% retracement level of the previous uptrend. It is moving towards the apex, with overall trading volume declining and no significant rebound yet. Bearish price-volume rotation indicates a potential breakdown, with the next support being the 38.2% retracement level.
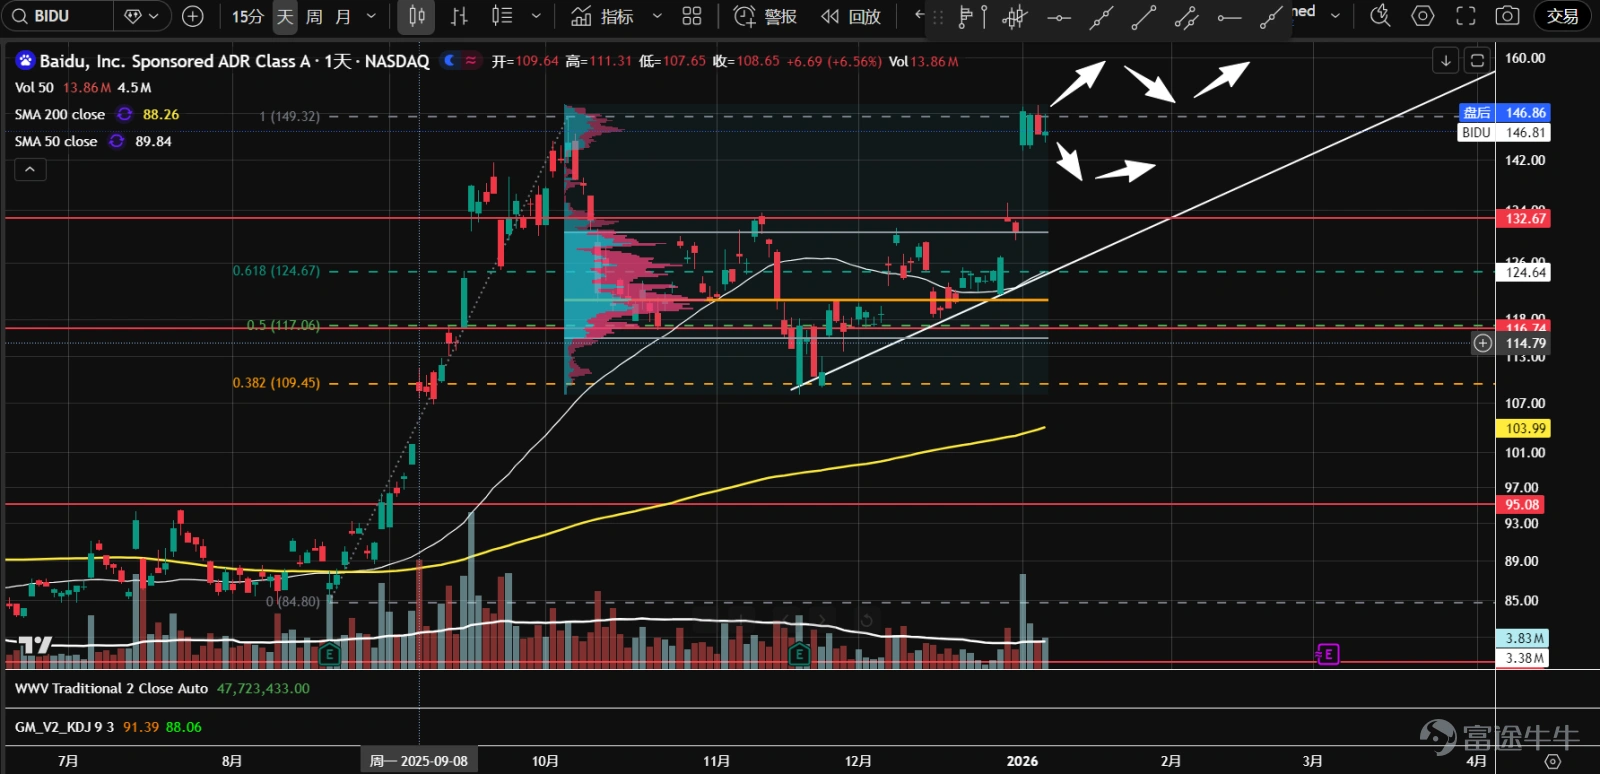
2、 $Baidu (BIDU.US)$ Trapped in range-bound trading since October, on January 2 it gapped up following positive news, surged to resistance near the prior high of 146, but failed to break through. If there’s a pullback on lower volume, or a breakout followed by a retest, a buying opportunity may arise.
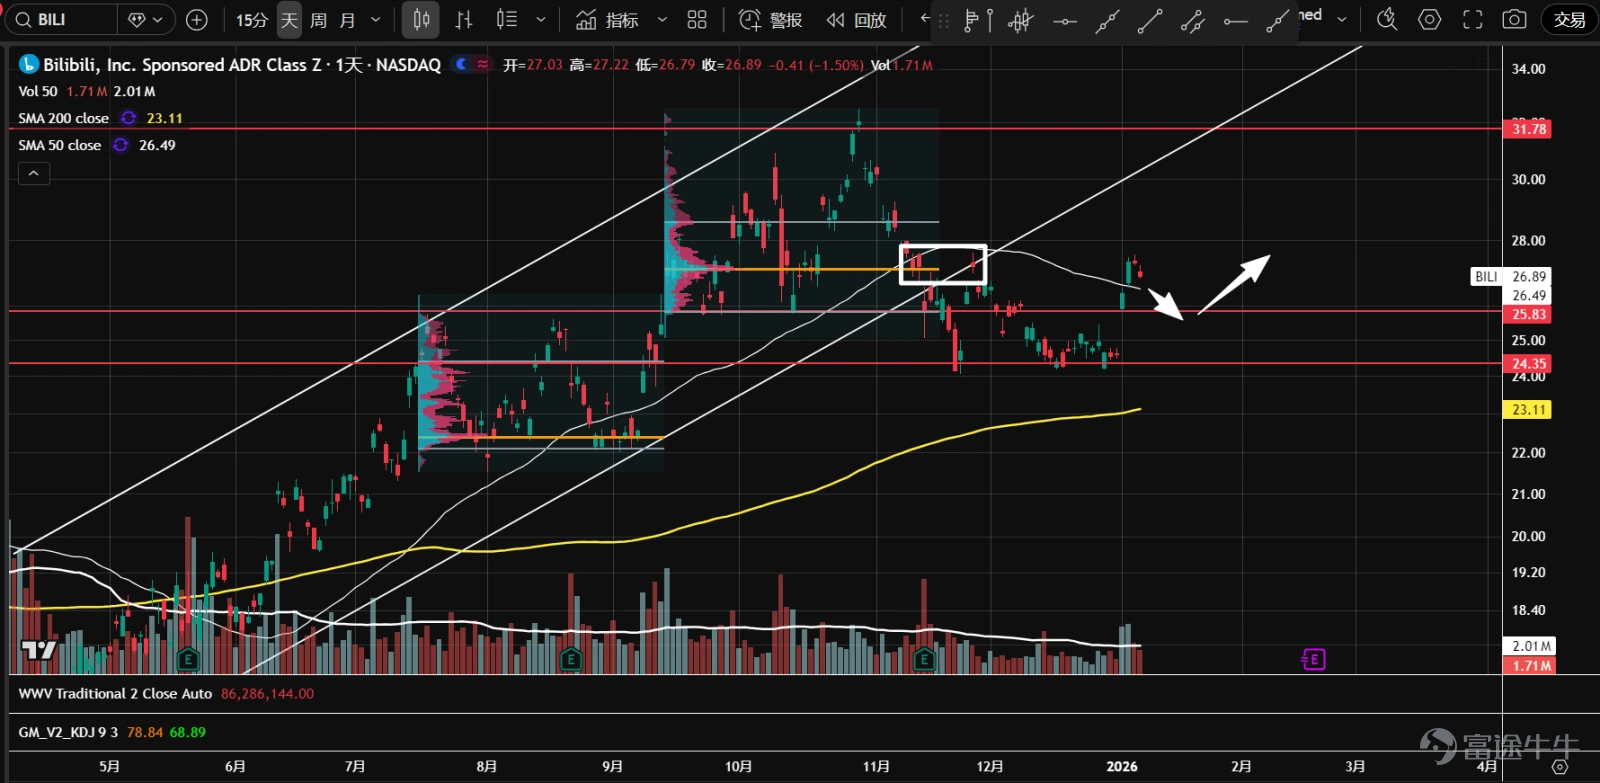
3、 $Bilibili (BILI.US)$ After successfully retesting and holding steady around 24.35, it saw two consecutive days of strong volume rebound, but was resisted at the value area control point (orange line). Watch for buying opportunities during subsequent pullbacks on reduced volume.
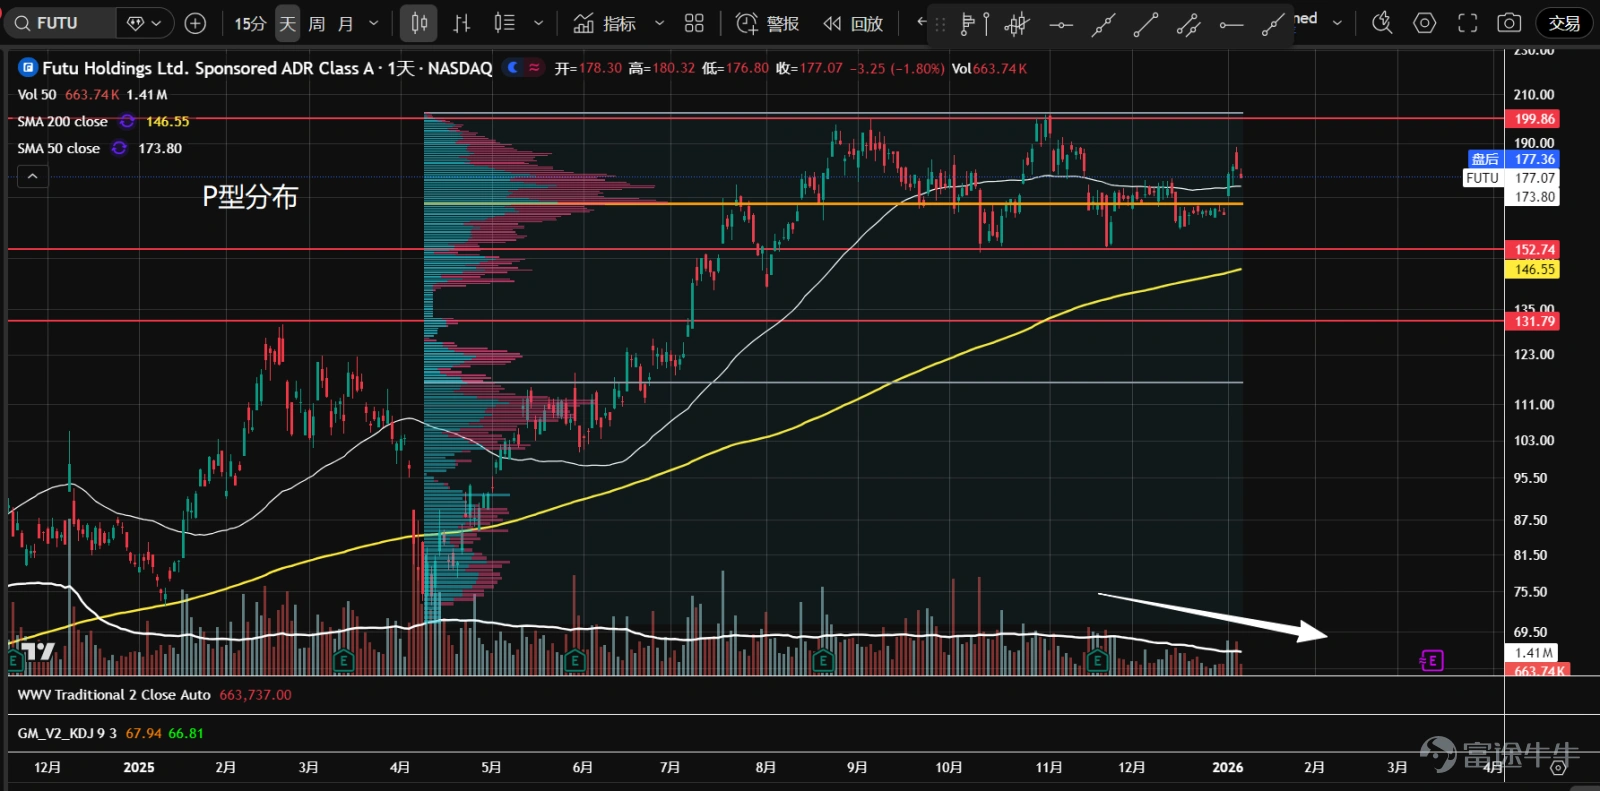
4、 $Futu Holdings Ltd (FUTU.US)$ Since August, it has entered a sideways consolidation and formed a P-shaped volume distribution, with increased divergence between bulls and bears at higher levels. The current stock price is near the volume control point (orange line), showing an unclear direction. Overall trading volume is declining, indicating a higher likelihood of accumulation.
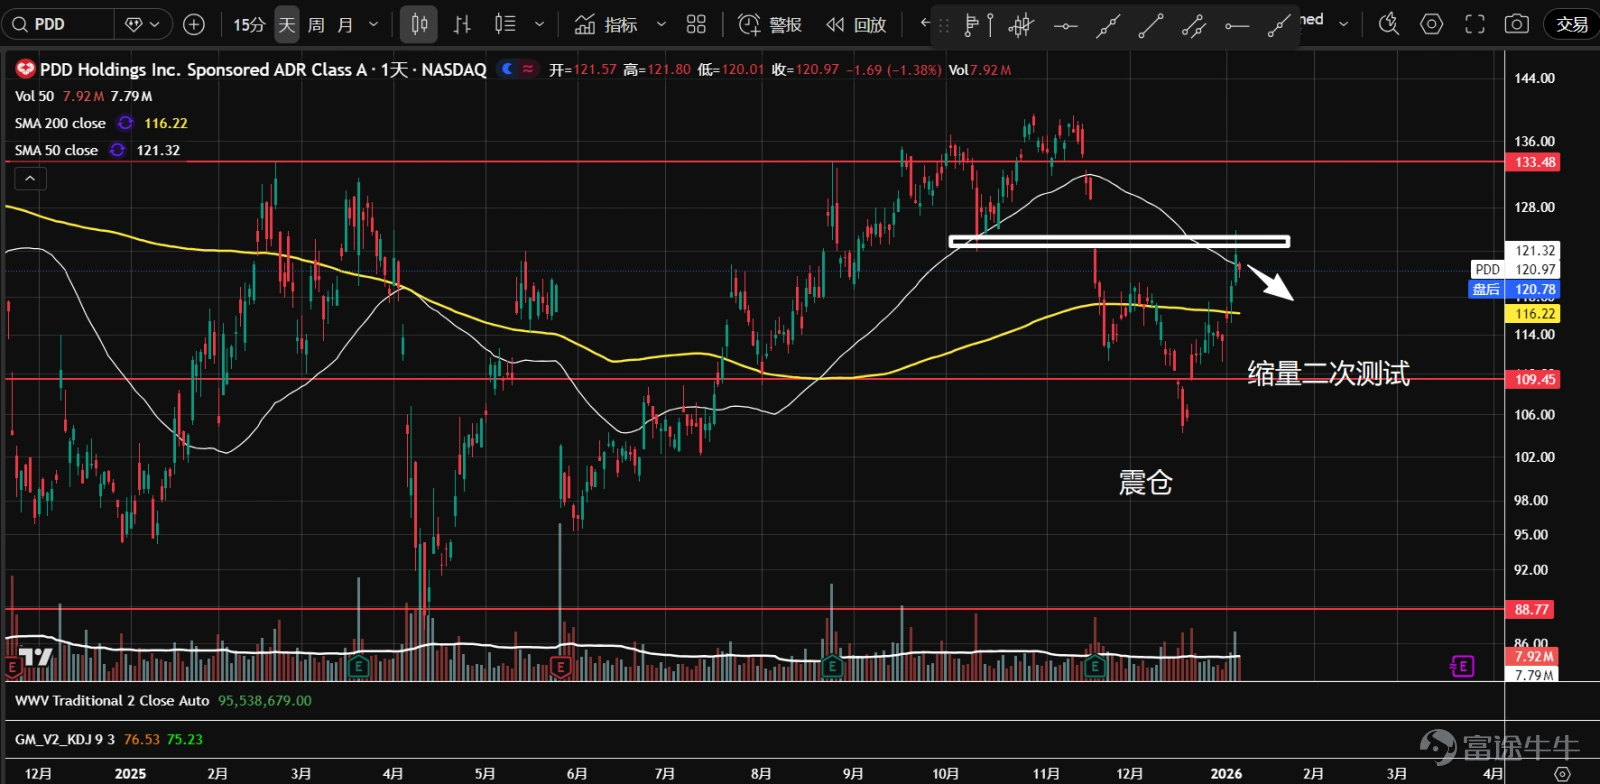
5、 $PDD Holdings (PDD.US)$ Since entering a large consolidation range in 2024, there was a shakeout near the pivot at 109.45 in December, followed by a low-volume secondary test, and then a significant upward movement continued. The stock price is currently facing resistance around 121, with a possible short-term pullback.
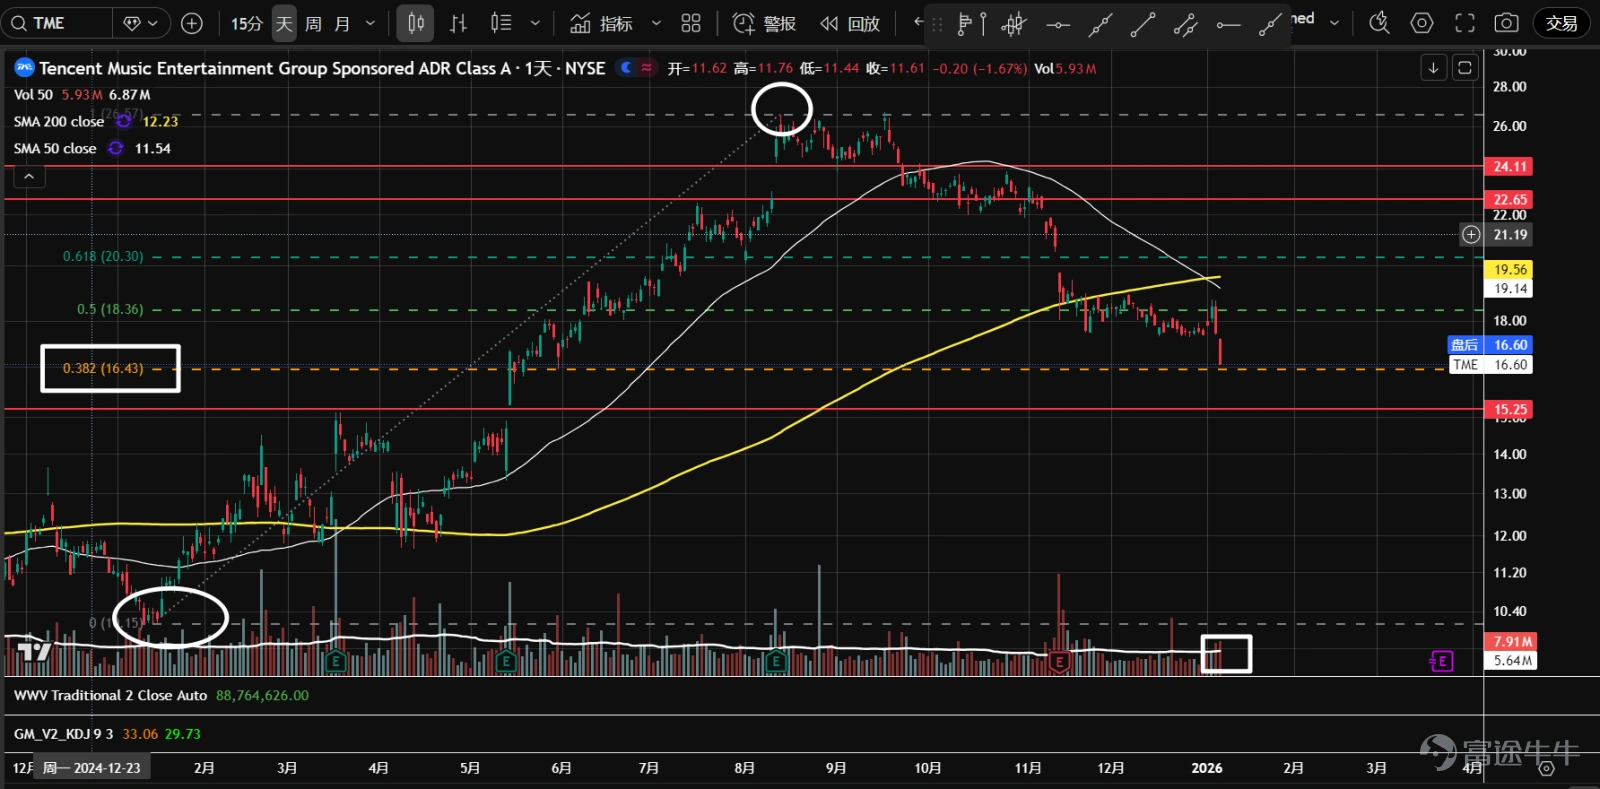
6、 $Tencent Music (TME.US)$ In mid-November, panic selling occurred without a noticeable surge in volume for a rebound, keeping the stock price sluggish with no significant demand entering. It has now broken down to the 38.2% retracement level, with trading volume starting to expand; watch for potential stabilization.
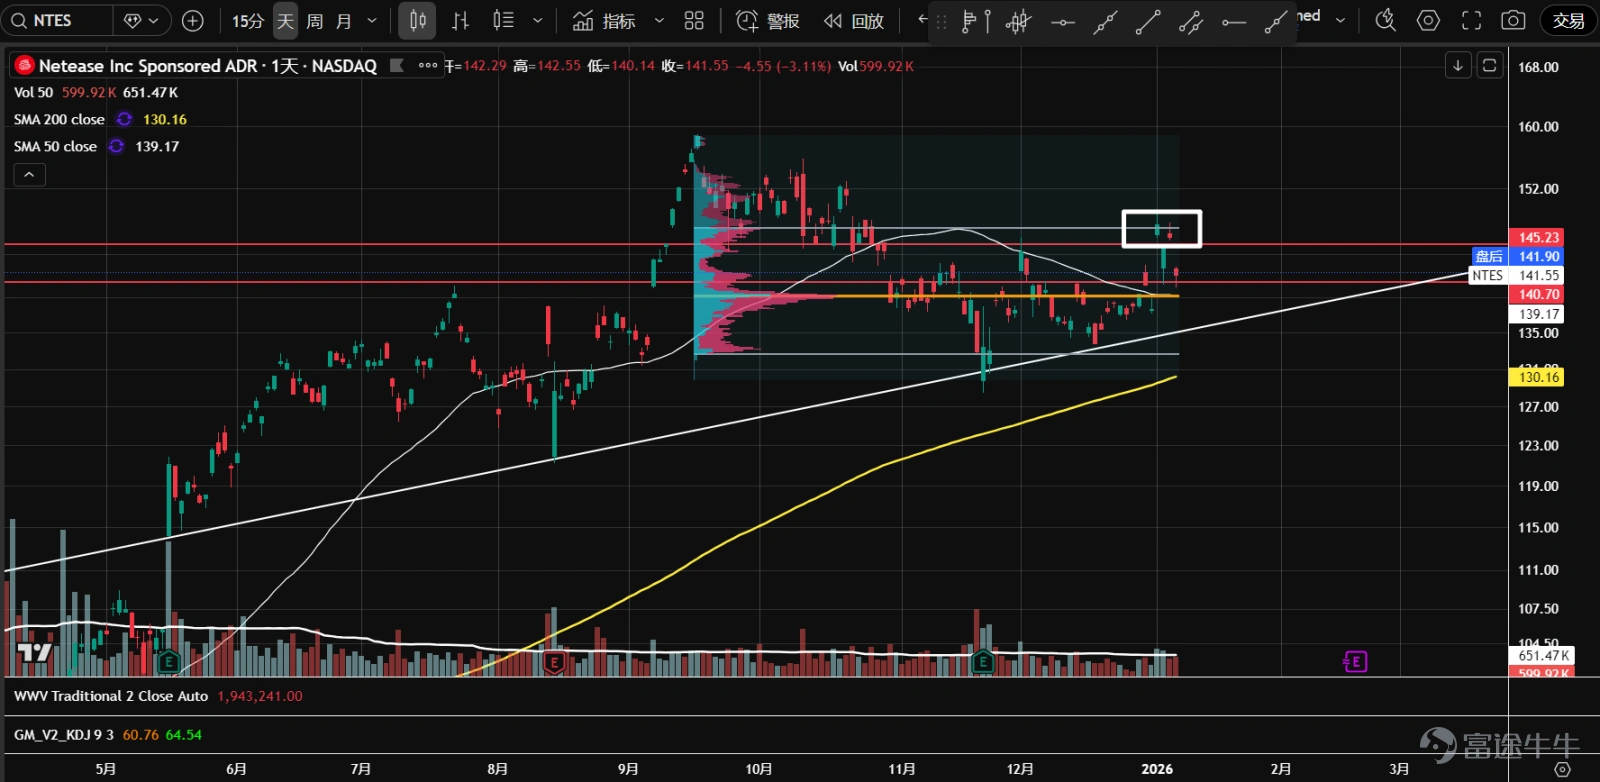
7、 $NetEase (NTES.US)$ Currently in a sideways consolidation, the latest rebound attempt was resisted at the upper value area (VAH). The stock price has retreated to the volume control point (orange line), with an unclear direction. Overall trading volume is decreasing, while the bottom is gradually rising, suggesting a higher probability of accumulation.
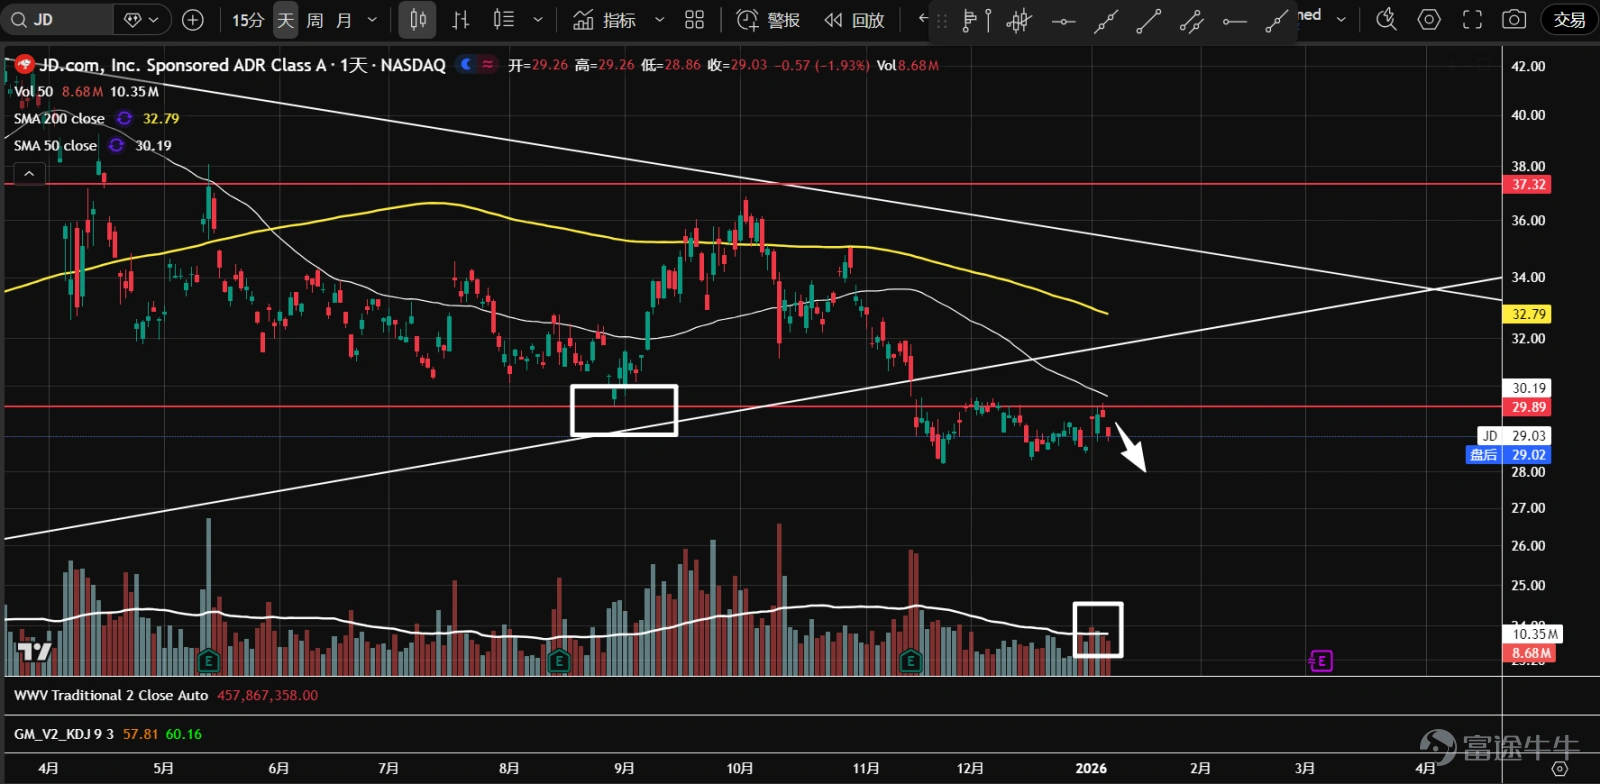
8、 $JD.com (JD.US)$ After breaking below the key support near 30, there were two rebound attempts to return within the range. The most recent low-volume rebound was again resisted, showing signs of high volume stagnation as supply begins to expand. The overall backdrop remains weak, and the downtrend may continue.
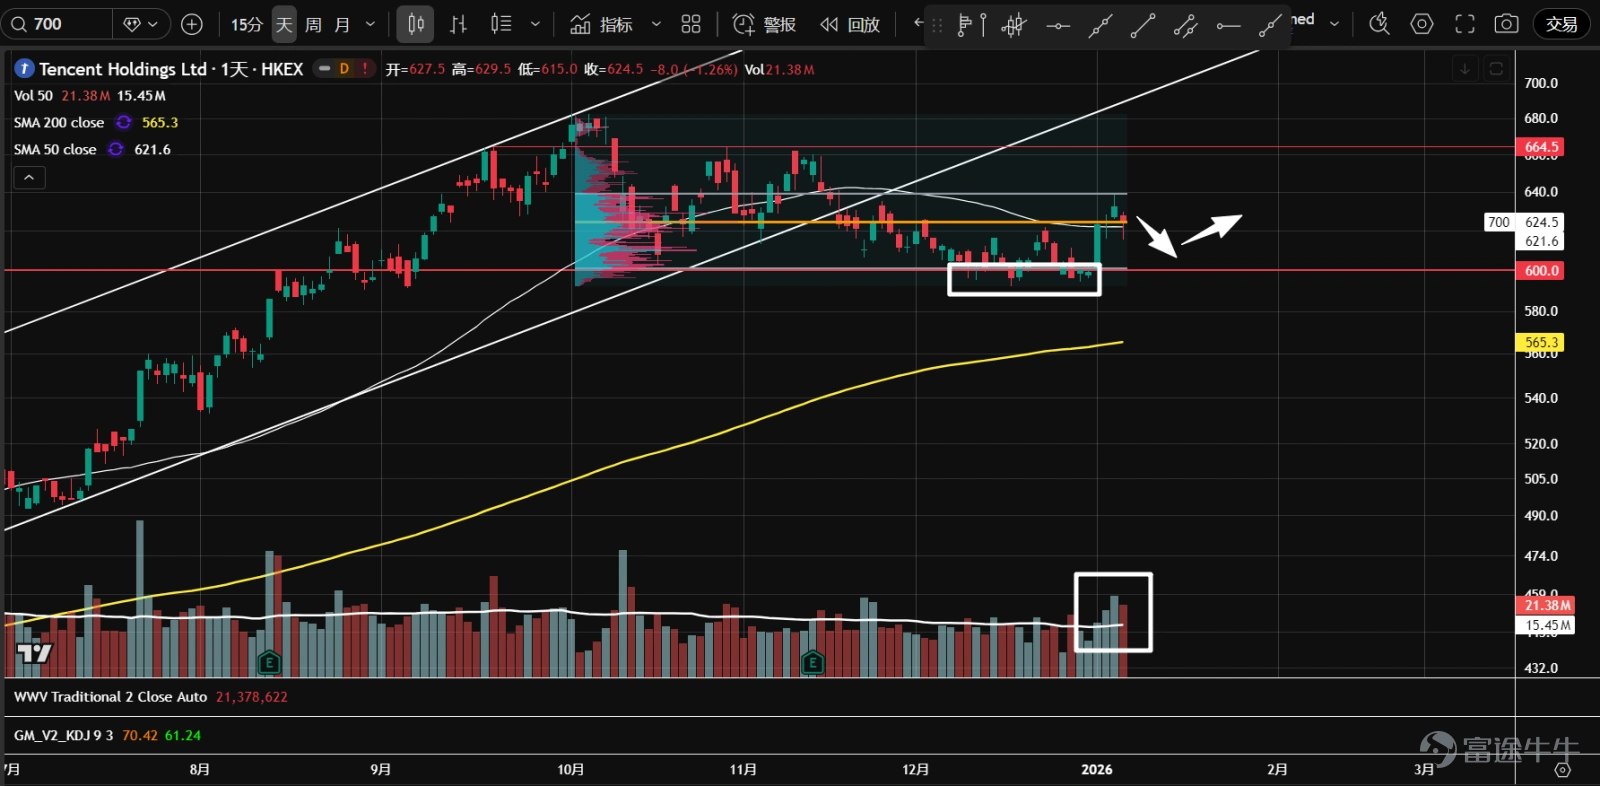
9、 $TENCENT (00700.HK)$ Since stabilizing with low volume near the 600 support level in December, there has been a surge in volume with a strong rebound in January. Signs of strength have emerged. Currently, the stock price is near the volume control point (orange line) within the range. If subsequent pullbacks are shallow and accompanied by reduced volume, it could be a potential entry opportunity.
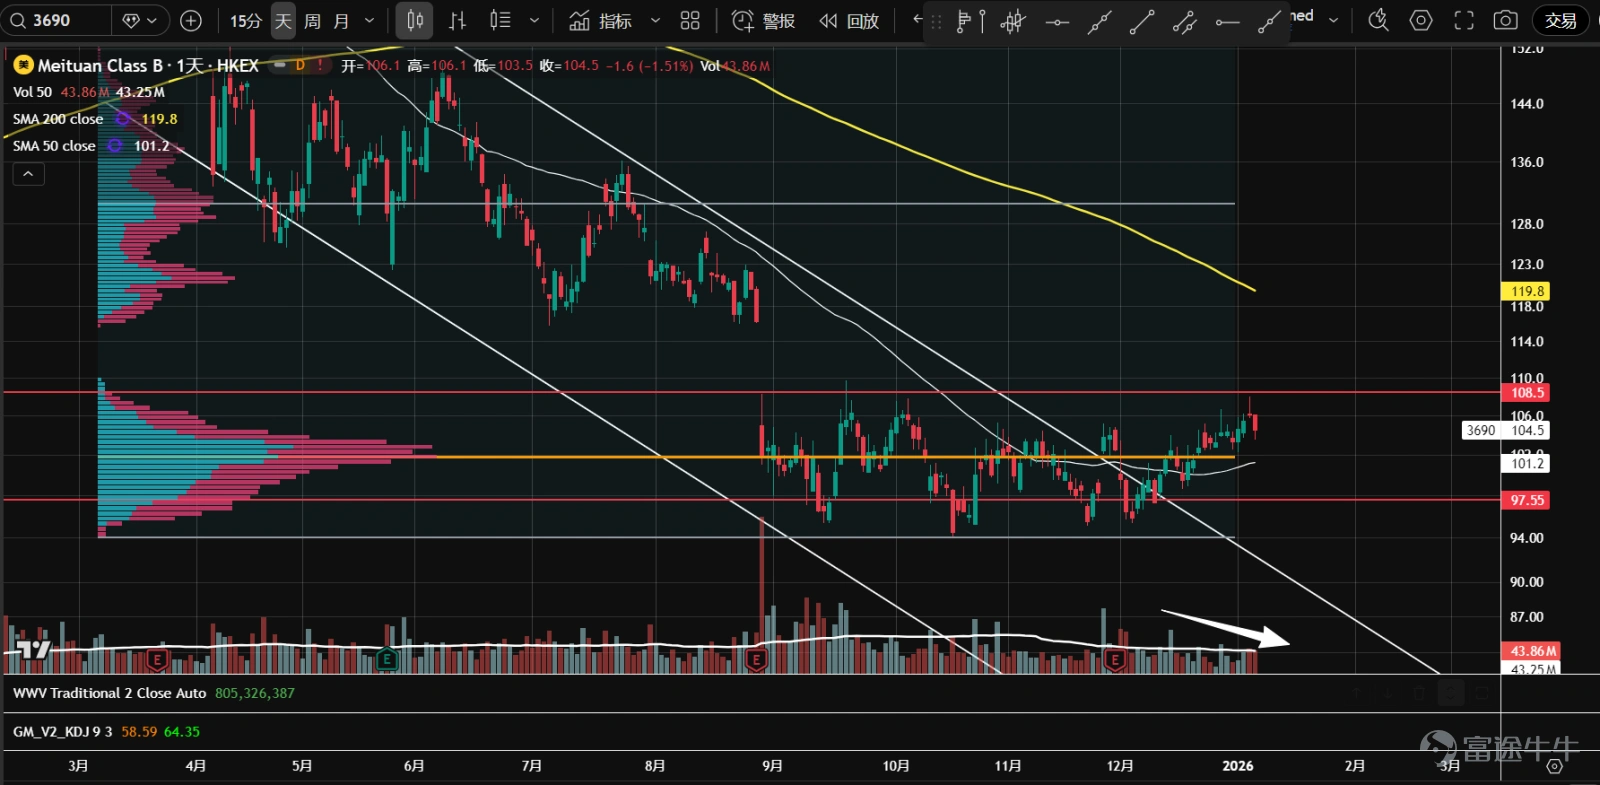
10、 $MEITUAN-W (03690.HK)$ Since September, the stock has been consolidating sideways and formed a b-shaped volume distribution, with increased divergence between bulls and bears at lower levels. The recent low-volume rebound faced resistance at the 108.5 range level, lacking sufficient demand, making an upward breakout challenging.
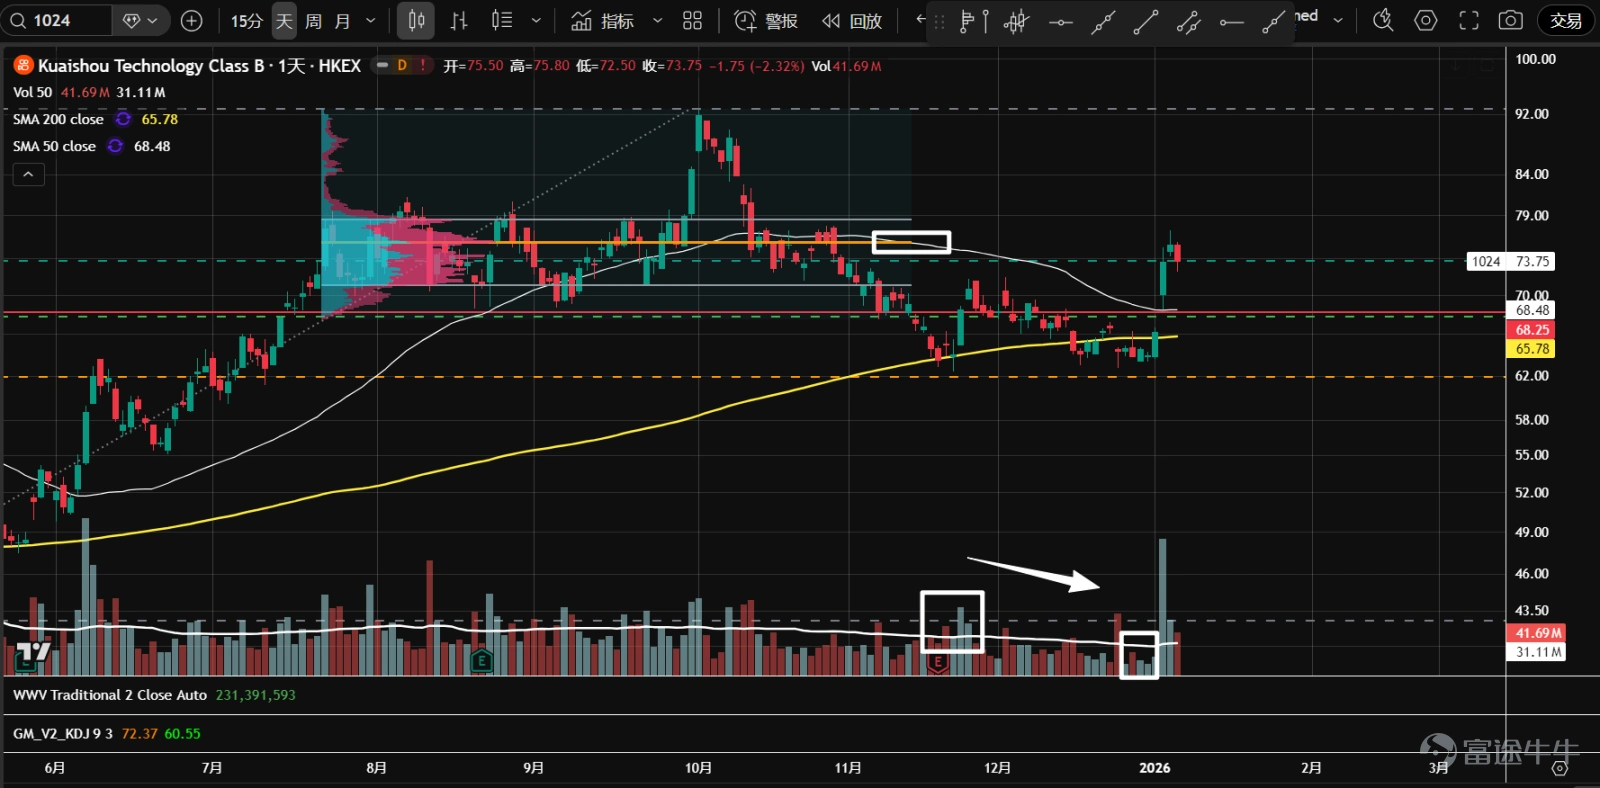
11、 $KUAISHOU-W (01024.HK)$ The stock repeatedly found support at the 38.2% retracement level of the previous upward move. After a low-volume secondary test in December, the stock price surged significantly on high volume but faced resistance at the volume control point (orange line) of the previous consolidation range. A short-term pullback is likely.
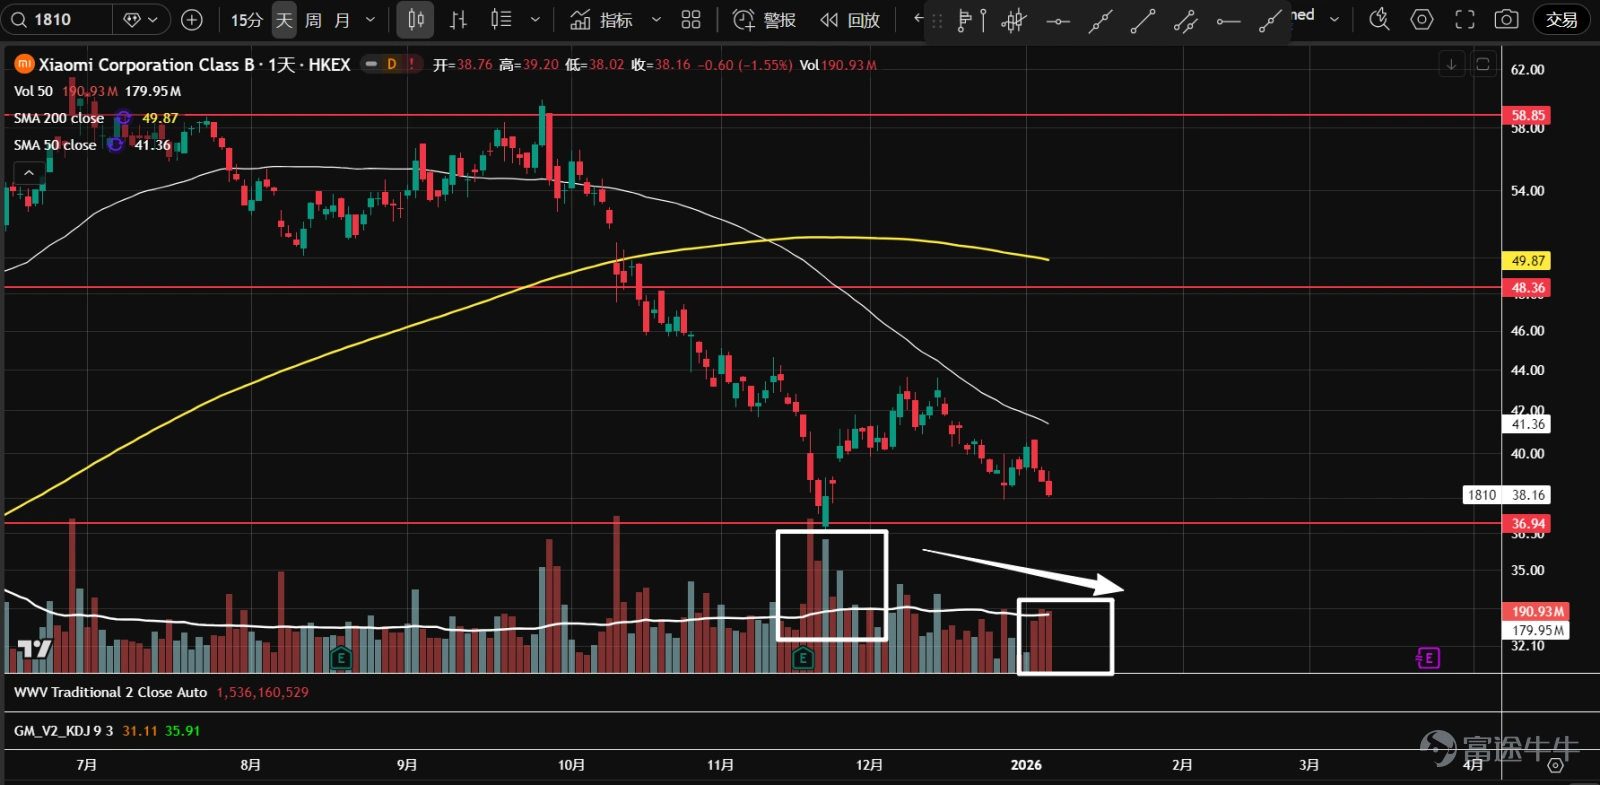
12、 $XIAOMI-W (01810.HK)$ Since the downward trend began in September last year, panic selling occurred near the 36.9 pivot level. After the natural rebound completed, the stock price is now undergoing a secondary test. Trading volume has significantly decreased compared to November, suggesting that it may gradually stabilize.
$S&P 500 Index (.SPX.US)$ $SPDR S&P 500 ETF (SPY.US)$ $NASDAQ 100 Index (.NDX.US)$ $Invesco QQQ Trust (QQQ.US)$ $Dow Jones Industrial Average (.DJI.US)$ $State Street® SPDR® Dow Jones Industrial Average® ETF Trust (DIA.US)$ $Russell 2000 Index (.RUT.US)$ $iShares Russell 2000 ETF (IWM.US)$ $Hang Seng Index (800000.HK)$ $Hang Seng TECH Index (800700.HK)$ $Hang Seng TECH Index ETF (03032.HK)$ $KraneShares CSI China Internet ETF (KWEB.US)$ $Direxion Daily FTSE China Bull 3X Shares ETF (YINN.US)$ $Direxion Daily FTSE China Bear 3X Shares ETF (YANG.US)$ $Invesco China Technology ETF (CQQQ.US)$
Risk Disclaimer: The above content only represents the author's view. It does not represent any position or investment advice of Futu. Futu makes no representation or warranty.Read more


Comments (5)
to post a comment
16