

Kicking off the year with a bang! Multiple sectors in Hong Kong's stock market are quietly gaining m
[Warrant Insights] Behind the Hang Seng Index’s unusual movements, a complete breakdown of the联动密码 between warrants and their underlying stocks
Based on technical data from January 7, $Hang Seng Index (800000.HK)$
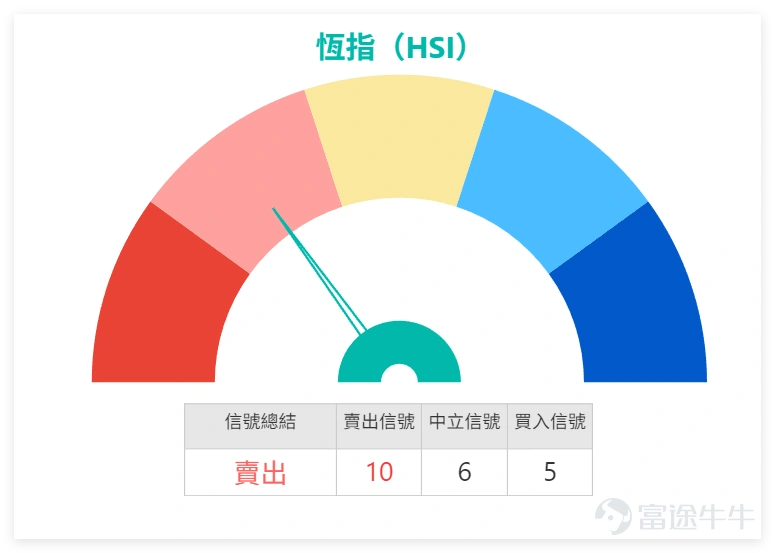
The Hang Seng Index closed at 26,458.95 points, down 0.94% for the day, with a trading volume of 276.134 billion Hong Kong dollars. The RSI index is at 61, and the technical indicators signal 'Sell' with a strength of 10; among various oscillation indicators, the CCI indicator shows an 'Overbought condition, Sell' signal, while the ADX indicator and Ichimoku Cloud both indicate 'Sell'. Only a few indicators like MACD signals and Bollinger Bands show 'Buy'.The current support levels for the Hang Seng Index are 25,892 points (Support 1) and 25,364 points (Support 2), with resistance levels at 26,883 points (Resistance 1) and 27,554 points (Resistance 2). In the short term, it needs to be seen whether the index can stabilize above the 26,500-point mark.
In the financial sector, $HSBC HOLDINGS (00005.HK)$Closed at 127.2 Hong Kong dollars, down 1.24%, with technical indicators showing a 'Strong Sell' signal. The stock price faces pressure near the middle line of the Bollinger Bands.$AIA (01299.HK)$Closed at 85.95 Hong Kong dollars, slightly down by 0.12%. Multiple oscillation indicators show an overbought condition, indicating significant short-term adjustment pressure.$PING AN (02318.HK)$Closed at 71.1 Hong Kong dollars, down 1.25%. The RSI reached 84, which is in the overbought zone, with technical signals showing 'Strong Sell'.$CCB (00939.HK)$Closed at 7.62 Hong Kong dollars, down 1.42%. The stock price is below all major moving averages, reflecting weak technical patterns.
In terms of technology stocks, $TENCENT (00700.HK)$Closed at 624.5 Hong Kong dollars, down 1.26%. The MACD signal weakened, and the overall technical summary indicates 'Sell'.$BABA-W (09988.HK)$Closed at 145.9 Hong Kong dollars, down 3.25%. The stock price broke below the MA10 and MA30, with a trading volume reaching 21.759 billion Hong Kong dollars, reflecting strong selling pressure.$MEITUAN-W (03690.HK)$Closed at 104.5 Hong Kong dollars, down 1.51%. Technical indicators are 'Neutral' but leaning towards 'Sell'; it remains to be seen if the stock can hold above the 100-dollar level.
Consumer and real estate stocks,$GEELY AUTO (00175.HK)$ Closed at HKD 17.51, down 1.79%, with an RSI of 53 indicating neutrality, but volume supported the decline. $LINK REIT (00823.HK)$ Rose against the trend by 1.11%, closing at HKD 34.58; technical signal is 'Buy', making it one of the few better-performing blue chips. $BOC HONG KONG (02388.HK)$ Closed at HKD 39.42, down 1.15%, with technical indicators showing a 'Sell' signal.
Overall, the Hong Kong stock market was under pressure on January 7, with many blue-chip stocks showing weakening technical patterns. The financial and technology sectors led the declines, while only a few utility stocks demonstrated resilience. Investors should focus on oversold rebound opportunities and risk management.January 7 [HK Stocks Podcast] Hang Seng Index, Hong Kong Exchange, Yanzhou Energy, AIA, China Mobile, Alibaba $HKEX (00388.HK)$$AIA (01299.HK)$$CHINA MOBILE (00941.HK)$$BABA-W (09988.HK)$
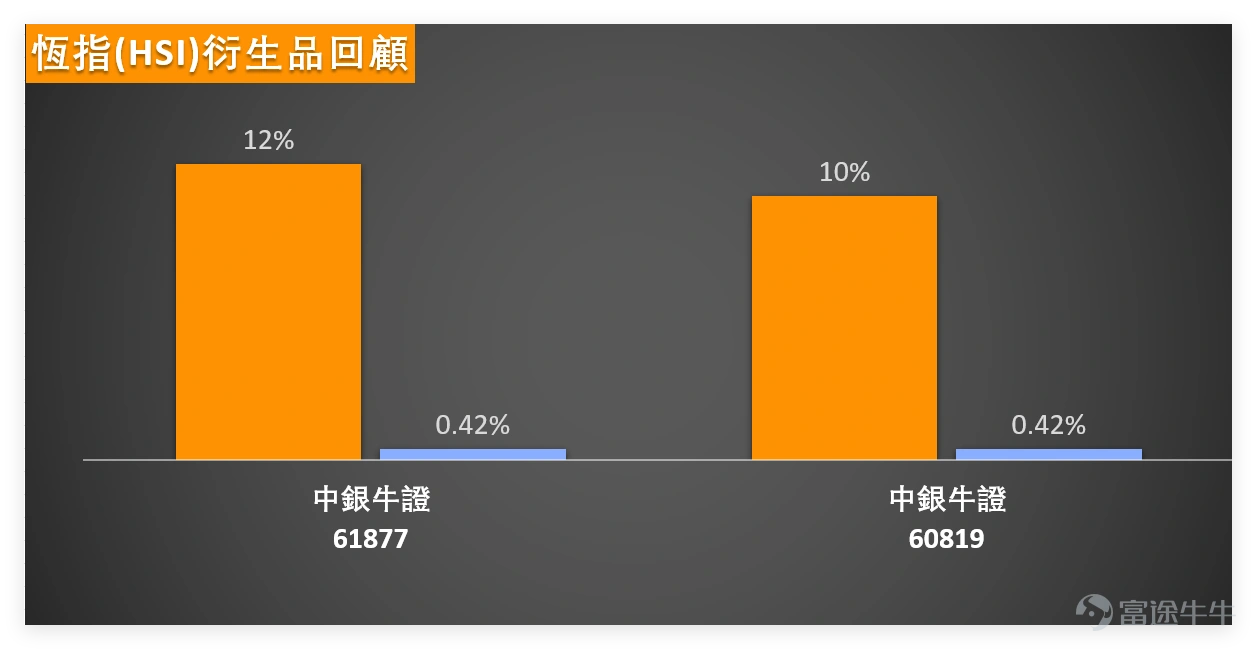
The linkage between Hang Seng Index movements and CBBCs showed that on January 5, 2026, the Hang Seng Index rose slightly by 0.03% to 26,347.24 points. Two BOC Bull Contracts tracking the Hang Seng Index experienced significant gains over the following two days: $BI#HSI RC2808J.C (61877.HK)$ Gained 12% two days later, $BI#HSI RC2808L.C (60819.HK)$ While another gained 10% two days later, far exceeding the Hang Seng Index’s 0.42% increase during the same period, fully demonstrating the leverage effect of CBBCs.
It's important to note that CBBC price movements are closely tied to the underlying asset (here, the Hang Seng Index). When the Hang Seng Index rises, Bull Contracts (call CBBCs) will follow suit, and the higher the leverage, the greater the potential gain during underlying asset volatility. Conversely, when the Hang Seng Index falls, Bear Contracts (put CBBCs) have the advantage. Key factors influencing CBBC performance include not only leverage but also premium and implied volatility – the lower the premium, the more reasonable the CBBC price relative to the underlying asset, offering better value; the smaller the implied volatility, the relatively lower the risk of CBBC price fluctuations.
Based on the current market situation and CBBC linkage logic, we have screened out four higher-value CBBCs from the pool for investors' reference.
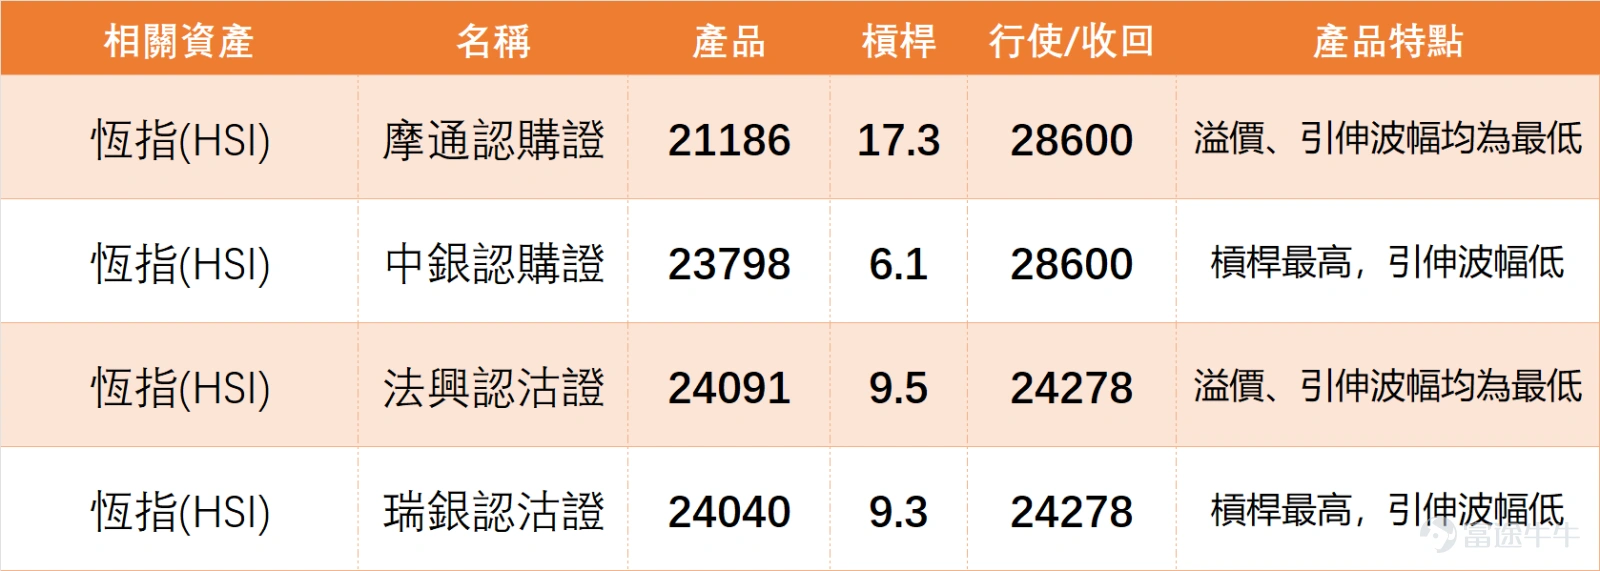
First, let's look at the call direction, $JP-HSI @EC2603A.C (21186.HK)$With a leverage of 17.3 times and an exercise price of 28,600 points, it has the lowest premium and implied volatility. When the Hang Seng Index rebounds, the characteristics of low premium and low implied volatility can reduce investors' cost risks, making it more secure.$BI-HSI @EC2609A.C (23798.HK)$With a leverage of 6.1 times and the same exercise price of 28,600 points, although its leverage is not as strong as the former, the implied volatility is low, making it suitable for investors with lower risk tolerance who prefer stability.
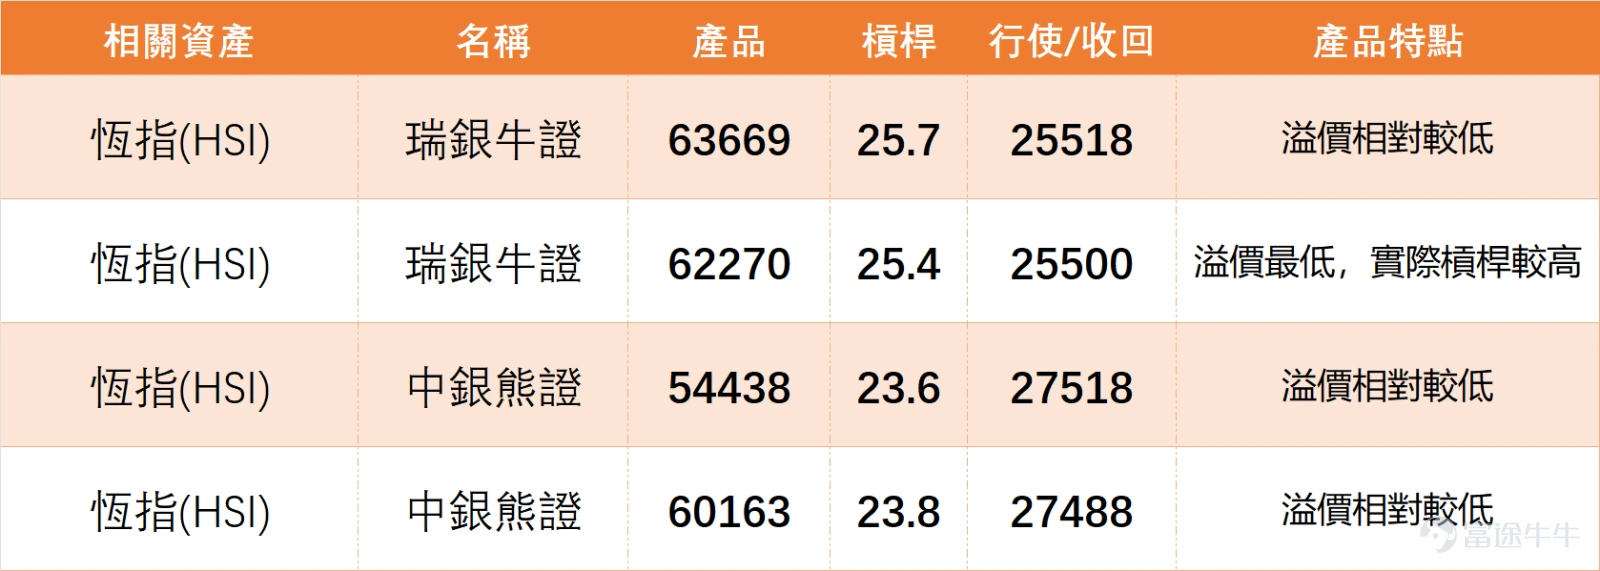
Looking at the put direction,$SG-HSI @EP2606A.P (24091.HK)$With a leverage of 9.5 times and an exercise price of 24,278 points, it has the lowest premium and implied volatility. If the Hang Seng Index fails to continue its rebound and returns to a downward trend, this target would be a better choice.$UB#HSI RC28116.C (62270.HK)$With a leverage of 25.4 times and a recovery price of 25,500 points, it has the lowest premium and relatively higher actual leverage, making it suitable for investors who are optimistic about the Hang Seng Index rebounding and can tolerate some level of risk.
Recommendation:Fellow investors who already hold the selected CBBCs can set profit-taking levels based on the corresponding exercise prices; for instance, investors holding J.P. Morgan call warrants (21186) can set their profit-taking levels near the warrant price corresponding to the 28,600-point exercise price. Fellow investors who have not yet entered the market should avoid chasing targets that have already risen significantly in the short term, as intraday fluctuations could be due to short-term speculative capital. It is recommended to prioritize targets with low premiums and low implied volatility, such as J.P. Morgan call warrants (21186) and Societe Generale put warrants (24091). These types of targets carry lower risks and offer better value during underlying stock volatility.
Risk Warning:Intraday fluctuations may be caused by short-term speculative capital. Without sustained trading volume support from the underlying stocks, CBBCs can experience pullbacks anytime. Before entering the market, carefully review the real-time premium rate and trading volume of the CBBCs, avoiding targets with excessively high premiums or low trading volumes to ensure timely buying and selling. Additionally, CBBCs are leveraged products with high volatility, so investors must allocate funds according to their own risk tolerance and avoid blindly following trends.
Did you catch the CBBC market movement after the Hang Seng Index fluctuation on January 5? Do you think the Hang Seng Index can sustainably break through the resistance level of 26,883 points?Feel free to leave your thoughts in the comment section! Want more analysis? Don’t forget to follow ‘HK Stock Warrants Jenny’ for daily updates!
Disclaimer: This article does not constitute any investment advice.
This article is for reference only and does not constitute any investment advice. The market data, opinions, and analysis contained herein may change at any time without prior notice. We shall not be liable for any loss or damage arising from reliance on the information in this article. Technical analysis merely indicates whether certain technical conditions are met; a comprehensive evaluation of asset performance should incorporate additional data. Trading decisions should not be based solely on the content of this article. Please note that past performance is not indicative of future results.
#Hang Seng Index #Hong Kong Stock Movement #Warrants Real-time Analysis #Intraday Opportunities #Hong Kong Stock Warrants Jenny #Warrants Selection #Warrants Strategy #Derivatives Hedging #Short-term Rebound of Hang Seng Index #Warrants Leverage Effect
Risk Disclaimer: The above content only represents the author's view. It does not represent any position or investment advice of Futu. Futu makes no representation or warranty.Read more


Comments
to post a comment
2