
Kicking off the year with a bang! Multiple sectors in Hong Kong's stock market are quietly gaining m
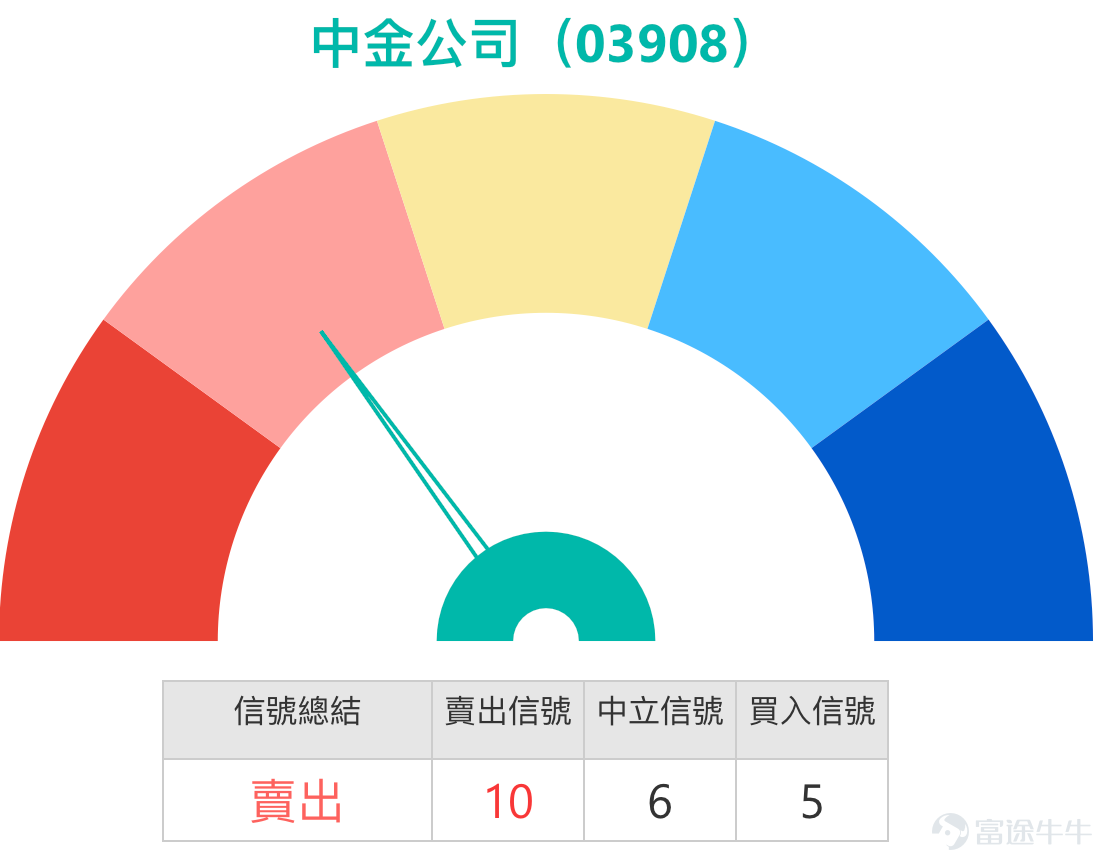
Combining column insights with technical indicators: CICC shows strong momentum but RSI signals overbought risks
As of January 6, 2026, CICC's stock price showed extremely strong performance, closing at 22.24 yuan with a single-day increase of up to 8.70%, and trading volume surged to 1.38 billion yuan. This performance was not isolated, as the Hong Kong stock market strengthened overall that day, with the Hang Seng Index rising by 1.38%. Both the China Enterprise Index and the technology index gained over 1%, and the Chinese broker sector maintained strength throughout the day, with China Merchants Securities $CMSC (06099.HK)$ surging over 12%, China Galaxy $CGS (06881.HK)$ , CITIC Securities $CITIC SEC (06030.HK)$ and other leading broker stocks collectively rising, indicating a comprehensive shift to optimism in market sentiment towards the brokerage sector. Today (January 7), CICC continued to strengthen, rising against the trend by 3.42% to reach 23 yuan per share.
Technical indicators present complex signals; overbought risks warrant caution
From a technical analysis perspective, CICC currently exhibits a complex mix of bullish and bearish signals. On one hand, multiple momentum indicators are signaling positive trends. The MACD indicator clearly shows a buy signal, indicating that short-term upward momentum is strengthening. The CCI indicator also presents a buy signal, with its value at 108.85, suggesting that the stock may have entered a strong region. Additionally, the Bollinger Bands support the buy view, showing that prices are running in the upper-middle band, with an upward trend. However, overbought risks have emerged. Most notably, the RSI indicator has reached a high of 79, firmly entering the overbought zone. Although the system currently interprets this as 'neutral for buying or selling', historical experience suggests that such high RSI values often indicate accumulating short-term adjustment pressures. The Williams %R indicator also confirms the overbought condition. After combining multiple indicators, the system gives a 'sell' conclusion signal, although the intensity rating is only 10, it serves as a warning for investors. This contradiction in technical indicators precisely reflects the tug-of-war between current market exuberance and rationality.

Key price analysis shows coexistence of upside potential and resistance
In terms of key technical price levels, CICC is facing an important resistance test. The current stock price of 22.24 yuan is close to the first resistance level of 23.8 yuan. If it can break through effectively, it may open up room for further gains and challenge the second resistance level of 36 yuan. On the downside, 14.6 yuan forms a short-term key support, while 8.5 yuan is an important long-term defense line. The moving average system as a whole shows a positive trend, with the short-term MA10 at 19.90 yuan and MA20 at 19.70 yuan both giving buy signals. MA50 at 20.06 yuan also supports a buy view. Notably, a 'Golden Cross' pattern has formed on the technical chart, where the 10-day moving average successfully crosses above the 20-day moving average. From a traditional technical analysis perspective, this is considered a typical bullish signal, often foreshadowing a possible shift to a positive mid-term trend. However, the MA200 line remains at 20.41 yuan and shows a sell signal, suggesting that a full reversal of the long-term trend still needs time to confirm.
Market environment and policy background support the logic of the brokerage sector
Observing the market environment, A-shares have recently performed strongly, rising to a ten-year high. This strong market atmosphere naturally benefits the brokerage sector, which acts as an intermediary in the market. As Niki, director of BOC International, pointed out in her column [BOC Visit], with the profit-making effect of the stock market becoming evident, more and more investors are beginning to refocus on the stock market, significantly increasing market trading activity. Looking back at last year, both the Hong Kong stock market and the mainland securities market were in a continuous growth environment, with IPO activities in the Hong Kong market notably increasing, providing growth opportunities in underwriting and sponsorship businesses for leading brokerages represented by CICC. Increased trading volume directly boosts commission income, while improved financial product sales enhance company profitability. The resonance between these fundamentals and market sentiment forms the core logic behind the rise of brokerage stocks. As an industry leader, CICC's diversified business spans investment banking, wealth management, institutional services, and other fields, allowing it to fully benefit from increased capital market activity.
Derivative tools provide leveraged participation paths
For investors seeking higher risk-reward ratios, the market also offers relevant derivative tools. As mentioned in BOC International’s column, the CICC call warrant 22280$BI-CICC@EC2605A.C (22280.HK)$, with a strike price of 29.18 yuan, expiring in May 2026, provides about 4x leverage. Alternatively, the HSBC call warrant 18277$HS-CICC@EC2601A.C (18277.HK)$, with a strike price of 23.88 yuan, offering approximately 10.8x leverage, but note the expiration date is January 23. These types of warrant products provide leveraged participation opportunities for investors optimistic about CICC's short-term performance, but attention must be paid to their time value decay and higher risk characteristics, making them more suitable for professional investors with accurate market timing judgment.

Risk warnings and operational recommendations
Overall, CICC shows strong short-term technical momentum, positive market sentiment, and benefits fundamentally from increased capital market activity, with multiple factors supporting share price performance. However, investors must recognize that current technical indicators already show overbought signals, with RSI nearing the 80 level, indicating increasing short-term pullback risks. It is recommended that investors who already hold positions consider reducing some holdings to lock in profits when the share price approaches the resistance level of 23.8 yuan; those not yet invested should avoid chasing highs and wait for a pullback to the support zone to find a safer entry point. In the medium term, if the A-share market remains active, the logic for the brokerage sector still holds, but short-term volatility risks need careful management.
Friendly reminder: This article does not constitute any investment advice.
This article is for reference only and does not constitute any investment advice. The market data, opinions, and analysis contained herein may change at any time without prior notice. We shall not be liable for any loss or damage arising from reliance on the information in this article. Technical analysis merely indicates whether certain technical conditions are met; a comprehensive evaluation of asset performance should incorporate additional data. Trading decisions should not be based solely on the content of this article. Please note that past performance is not indicative of future results.
#CICC #TechnicalAnalysis #SupportResistanceLevels #BrokerageSector #AStockMarket #OverboughtRisk #GoldenCross #MarketSentiment #HongKongStockMarket #Derivatives
Risk Disclaimer: The above content only represents the author's view. It does not represent any position or investment advice of Futu. Futu makes no representation or warranty.Read more
Comments
to post a comment
10