
Kicking off the year with a bang! Multiple sectors in Hong Kong's stock market are quietly gaining m
Divergent views on Tencent: Optimists target 700, while cautious investors focus on overbought correction risks
$TENCENT (00700.HK)$ Divergent views on Tencent: Optimists target 700, while cautious investors focus on overbought correction risks
Tencent (00700) closed at HKD 624.5 yesterday (5th), up 0.24% for the day, successfully holding above the HKD 620 level. The stock price has recently formed a triple-bottom breakout pattern, accompanied by a technical signal where the 10-day moving average crosses above the 20-day moving average. The market is closely watching for the next directional move. As of today (6th), the stock is trading at HKD 637.5, up 2.08%.
Technical Chart Analysis
Tencent's stock price has recently exhibited a triple bottom breakout pattern, which is typically viewed as a potential signal of strengthening trends. The stock price is currently fluctuating around the HKD 620 level, which holds dual technical significance as both the 100-day moving average and a key retracement level from the previous upward wave, increasing the importance of this price point.
From the perspective of the moving average system, the 10-day moving average (HKD 608.15) has successfully crossed above the 20-day moving average, forming a short-term 'Golden Cross.' This technical phenomenon is often interpreted as a sign of increasing short-term momentum, providing some technical support for the stock price. Meanwhile, several technical indicators show divergence: the RSI indicator is at 57, in the neutral-to-strong region, while the Williams %R and Stochastic Oscillators indicate overbought conditions. The MACD indicator issues a buy signal, but multiple oscillators remain neutral. This indicator divergence reflects varying market expectations at the current price level, suggesting that a directional choice may be imminent in the short term.
Notably, in the January 5 column [HK Stock Podcast], investors also inquired about Tencent. Tencent Holdings (00700.HK): What is the short-term resistance level? In the structured product market, some investors believe that the rounded top has already formed and are now betting on a decline, holding bearish contracts with a stop-loss level at HKD 640.
Simon: Finally, let me talk about one more stock, which is the highly followed Tencent (0700.HK). Tencent’s stock price continued to rise slightly today (on the 5th). Compared to other stocks mentioned earlier, today’s gains were not particularly significant, but it still rose with supportive trading volume. It's worth noting that the RSI indicator has started to edge higher, reaching 71, which serves as a reference point for everyone.
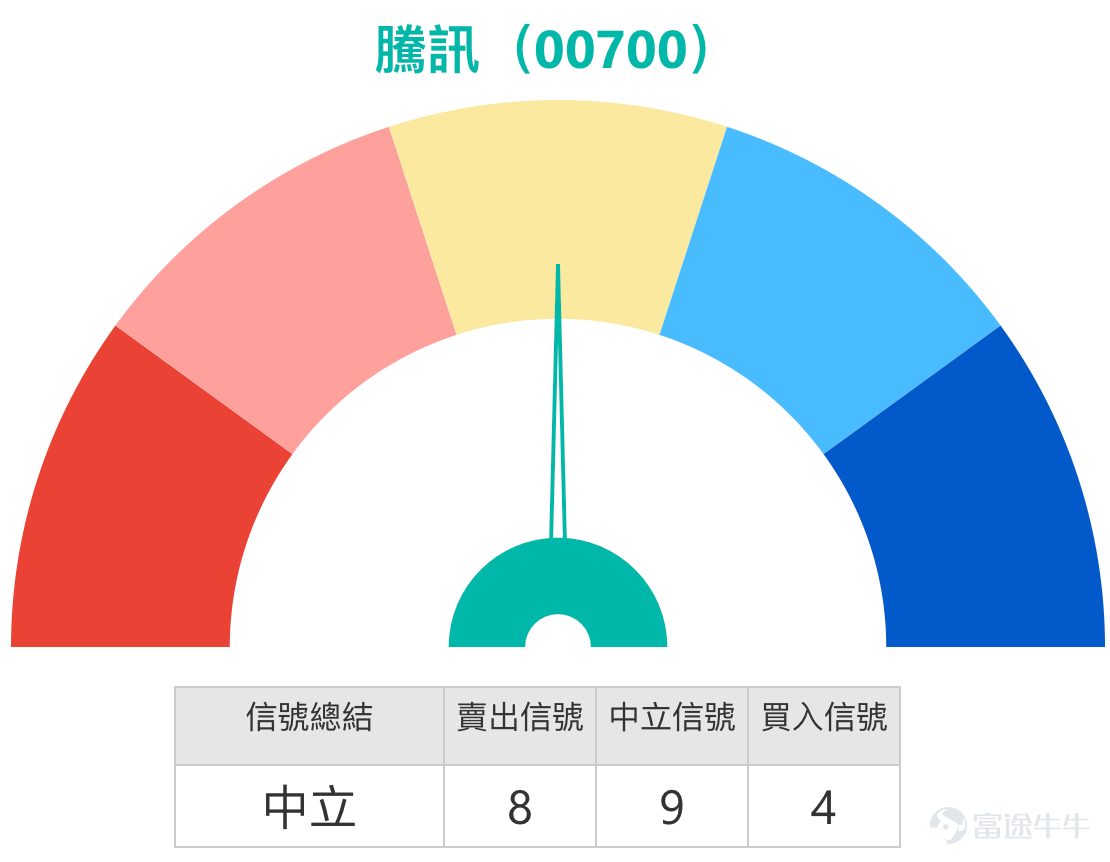
Some investors are concerned about where the short-term resistance level lies and whether the stock might start to pull back once it reaches a certain point. In the structured product market, some investors have begun deploying products betting on a downward move. In the short term, Tencent’s resistance level appears to be around HKD 629; if it breaks through, it could potentially rise to HKD 657, which is provided for your reference. Regarding the overall technical signals, Tencent remains 'neutral' for now without a clear direction. Therefore, whether you’re bullish or bearish, don’t be too aggressive when the technical signals are neutral—this is something to keep in mind.
![$TENCENT (00700.HK)$ Divergent views on Tencent: Optimists target 700, while cautious investors focus on overbought correction risks [Share Link: January 5th [HK Stocks Podcast] Hang Seng Index, Kuaishou, Wuxi Apptec, AIA, Xiaomi Group, Tencent] Tencent (00700) closed at HKD 624.5 yesterday (5th), up 0.24% for the day, successfully holding above the HKD 620 level. The stock price has recently formed a triple-bottom breakout pattern, accompanied by a technical signal where the 10-day moving average crosses above the 20-day moving average. The market is closely watching for the next directional move. As of today (6th), the stock is trading at HKD 637.5, up 2.08%. Technical Chart Analysis Tencent's stock price has recently formed a triple-bottom breakout pattern, which is typically viewed as a potential signal of strengthening trends. The stock is currently fluctuating around the HKD 620 level, which holds dual technical significance as it aligns with the 100-day moving average and the golden retracement level of the previous upward wave, increasing the importance of this price level. From the perspective of the moving average system, the 10-day moving average (HKD 608.15) has successfully crossed above the 20-day moving average, forming a short-term 'Golden Cross.' This technical phenomenon is often interpreted as a sign of increased short-term momentum, providing some degree of technical support for the stock price. Meanwhile, various technical indicators show divergence: the RSI is in the moderately strong region at 57, while the Williams %R and Stochastic Oscillator indicate an overbought condition, and the MACD indicator signals...](https://nnqimage.futunn.com/sns_client_feed/1162342/20260106/web-1767671630003-WpZElXKtWw.png/big?area=1&is_public=true&imageMogr2/ignore-error/1/format/webp)
Recent Performance Review of Warrant Products
Reviewing recent performances in the derivatives market, the products mentioned on December 31, 2025, showed different increases over the following two trading days. In terms of call warrants, Societe Generale Call Warrant (13005) gained 21%, while BOC Call Warrant (13245) increased by 17%, corresponding to a 4.26% rise in the underlying stock during the same period. Bull contracts performed even more dramatically, with HSBC Bull Contract (67294) surging 83% and J.P. Morgan Bull Contract (66101) rising 82%. These figures clearly illustrate the leverage effect that structured products can offer when the market direction is correctly anticipated. The performance differences also reflect how various product structures react differently under the same market conditions, offering investors diverse options.
![$TENCENT (00700.HK)$ Divergent views on Tencent: Optimists target 700, while cautious investors focus on overbought correction risks [Share Link: January 5th [HK Stocks Podcast] Hang Seng Index, Kuaishou, Wuxi Apptec, AIA, Xiaomi Group, Tencent] Tencent (00700) closed at HKD 624.5 yesterday (5th), up 0.24% for the day, successfully holding above the HKD 620 level. The stock price has recently formed a triple-bottom breakout pattern, accompanied by a technical signal where the 10-day moving average crosses above the 20-day moving average. The market is closely watching for the next directional move. As of today (6th), the stock is trading at HKD 637.5, up 2.08%. Technical Chart Analysis Tencent's stock price has recently formed a triple-bottom breakout pattern, which is typically viewed as a potential signal of strengthening trends. The stock is currently fluctuating around the HKD 620 level, which holds dual technical significance as it aligns with the 100-day moving average and the golden retracement level of the previous upward wave, increasing the importance of this price level. From the perspective of the moving average system, the 10-day moving average (HKD 608.15) has successfully crossed above the 20-day moving average, forming a short-term 'Golden Cross.' This technical phenomenon is often interpreted as a sign of increased short-term momentum, providing some degree of technical support for the stock price. Meanwhile, various technical indicators show divergence: the RSI is in the moderately strong region at 57, while the Williams %R and Stochastic Oscillator indicate an overbought condition, and the MACD indicator signals...](https://nnqimage.futunn.com/sns_client_feed/1162342/20260106/web-1767671644549-jjR4FfJ4Tb.png/big?area=1&is_public=true&imageMogr2/ignore-error/1/format/webp)
Current Recommendations for Structured Products
Based on Tencent's consolidation between HKD 620-625, investors with differing market expectations may consider corresponding structured products. For those optimistic about future prospects, call warrants with higher exercise prices and relatively lower premiums can be considered, such as BOC Call Warrant (23617) $BITENCT@EC2606D.C (23617.HK)$ , which has an exercise price of HKD 729.38 and offers actual leverage of approximately 10.2 times; UBS Group Call Warrant (23638) provides similar terms but with slightly lower leverage. For those looking to participate via bull contracts, UBS Group Bull Contract (63637) $UB#TENCTRC2606F.C (63637.HK)$ has a stop-loss level set at HKD 597, with actual leverage of about 18.9 times, making it one of the lowest-premium choices currently available in the market.
For cautious investors, consider BNP Paribas put warrant (20713)$BPTENCT@EP2603B.P (20713.HK)$, with a strike price of 531 dollars and an actual leverage of approximately 19.5 times, offering the lowest implied volatility among similar products; Bank of China put warrant (20518)$BITENCT@EP2603B.P (20518.HK)$provides a strike price of 534.5 dollars and an actual leverage of 13.4 times. For risk hedging, Societe Generale bear contract (54881) and UBS Group bear contract (55636)$UB#TENCTRP2810D.P (55636.HK)$offer various choices in recovery prices and leverage levels, suitable for investors with different risk preferences to hedge their positions.
![$TENCENT (00700.HK)$ Divergent views on Tencent: Optimists target 700, while cautious investors focus on overbought correction risks [Share Link: January 5th [HK Stocks Podcast] Hang Seng Index, Kuaishou, Wuxi Apptec, AIA, Xiaomi Group, Tencent] Tencent (00700) closed at HKD 624.5 yesterday (5th), up 0.24% for the day, successfully holding above the HKD 620 level. The stock price has recently formed a triple-bottom breakout pattern, accompanied by a technical signal where the 10-day moving average crosses above the 20-day moving average. The market is closely watching for the next directional move. As of today (6th), the stock is trading at HKD 637.5, up 2.08%. Technical Chart Analysis Tencent's stock price has recently formed a triple-bottom breakout pattern, which is typically viewed as a potential signal of strengthening trends. The stock is currently fluctuating around the HKD 620 level, which holds dual technical significance as it aligns with the 100-day moving average and the golden retracement level of the previous upward wave, increasing the importance of this price level. From the perspective of the moving average system, the 10-day moving average (HKD 608.15) has successfully crossed above the 20-day moving average, forming a short-term 'Golden Cross.' This technical phenomenon is often interpreted as a sign of increased short-term momentum, providing some degree of technical support for the stock price. Meanwhile, various technical indicators show divergence: the RSI is in the moderately strong region at 57, while the Williams %R and Stochastic Oscillator indicate an overbought condition, and the MACD indicator signals...](https://nnqimage.futunn.com/sns_client_feed/1162342/20260106/web-1767671667205-qbkOb1HiaF.jpeg/big?area=1&is_public=true&imageMogr2/ignore-error/1/format/webp)
![$TENCENT (00700.HK)$ Divergent views on Tencent: Optimists target 700, while cautious investors focus on overbought correction risks [Share Link: January 5th [HK Stocks Podcast] Hang Seng Index, Kuaishou, Wuxi Apptec, AIA, Xiaomi Group, Tencent] Tencent (00700) closed at HKD 624.5 yesterday (5th), up 0.24% for the day, successfully holding above the HKD 620 level. The stock price has recently formed a triple-bottom breakout pattern, accompanied by a technical signal where the 10-day moving average crosses above the 20-day moving average. The market is closely watching for the next directional move. As of today (6th), the stock is trading at HKD 637.5, up 2.08%. Technical Chart Analysis Tencent's stock price has recently formed a triple-bottom breakout pattern, which is typically viewed as a potential signal of strengthening trends. The stock is currently fluctuating around the HKD 620 level, which holds dual technical significance as it aligns with the 100-day moving average and the golden retracement level of the previous upward wave, increasing the importance of this price level. From the perspective of the moving average system, the 10-day moving average (HKD 608.15) has successfully crossed above the 20-day moving average, forming a short-term 'Golden Cross.' This technical phenomenon is often interpreted as a sign of increased short-term momentum, providing some degree of technical support for the stock price. Meanwhile, various technical indicators show divergence: the RSI is in the moderately strong region at 57, while the Williams %R and Stochastic Oscillator indicate an overbought condition, and the MACD indicator signals...](https://nnqimage.futunn.com/sns_client_feed/1162342/20260106/web-1767671667207-SEJpVwsEcm.jpeg/big?area=1&is_public=true&imageMogr2/ignore-error/1/format/webp)
Interactive Discussion:Given the current technical patterns and market environment, which type of derivative product do you think is more suitable for addressing potential fluctuations in Tencent's stock price? How do you typically assess the implied volatility risk in CBBC products?For more professional analysis and practical strategies on Hong Kong stock CBBCs, stay tuned to #HongKongStockCBBCJenny's market insights.
#Tencent Technical Analysis# #Warrants Bull and Bear Certificate Strategy# #Hong Kong Stock Derivatives# #Implied Volatility Analysis# #Support and Resistance Levels# #Golden Cross Signal# #Triple Bottom Breakthrough# #Structured Product Comparison# #Short-term Trading Opportunities#
Disclaimer: This article does not constitute any investment advice.
This article is for reference only and does not constitute any investment advice. The market data, opinions, and analyses contained herein may change at any time without prior notice. We assume no responsibility for any loss or damage resulting from reliance on the information provided in this article. Technical analysis only indicates whether certain technical conditions are met. A comprehensive evaluation of asset performance should be conducted by integrating additional data. Trading decisions should not be made solely based on this article. Please note that past performance is not indicative of future results. $Hang Seng Index (800000.HK)$$Hang Seng TECH Index (800700.HK)$$Hang Seng China Enterprises Index (800100.HK)$
Risk Disclaimer: The above content only represents the author's view. It does not represent any position or investment advice of Futu. Futu makes no representation or warranty.Read more

Comments
to post a comment
2