
Kicking off the year with a bang! Multiple sectors in Hong Kong's stock market are quietly gaining m
January 6, 2026 HK stocks

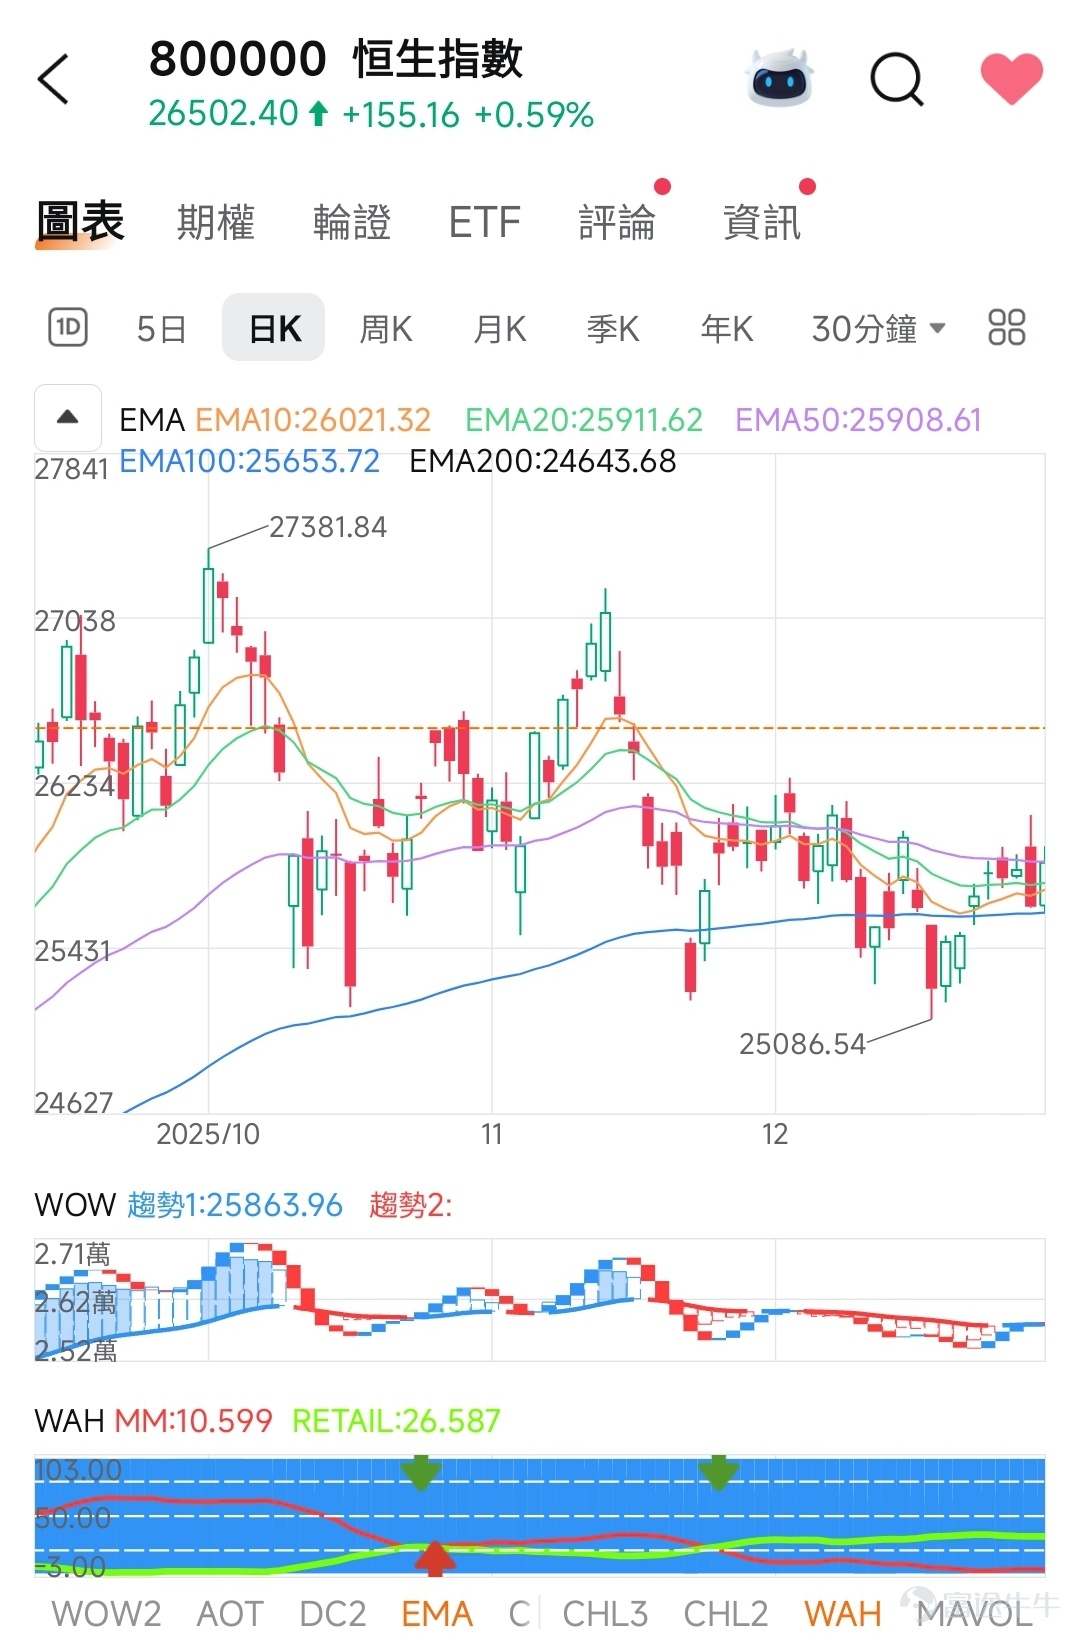
📈 Overall Trend Analysis
· The index is currently at 26,502.40, above all short-, medium-, and long-term EMA lines (EMA10, EMA20, EMA50, EMA100, EMA200), showing a bullish alignment that indicates an overall upward trend.
· The current index is near recent highs, breaking through the EMA200 (24,643.68) and continuing to rise, demonstrating a solid mid-to-long-term uptrend.
---
🔍 WOW (Momentum and Trend Analysis)
· WOW Trend 1: 25,863.96 (This can be considered a key support or momentum turning point in the near term).
· The current index price (26,502.40) is above this trend line, indicating momentum remains positive.
· If the index can stabilize above WOW Trend 1, short-term momentum is likely to continue. If it breaks below, consolidation or a pullback may occur.
---
📊 WAH (Volume/Price Range Analysis)
· WAH MM: 10.599 (May represent the low-end range for institutional or major capital participation).
· WAH RETAIL: 26.587 (May represent the price zone where retail investors participate or act as secondary resistance).
· The current index is far above WAH MM, indicating it has moved away from the lower range, but it is close to the WAH RETAIL zone. It is necessary to monitor whether this area forms psychological or actual resistance.
---
🧭 Future Direction Prediction
1. Short-term (5-day to 30-minute chart):
· If the index stabilizes above EMA10 (26,021.32) and remains higher than WOW Trend 1 (25,863.96), it may challenge the previous high of 27,381.84.
$CSOP Hang Seng TECH Index Daily (2x) Leveraged Product (07226.HK)$$CSOP HANG SENG INDEX DAILY (2X)LEVERAGED PRODUCT (07200.HK)$
· In case of a pullback, first look at the combined support from EMA20 (25,911.62) and EMA50 (25,908.61).
Note that $CSOP HANG SENG INDEX DAILY (-2X) INVERSE PRODUCT (07500.HK)$$CSOP Hang Seng TECH Index Daily (-2x) Inverse Product (07552.HK)$
2. Medium-term (weekly K-line to monthly K-line):
· The bullish alignment remains intact; EMA100 (25,653.72) and EMA200 (24,643.68) serve as strong long-term support levels.
· If the index breaks through 27,381.84, the next target could be 27,841 (the recent high shown on the chart).
3. Risk Warning:
· If the index falls below WOW Trend 1 and fails to recover quickly, momentum may weaken.
· If WAH RETAIL (26,587) forms resistance, short-term fluctuations may occur.
Note that
---
✅ Summary Recommendation
· The trend is upward with a bias towards bullishness, but the index is approaching the previous high; watch for potential profit-taking.
· Key supports: WOW Trend 1 (25,863.96), EMA10 (26,021.32)
· Key resistance: previous high 27,381.84, 27,841
· Strategy: Positions can be held or added on pullbacks; if EMA10 is breached and WOW weakens, it’s advisable to stay on the sidelines.
Risk Disclaimer: The above content only represents the author's view. It does not represent any position or investment advice of Futu. Futu makes no representation or warranty.Read more

Comments
to post a comment
4