Technical Analysis of Chinese Stocks (January 1): Alibaba/Baidu/Bilibili/Futu/PDD Holdings/Tencent Music/NetEase/JD.com/Tencent/Meituan/Kuaishou/Xiaomi
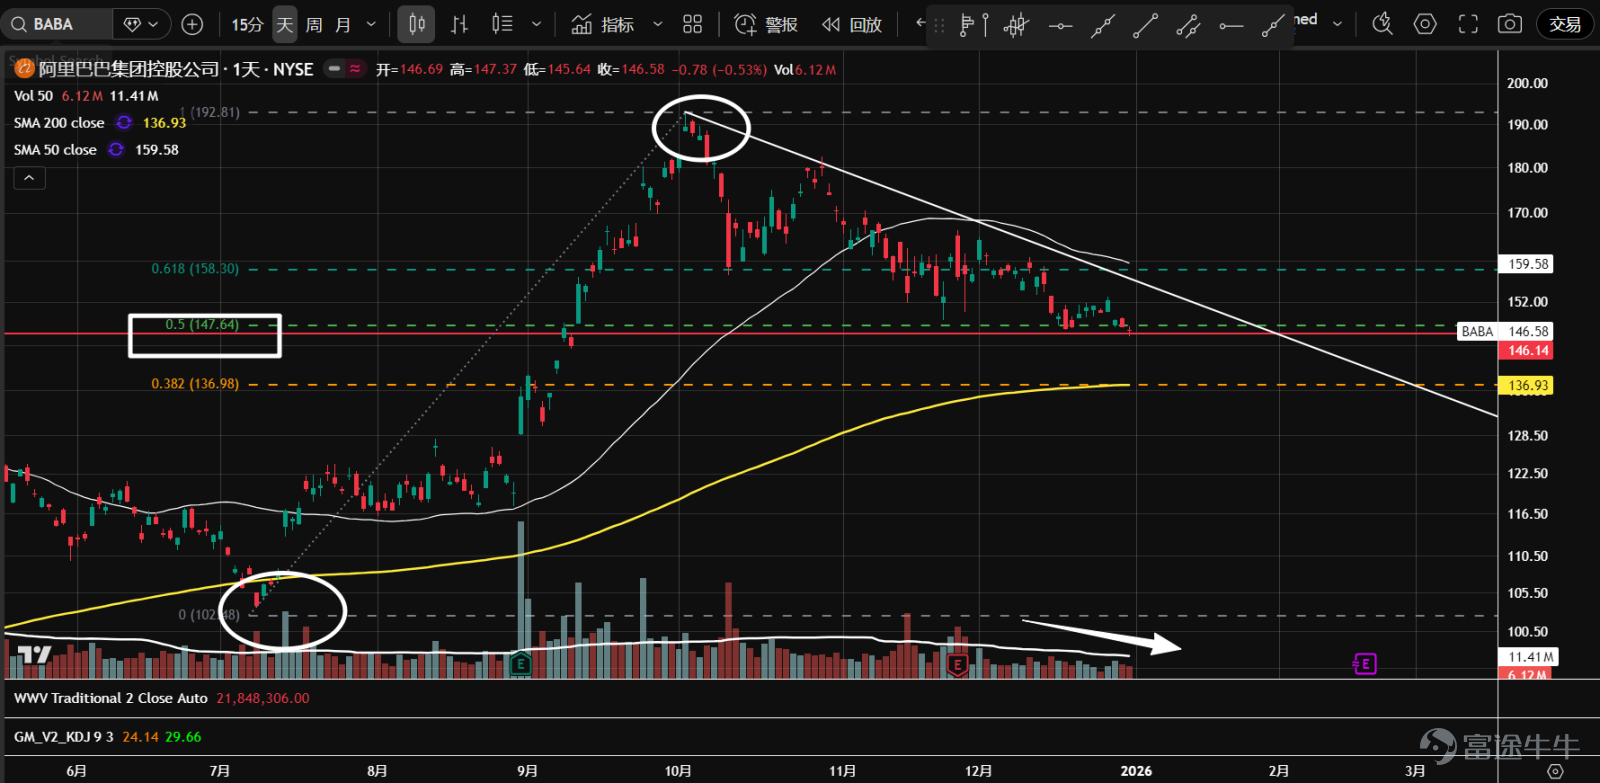
1、 $Alibaba (BABA.US)$ The stock is undergoing a triangle consolidation and has found support at the 50% retracement level of the previous trend. Currently, the price is experiencing narrow-range fluctuations with diminishing volume near the apex, showing no clear signs of a breakout due to insufficient demand, which suggests a potential downward breakout.

2、 $Baidu (BIDU.US)$ Since October, the stock has been trapped in a range-bound movement and is currently facing resistance around the gap at 132. The price failed to break through despite higher trading volumes, resulting in an upper shadow before retreating. If it falls back into the value area, the sideways movement may continue.

3、 $Bilibili (BILI.US)$ The stock has again approached support near the 24.35 axis, which also corresponds to the upper boundary of the value area (VAH) from July to September. Compared to the first decline toward this level in November, trading volumes have significantly contracted, suggesting that the market may stabilize gradually going forward.

4、 $Futu Holdings Ltd (FUTU.US)$ Since August, the stock has entered a sideways consolidation phase, forming a P-shaped volume distribution, with increased divergence between buyers and sellers at higher levels. Currently, the stock price is near the volume control point (orange line), showing no clear direction; overall trading volume is gradually declining, indicating a high possibility of accumulation.

5、 $PDD Holdings (PDD.US)$ Since entering a large consolidation range in 2024, there was a significant false breakout at the pivotal level of 109.45 in mid-to-late December. Yesterday, the support was retested, closing with a long lower shadow, and trading volume dropped significantly. The second test may have been successful, with a high likelihood of the stock price stabilizing.

6、 $Tencent Music (TME.US)$ Following panic selling in November, there has been no substantial volume-driven rebound, with the stock price remaining sluggish and no significant demand entering. The outlook suggests continued volatile declines, potentially testing the 38.2% retracement level of the previous upward wave.

7、 $NetEase (NTES.US)$ During the range-bound trading, after panic selling occurred in November, the low-volume secondary test may have been completed. Currently, the stock price is at the volume control point (orange line), with an unclear direction. Overall trading volume is declining, while the bottom is gradually rising, possibly indicating accumulation.

8、 $JD.com (JD.US)$ After breaking below the critical support around 30 with high volume in November, the subsequent low-volume rebound test failed, leading to further declines. The current bearish price-volume cycle confirms the valid breakdown, and the stock may continue to explore lower levels.

9、 $TENCENT (00700.HK)$ Since starting range-bound consolidation in September, there have been several rebounds near the 600 support level since December, but the rebounds have been limited, failing to reach the range's volume control point (orange line) before retreating. With the stock unable to break away from support, there is a risk of shakeouts.

10、 $MEITUAN-W (03690.HK)$ Since beginning a sideways trend in September, trading volume has formed a b-shaped distribution, with increased divergence between buyers and sellers at lower levels. Overall trading volume has been gradually declining, suggesting a high likelihood of accumulation. Currently, the stock price is near the volume control point (orange line); observation is recommended.

11、 $KUAISHOU-W (01024.HK)$ The stock found support several times at the 38.2% retracement level of the previous upward wave, with numerous long lower shadows appearing near this level last week. This week’s test of the support saw a sharp drop in volume and the formation of a doji, indicating a potential rebound.

12、 $XIAOMI-W (01810.HK)$ Since initiating a downward trend in September, panic selling emerged at the pivotal level of 36.9. After the natural rebound completed, a secondary test began. With overall trading volume declining, the stock price is likely to enter a sideways consolidation phase.

$S&P 500 Index (.SPX.US)$ $SPDR S&P 500 ETF (SPY.US)$ $NASDAQ 100 Index (.NDX.US)$ $Invesco QQQ Trust (QQQ.US)$ $Dow Jones Industrial Average (.DJI.US)$ $State Street® SPDR® Dow Jones Industrial Average® ETF Trust (DIA.US)$ $Russell 2000 Index (.RUT.US)$ $iShares Russell 2000 ETF (IWM.US)$ $Hang Seng Index (800000.HK)$ $Hang Seng TECH Index (800700.HK)$ $Hang Seng TECH Index ETF (03032.HK)$ $KraneShares CSI China Internet ETF (KWEB.US)$ $Direxion Daily FTSE China Bull 3X Shares ETF (YINN.US)$ $Direxion Daily FTSE China Bear 3X Shares ETF (YANG.US)$ $Invesco China Technology ETF (CQQQ.US)$
Risk Disclaimer: The above content only represents the author's view. It does not represent any position or investment advice of Futu. Futu makes no representation or warranty.Read more


Comments (3)
to post a comment
18
10