
[Earnings Summary] Robinhood reports strong earnings but sees a stock price decline. How should investors proceed?
![The popular brokerage firm $Robinhood (HOOD.US)$ released its latest Q3 earnings, with both revenue and net profit exceeding expectations. However, the stock price fell instead of rising, primarily due to recent factors such as the U.S. government shutdown, an unclear interest rate cut trajectory, and tariff issues, which have pushed the broader U.S. stock market into an adjustment phase. As the broader market's pessimistic outlook dissipates, $Robinhood (HOOD.US)$ can it regain upward momentum? How should investors respond? This week’s [Earnings Summary] will explore these questions with you. First, let’s look at the core results: Q3 revenue was $1.274 billion, surpassing the expected $1.206 billion; adjusted EPS was $0.55, also exceeding the forecast of $0.52. The three core business segments—"trading revenue," "interest income," and "other income"—all performed exceptionally well, signaling several positive indicators. The following analysis will provide a detailed breakdown. Firstly, $Robinhood (HOOD.US)$ total revenue surged 100% year-on-year, setting a new historical record. This impressive growth was primarily driven by the robust performance of the two core revenue engines—trading revenue and interest income—which contributed 57% and 36% of total revenue, respectively. As of Q3, the company had 26.8 million users with funds, representing a year-on-year increase of 2.5 million; among them, there were 3.88 million Gold membership users, up by 1.7 million year-on-year; total assets on the platform reached 333 billion yuan, increasing by 119% year-on-year, driven by net deposit inflows...](https://nnqimage.futunn.com/sns_client_feed/900080/20251110/web-1762767949466-CR6h8IXEBi.png?area=1&is_public=true&imageMogr2/ignore-error/1/format/webp)
The popular brokerage firm $Robinhood (HOOD.US)$ released its latest Q3 earnings, with both revenue and net profit exceeding expectations. However, the stock price fell instead of rising, primarily due to recent factors such as the U.S. government shutdown, an unclear interest rate cut trajectory, and tariff issues, which have pushed the broader U.S. stock market into an adjustment phase.
As the broader market's pessimistic outlook dissipates, $Robinhood (HOOD.US)$ can it regain upward momentum? How should investors respond? This week’s [Earnings Summary] will explore these questions with you.
Data source: Wind
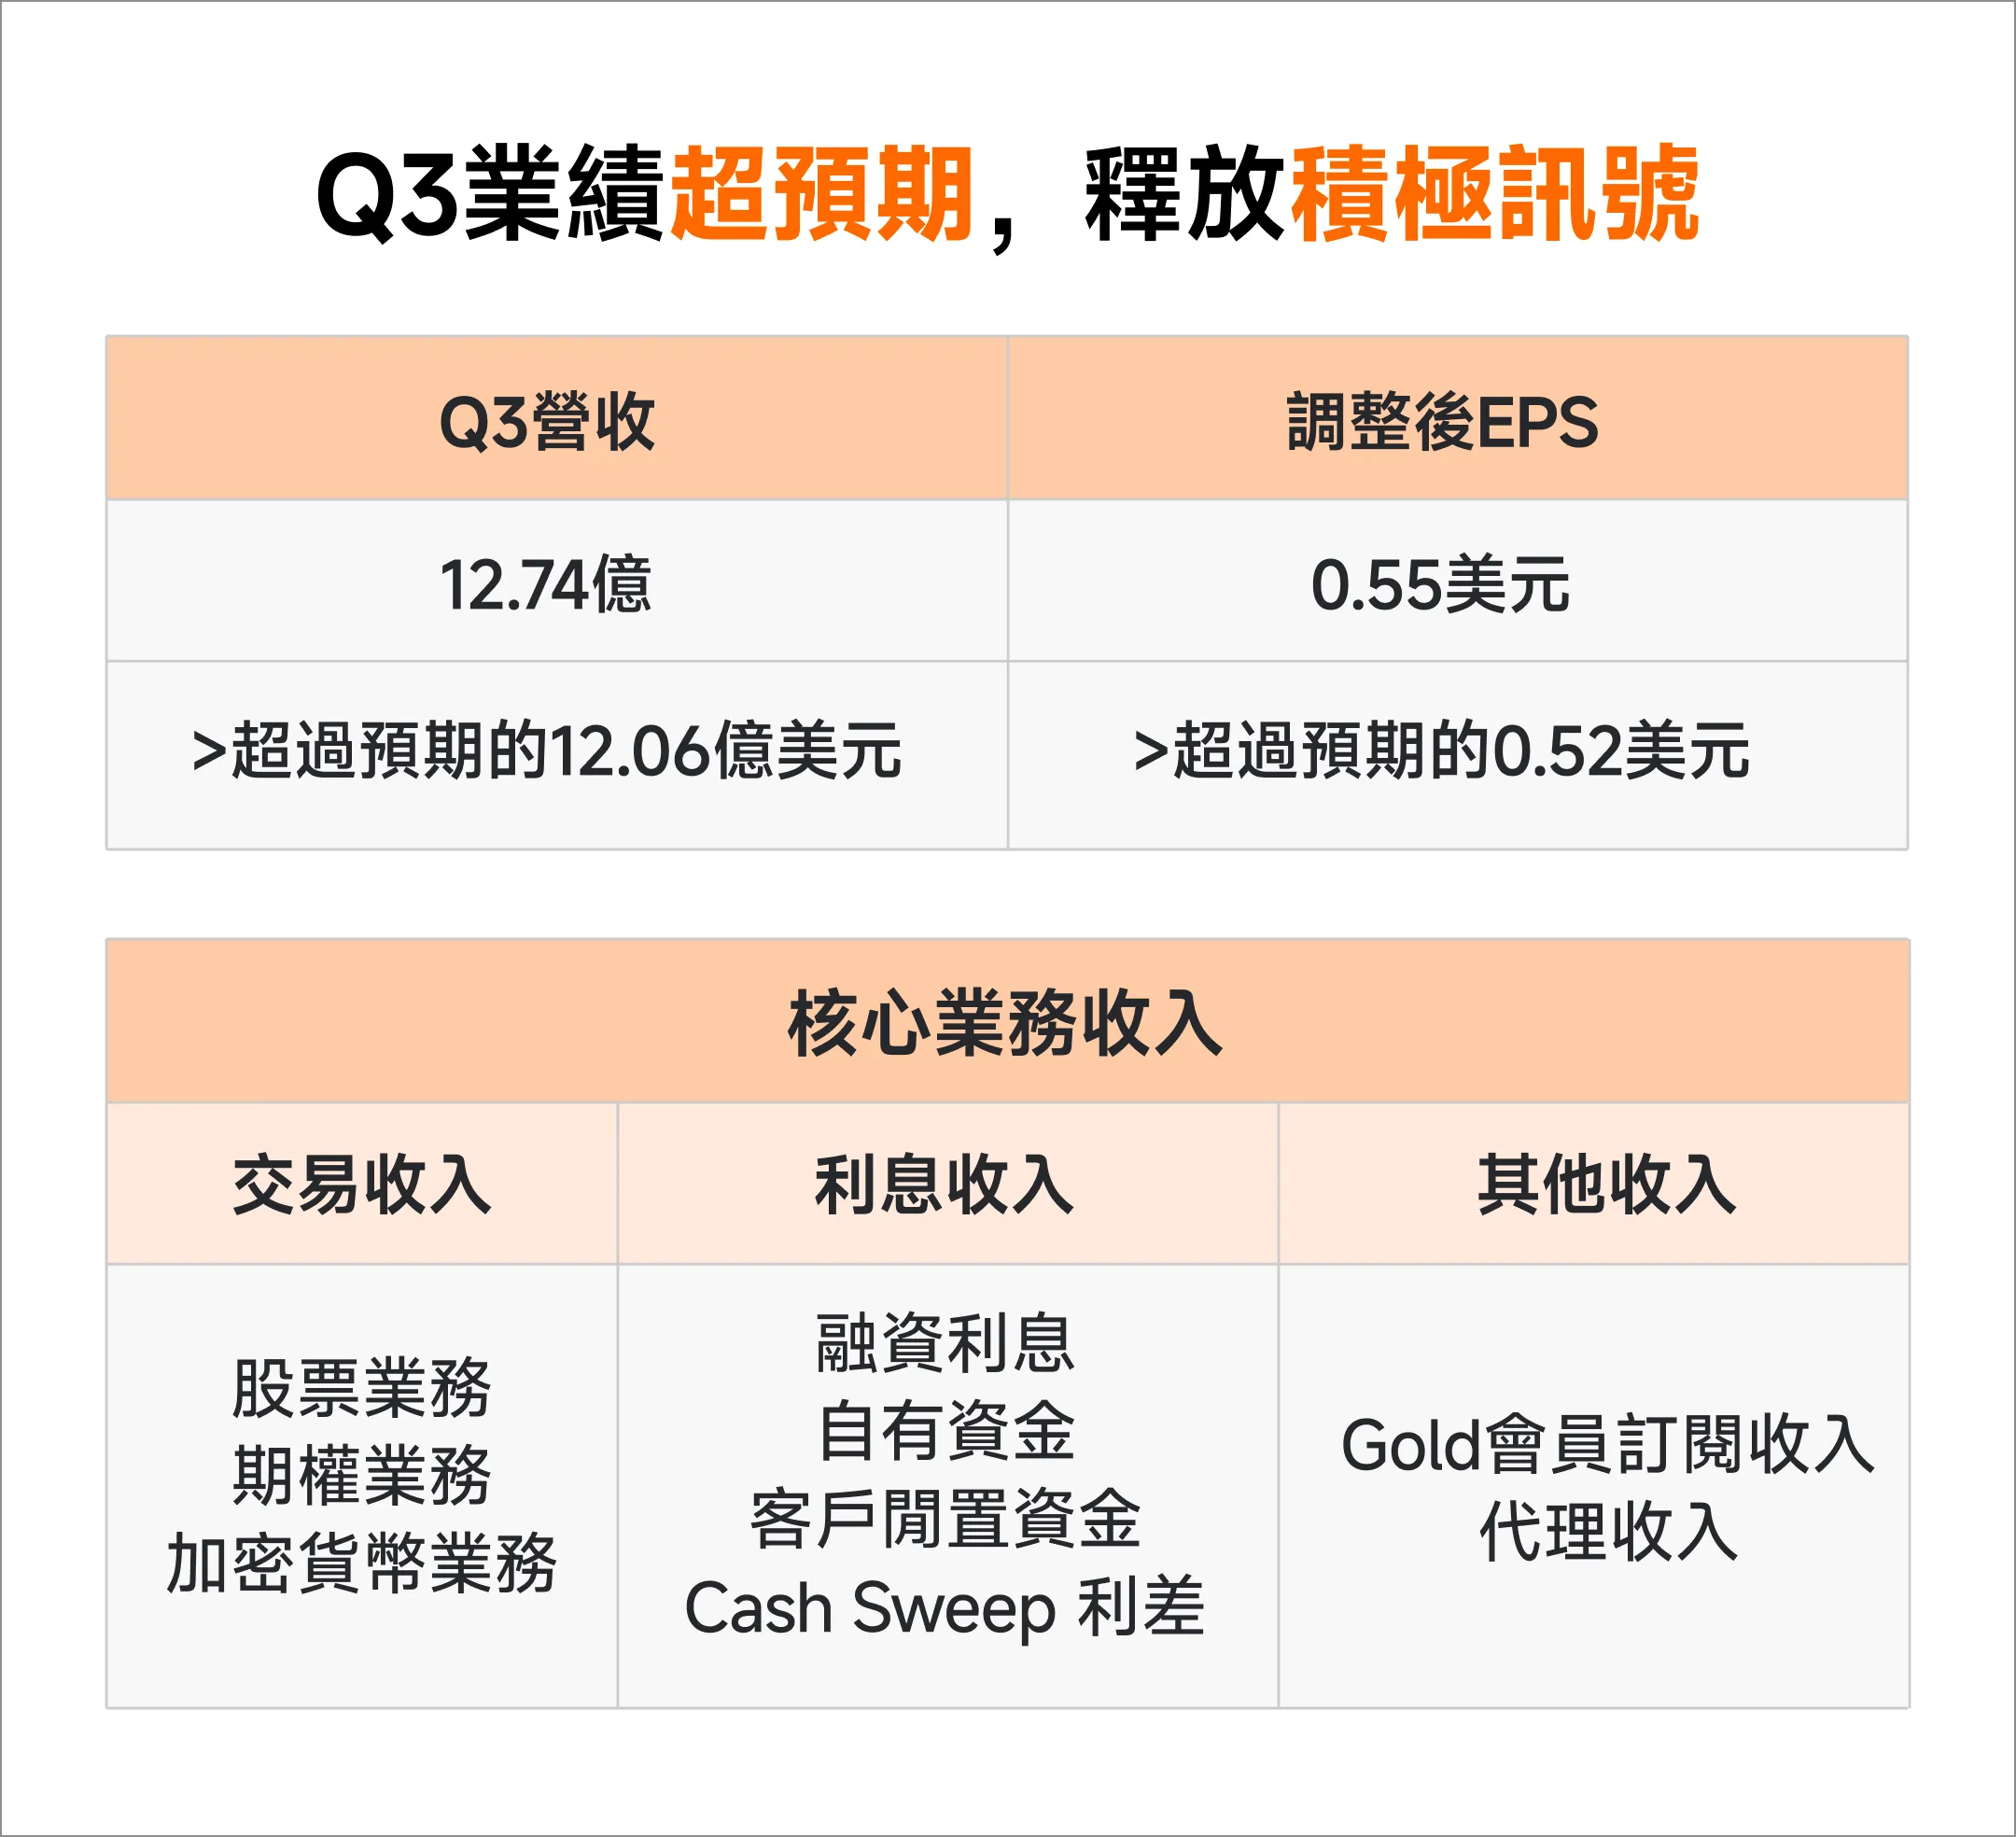
First, let’s look at the core results: Q3 revenue was $1.274 billion, surpassing the expected $1.206 billion; adjusted EPS was $0.55, also exceeding the forecast of $0.52.
The three core business segments—"trading revenue," "interest income," and "other income"—all performed exceptionally well, signaling several positive indicators. The following analysis will provide a detailed breakdown.

Data source: Wind
Firstly, $Robinhood (HOOD.US)$ total revenue surged 100% year-on-year, setting a new historical record. This impressive growth was primarily driven by the robust performance of the two core revenue engines—trading revenue and interest income—which contributed 57% and 36% of total revenue, respectively.
As of Q3, the company had 26.8 million funded users, an increase of 2.5 million from the previous year; among them, 3.88 million were Gold members, up by 1.7 million year-over-year. The platform’s total assets amounted to $333 billion, representing a 119% year-over-year growth, driven by net deposit inflows, acquired assets, and appreciation in stock and cryptocurrency valuations.
The impressive core metrics also demonstrate that Robinhood's revenue sources have become more diversified, moving beyond being solely reliant on trading activities.
Data source: Wind
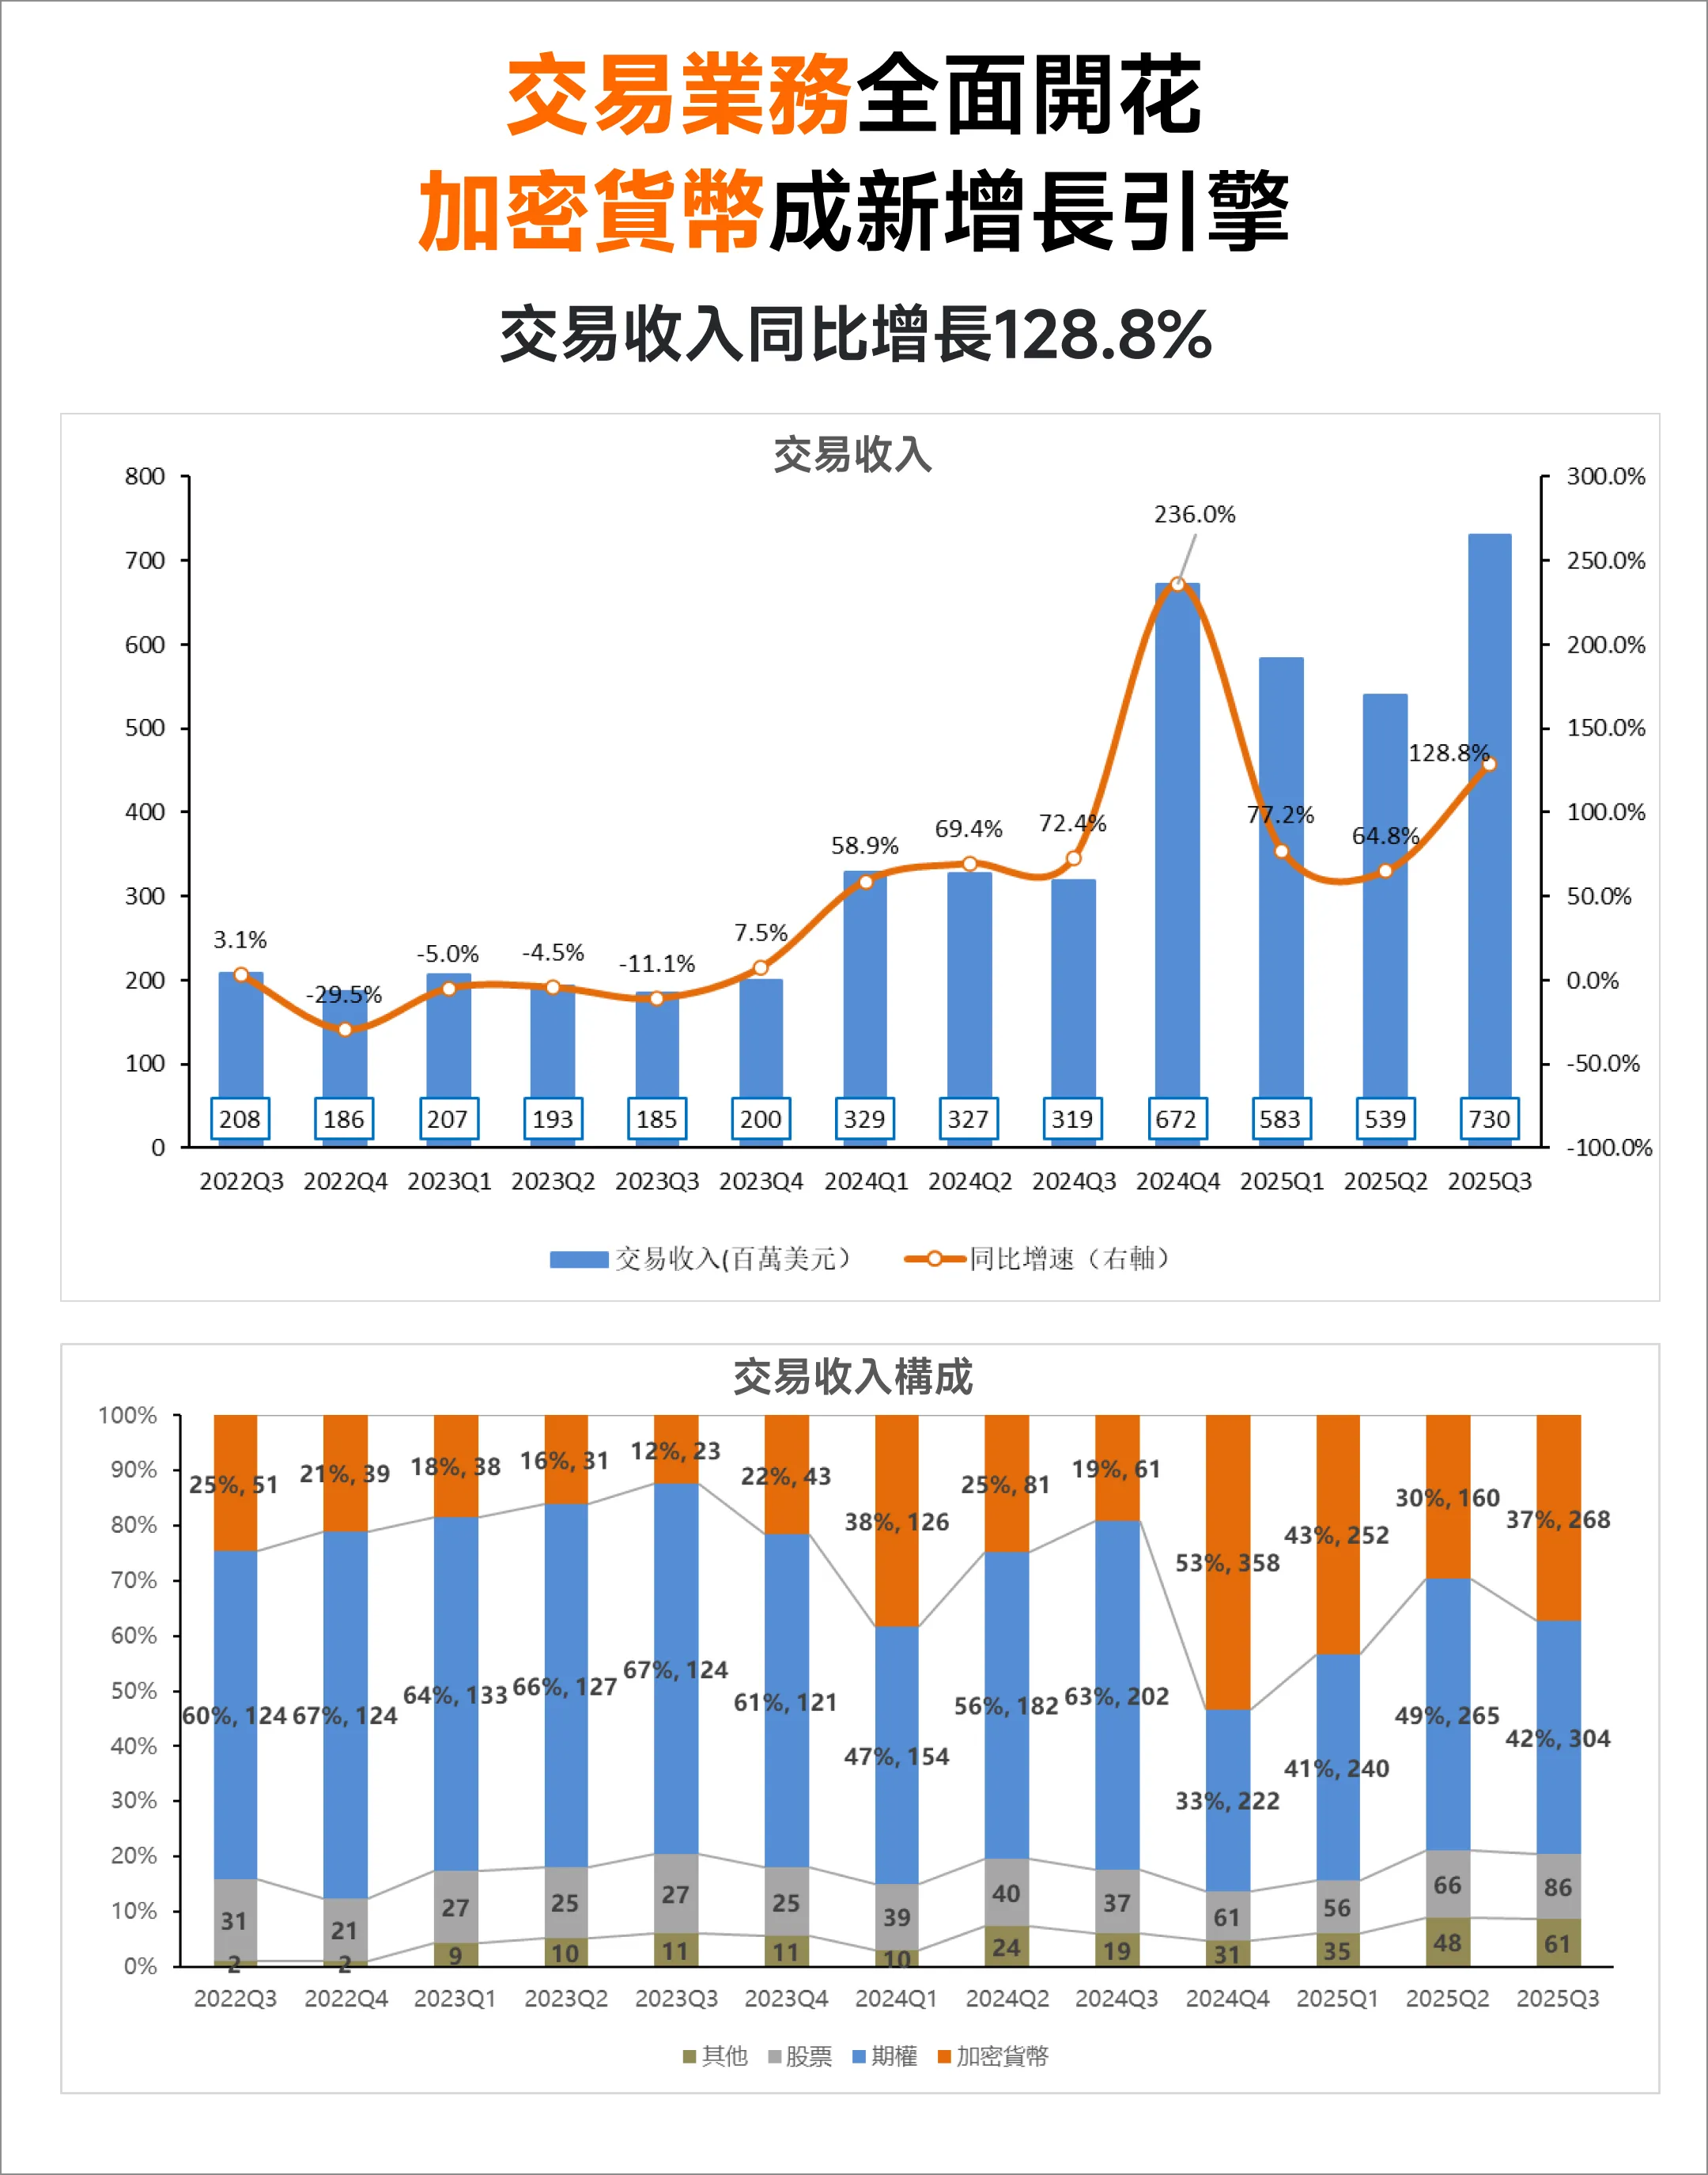
Breaking it down further, the key revenue pillar"trading business"performed exceptionally across all areas, contributing $730 million in revenue, marking a 128.8% year-over-year increase. Corresponding revenues from options, cryptocurrencies, equities, and other businesses all achieved robust growth.
CryptocurrencyThis quarter achieved revenue of $228 million, a year-over-year increase of over 300%, contributing 37% of the trading business revenue and becoming the latest growth engine driving trading income.
The key factors behind the explosive growth of the crypto business include the overall recovery of the crypto market, which has driven increased activity among both retail and institutional investors, as well as the company's proactive expansion of its crypto business this year: not only acquiring the crypto exchange Bitstamp but also forming a partnership with the prediction market platform Kalshi, significantly boosting business development.
The integration of Bitstamp significantly increased trading volume, with Robinhood’s platform trading exceeding $32 billion in October, of which Bitstamp contributed $18 billion. Additionally, the launch of the prediction market business attracted a large number of new users, with Q3 prediction contract trading volume doubling from the previous quarter to 2.3 billion contracts, making it the third most active trading category after stocks and options.
Options BusinessAs the most stable pillar of trading revenue, the options business has consistently performed well. In Q3, the options business generated $304 million, a year-over-year increase of 50%, contributing 42% of the trading business revenue. Revenue per options contract was $0.50 in Q3, remaining largely stable compared to $0.51 in Q2.
Stock Business:Q3 stock business revenue reached $86 million, representing a year-over-year increase of 132% and showing a slight improvement from the previous quarter. As the equity business operates on a PFOF (Payment for Order Flow) model, it accounts for only a small portion of overall trading revenue, thus having minimal impact on the company’s overall performance. However, equity trading remains the most fundamental and common demand in financial investment and serves as a core foundation for attracting and retaining users.
Data source: Wind
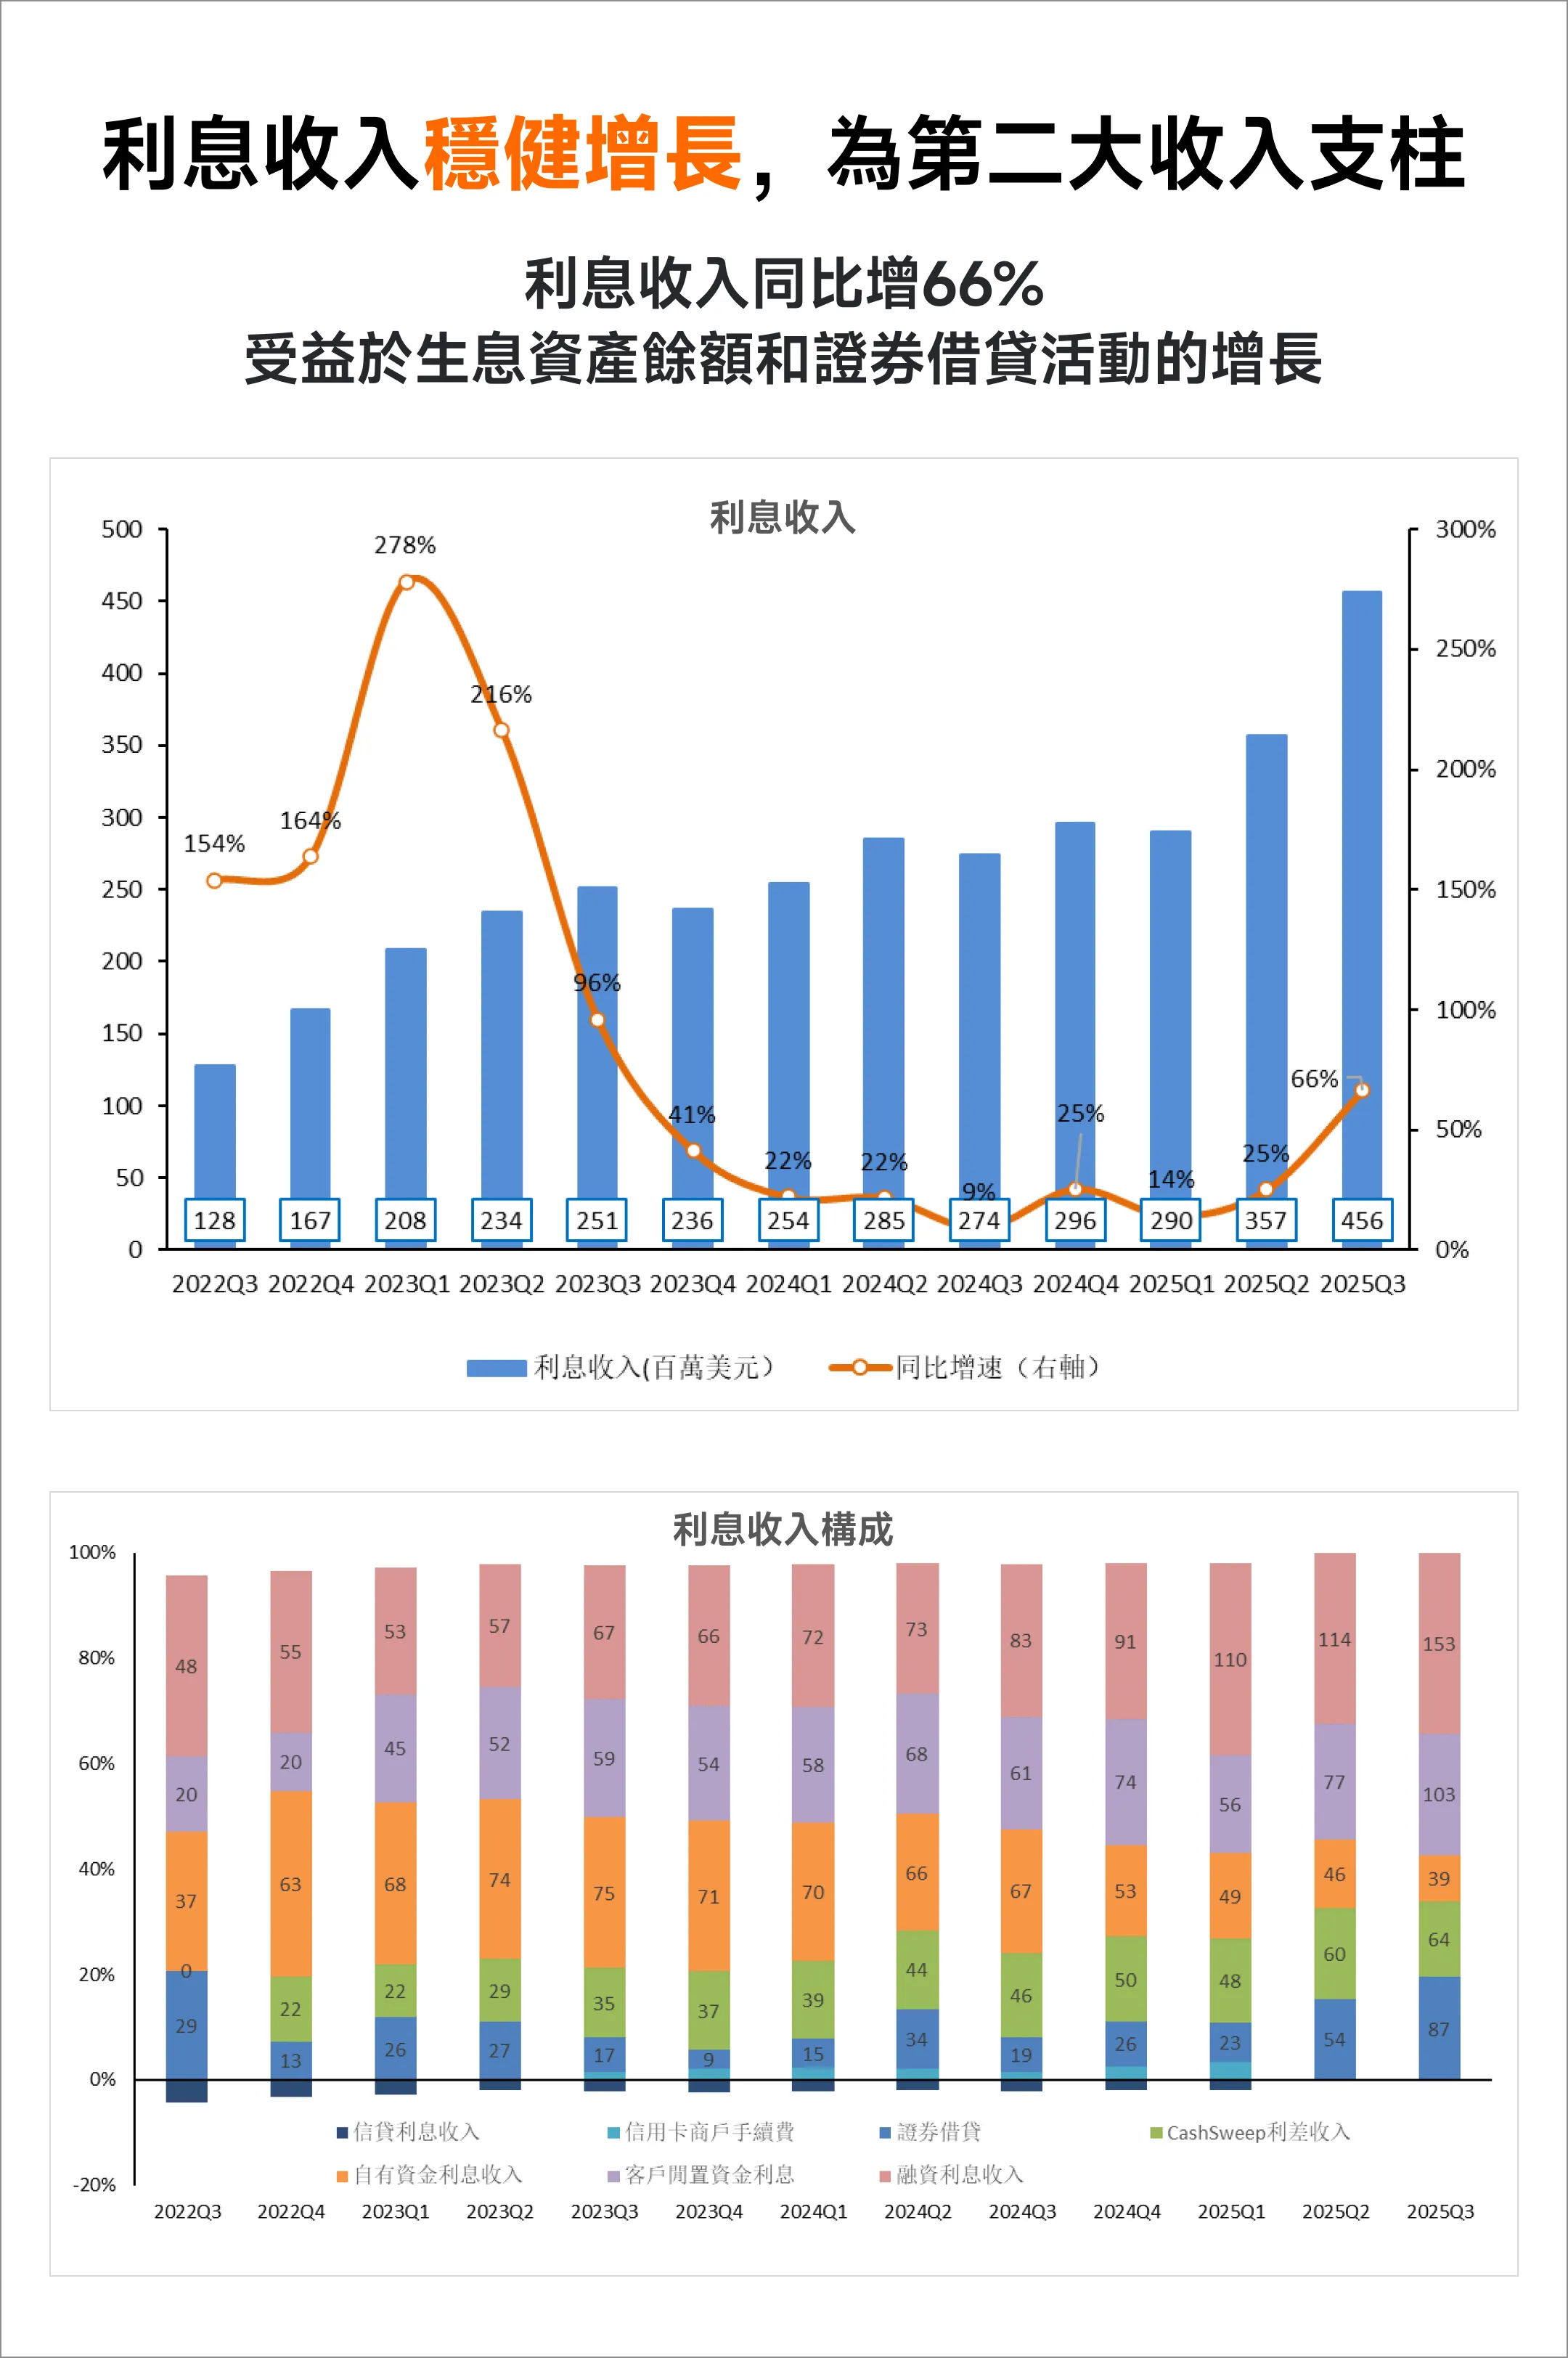
As the second-largest pillar of the company’s revenueInterest-related business, also demonstrated robust growth this quarter, with revenue reaching $456 million, a year-over-year increase of 66%, primarily driven by the expansion in interest-earning assets and securities lending activities.
Among these, margin financing interest income represented the largest contributor to interest-based revenues, achieving $153 million in Q3. The strong performance of the U.S. stock market during Q3 spurred investor demand for leveraged trading, leading to sustained inflows of user funds, which in turn expanded the scale of interest-earning assets and drove margin financing income growth.
Additionally, as both institutional and retail investors increased their demand for margin trading, securities lending reached record highs, becoming a significant incremental source of interest income, contributing $87 million in revenue this quarter. Beyond earning spreads, securities lending enhances the efficiency of user fund utilization, creating a virtuous cycle.
In summary, the institutional upgrading of trading revenues indicates that Robinhood has reduced its reliance on a single asset category, ensuring stronger stability in future earnings growth. Even if trading activity in one asset class declines, other segments can compensate for the shortfall.
The high growth in interest income marks Robinhood's transformation from a 'trading platform' to an 'asset management platform.' Compared to volatile trading revenues, interest income is more stable. As Robinhood fully launches its banking services, including savings accounts and loan products, the scale of interest-earning assets will further expand, making interest income a more reliable foundation for financial performance.

Data source: Wind
From a profitability perspective,Robinhood’s profitability has achieved a qualitative leap: net profit surged from $150 million in the same period last year to $556 million, representing a 271% increase, with a net profit margin reaching 44%.
This profit growth stems from increases in both the number of platform users and per-user value. Currently, the platform has 13.8 million monthly active users, with an average revenue per user (ARPU) of $191. The simultaneous improvement in these two key metrics has driven overall revenue growth. Coupled with effective cost control measures, the company’s profitability has continued to strengthen.
In addition, Robinhood revealed during this earnings call that the company plans to build a "family financial hub," including advancing its banking services under Robinhood Banking, investment operations via Robinhood Ventures, tokenized stocks, and predictive analytics, among others. These business lines are currently progressing smoothly and are expected to translate into tangible revenue for the company in the future, making them worthy of close attention from investors.

Data source: Futubull
From a technical perspective, considering the EMA12 and 50-day moving averages, Robinhood is currently in an upward trend. Although the stock price retreated below the EMA50 after the earnings release, the EMA12 has not yet crossed below the EMA50, indicating that the stock has not clearly entered a reversal trend.
With positive developments regarding the U.S. government's behind-closed-doors negotiations, the broader market is expected to stabilize. Coupled with Robinhood’s strong Q3 performance, the stock price may rebound from its recent decline. The current key support level can be referenced at the EMA50.
Of course, no technical indicator is infallible. The technical analysis provided here is for educational purposes only and should not be considered direct investment advice.
For more risk-tolerant fellow investors, options strategies can be promptly employed to hedge trades in volatile markets. For detailed operational guidance, investors may refer to this educational article >>Robinhood's High Volatility: Three Option Strategies to Address the Dilemma of 'Reluctant to Sell but Fearful of Decline'
Risk Disclosure: This content does not constitute a research report and is provided for reference only. It should not be relied upon as a basis for any investment decision. The information contained herein does not represent a comprehensive description of the securities, markets, or developments discussed. While the sources of information are deemed reliable, no guarantee is made regarding the accuracy or completeness of the content provided. Furthermore, no assurance is given concerning the accuracy of any statements, opinions, or forecasts presented in this document.
This content discusses technical analysis. Other methods, including fundamental analysis, may provide different perspectives. The examples provided are for illustrative purposes only and do not reflect expected outcomes.
Risk Disclaimer: The above content only represents the author's view. It does not represent any position or investment advice of Futu. Futu makes no representation or warranty.Read more


Comments (170)
to post a comment
218
36