
Tencent's Q3 results far exceeded expectations! Continue to hold firmly?
Tencent Key Level Analysis: Is a Breakout in the 602 to 656 Range Imminent?
Tencent's share price stood at HKD 645.5, up 1.81%. Notably, Tencent’s volatility over the past five days reached 5.1%, providing short-term traders with numerous trading opportunities due to this level of fluctuation.
Let us first examine the key technical levels. Currently, Tencent’s short-term support is located at HKD 617, with stronger support at the HKD 602 level. On the upside, resistance is initially found at HKD 656, which must be broken and held for the next target at HKD 673 to come into focus. From a moving average analysis perspective, the share price is currently slightly below the 10-day moving average (approximately HKD 638.3), but it remains between the 30-day moving average (approximately HKD 643.6) and the 60-day moving average (approximately HKD 628.6), indicating that the medium-term trend remains unclear.
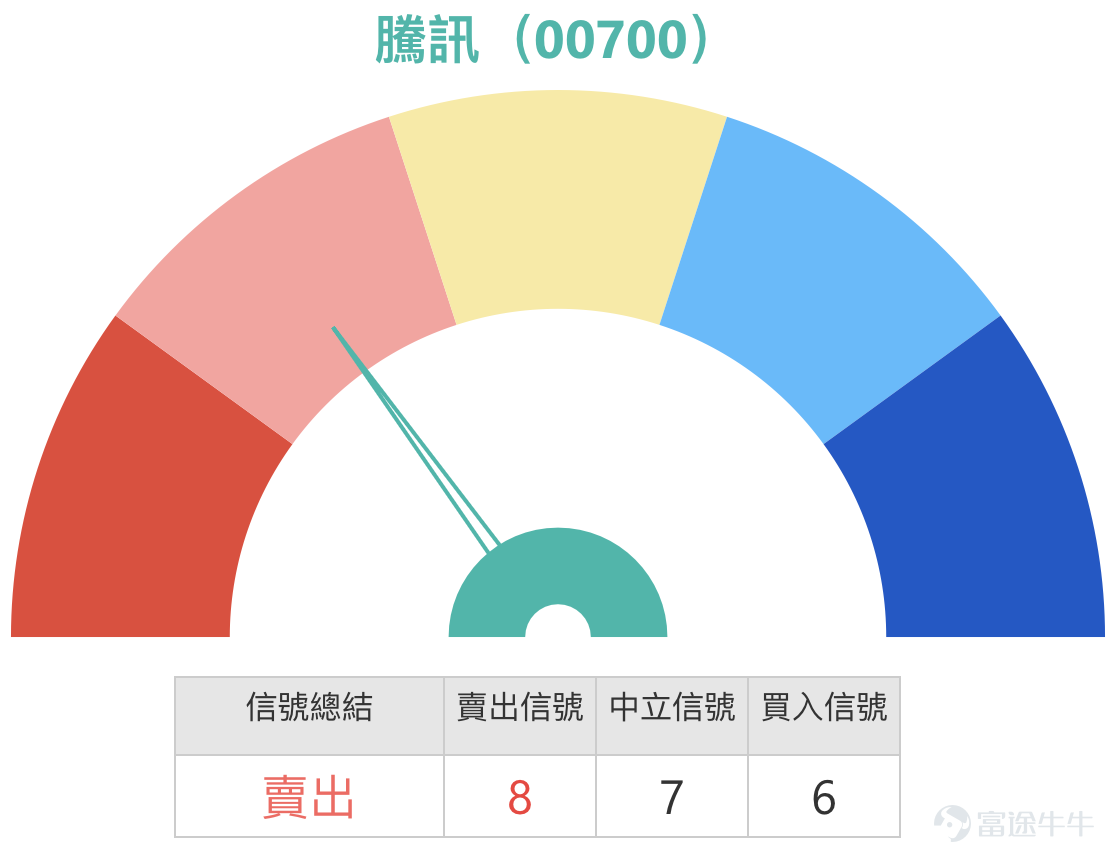
Technical indicators present conflicting signals. The RSI indicator is at the neutral level of 50, reflecting a relative balance between bullish and bearish forces. However, multiple oscillation indicators such as the Williams %R and the Stochastic Oscillator are issuing sell signals, and the MACD indicator also shows weakness. Nevertheless, the Bollinger Bands indicate that the stock price is in a relatively neutral zone. This divergence in technical indicators explains why the stock price has been oscillating within a range recently.

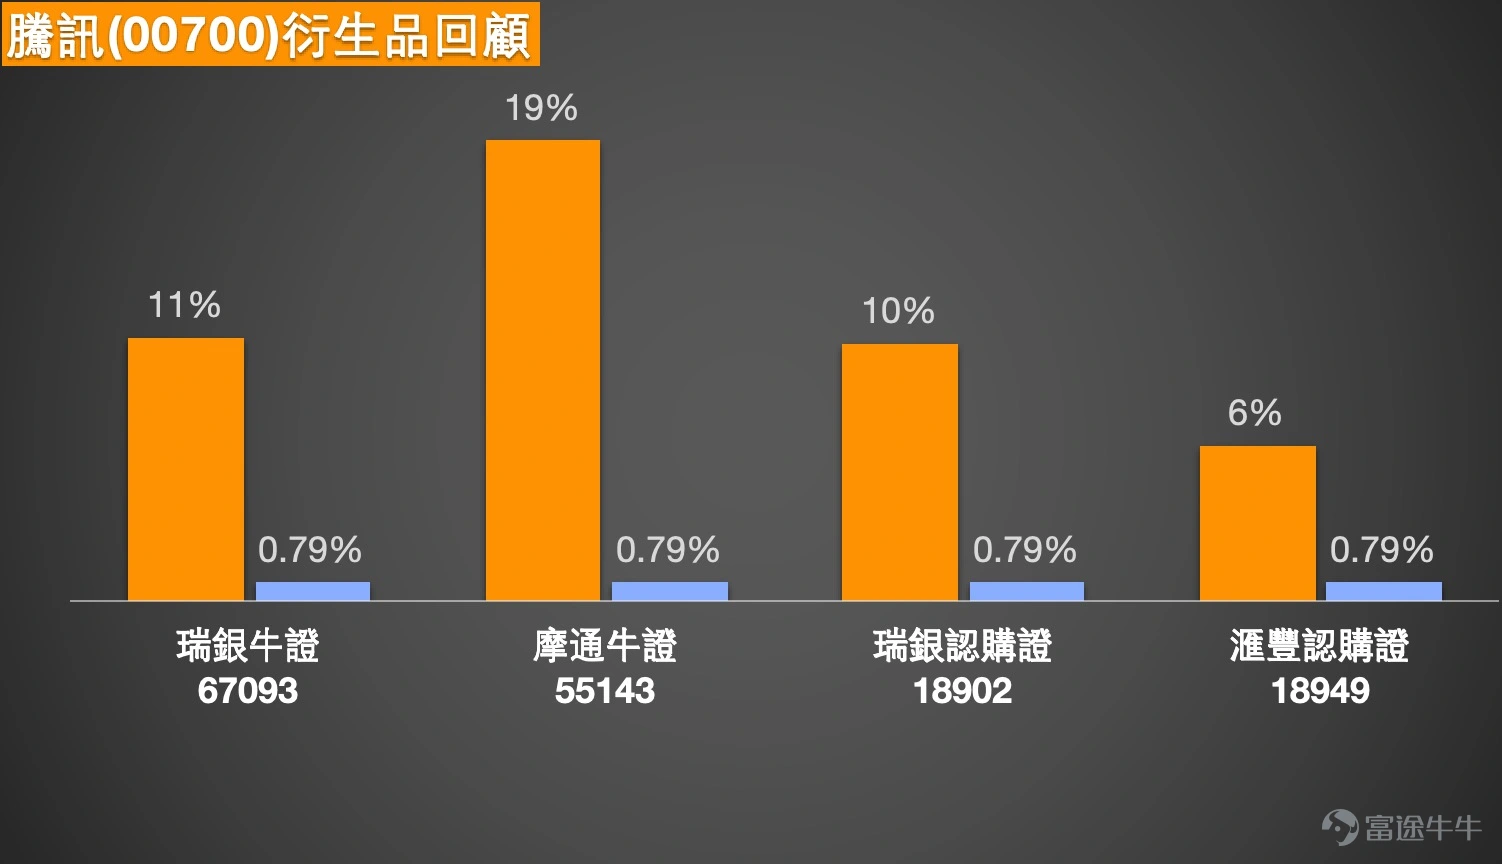
According to the data, the performance of the warrants and bull/bear certificates mentioned on November 5, 2025, over the following two days was as follows: HSBC call warrant (18949) recorded a 6% increase, while the underlying stock price rose by 0.79% during the same period; J.P. Morgan bull certificate (55143) performed particularly well, with a 19% increase after two days, while the change in the underlying stock remained at 0.79%; UBS Group bull certificate (67093) also saw an 11% rise, with the underlying stock change staying at 0.79%; additionally, UBS Group call warrant (18902) rose by 10% after two days, with the underlying stock price also increasing by 0.79%.
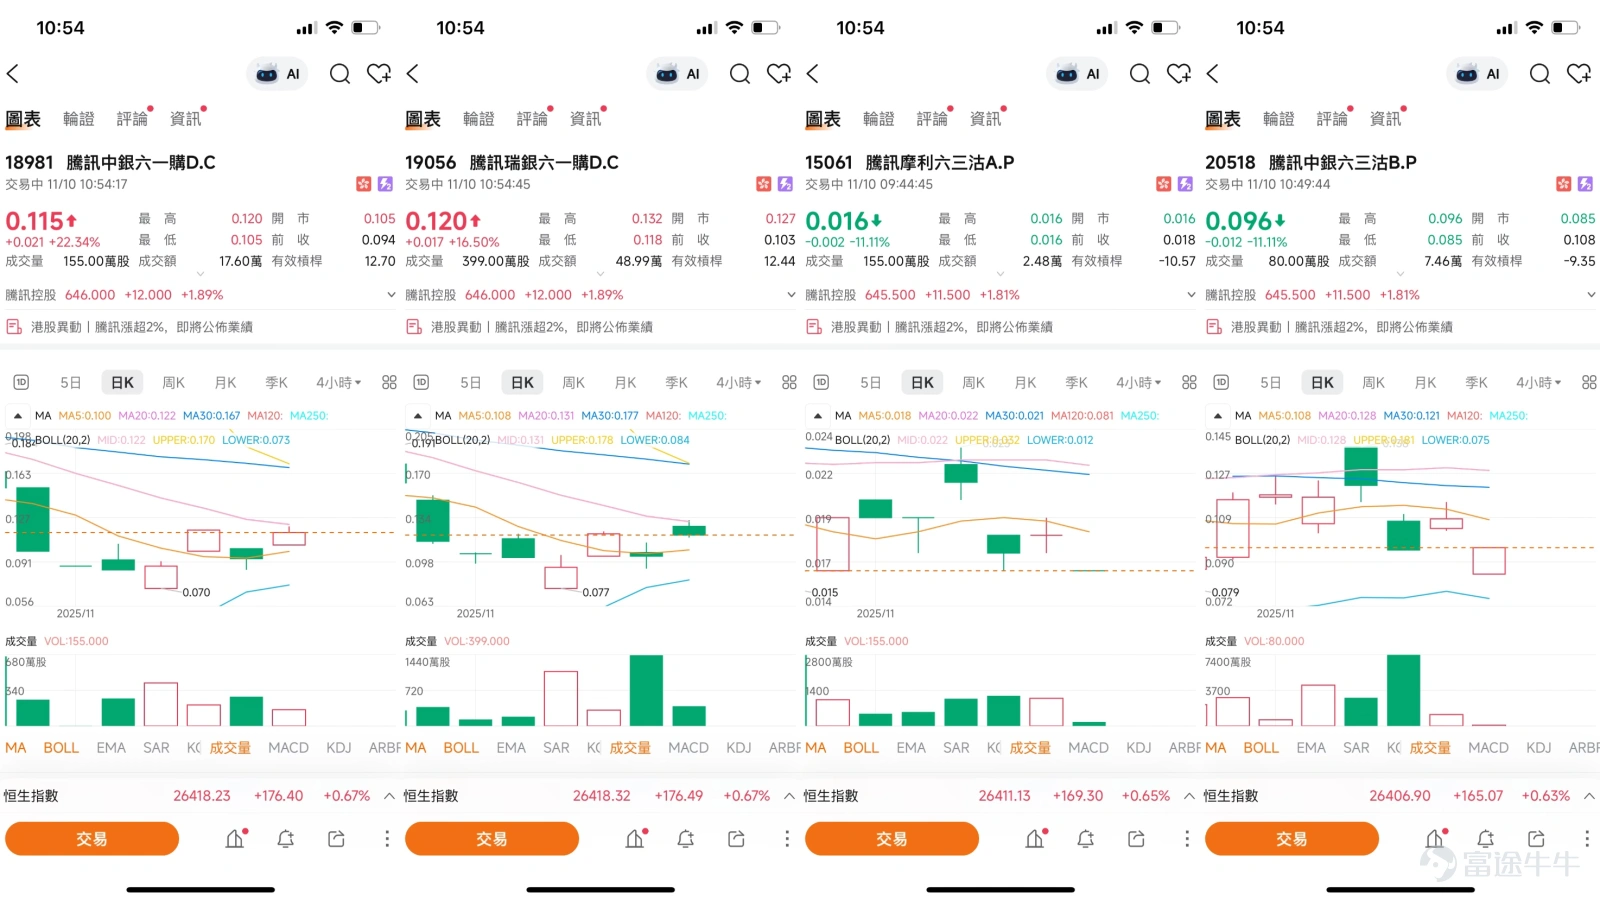
Derivative product recommendations
In terms of call warrants, BOC call warrant (18981) offers 13.4 times leverage with a strike price set at 728.5 yuan, notable for its relatively low implied volatility. Similarly, UBS Group call warrant (19056) $UBTENCT@EC2601D.C (19056.HK)$ is also worth noting, offering 12.8 times leverage with the same strike price of 728.5 yuan, also featuring the advantage of relatively low implied volatility. For investors who are bearish on the market outlook, Morley put warrant (15061) provides 10.1 times leverage, with a strike price set at 539.5 yuan, boasting the lowest premium and implied volatility among similar products. Another option, BOC put warrant (20518) $BITENCT@EP2603B.P (20518.HK)$ offers 8.9 times leverage, with a strike price of 534.5 yuan, also known for its relatively low implied volatility.
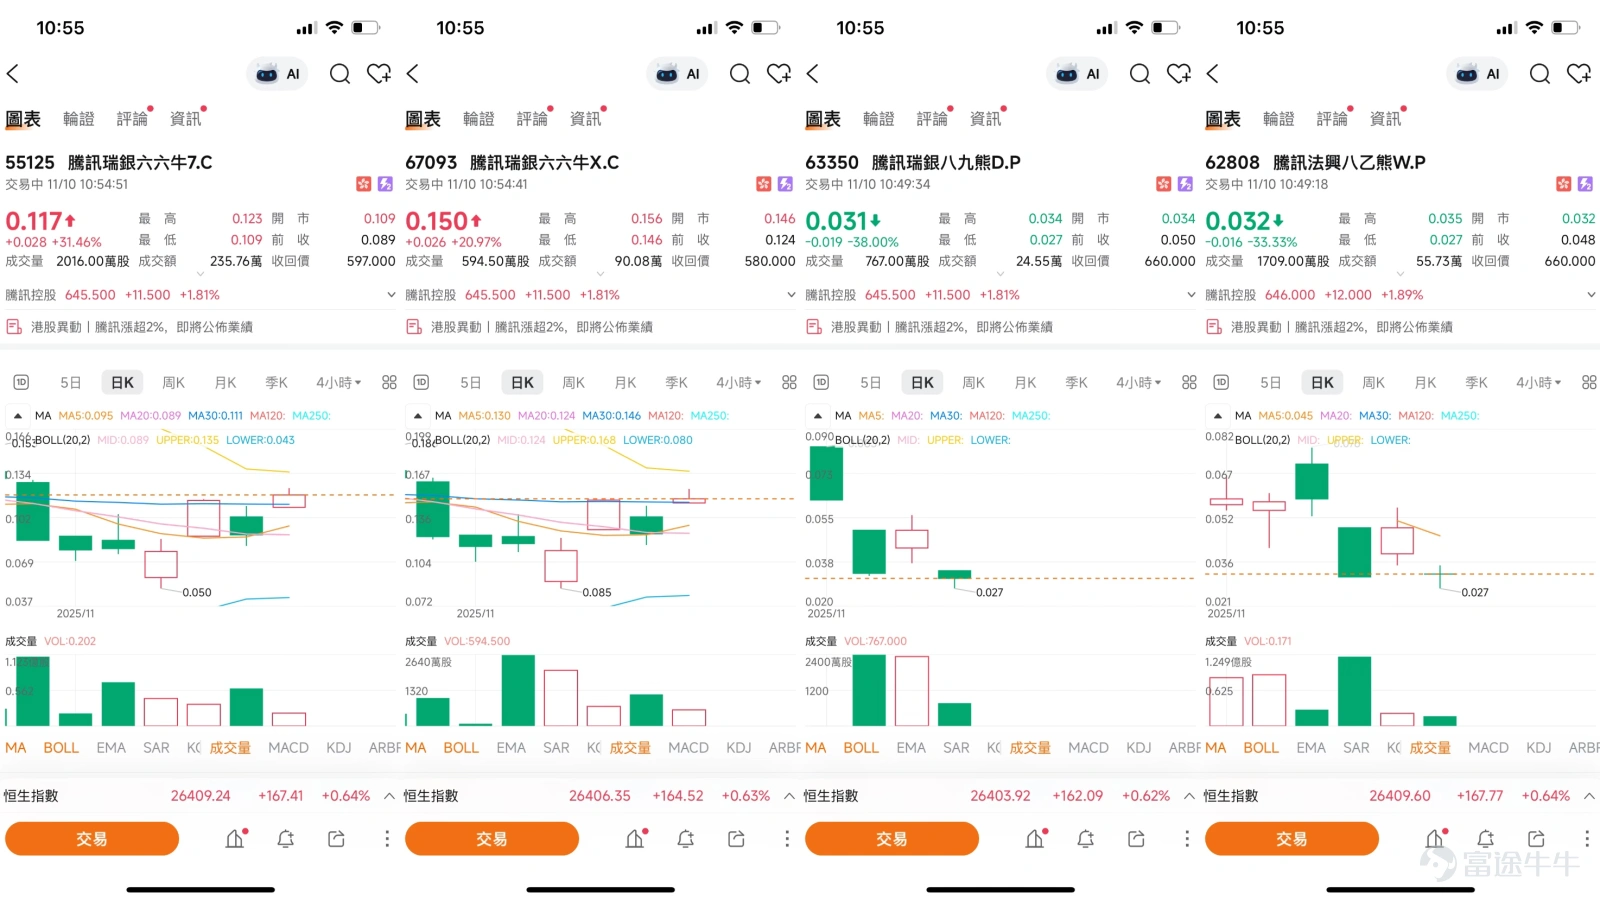
Selected Bull/Bear Certificate Products
In the bull certificates segment, UBS Group's bull certificate (55125) offers a leverage of 14.2 times with a call price set at HKD 597, featuring a relatively high leveraged price. Another UBS Group bull certificate (67093) provides a leverage of 10.2 times with a call price set at HKD 580, also possessing the advantage of a relatively high leveraged price. Among bear certificate options, UBS Group's bear certificate (63350) $UB#TENCTRP2809D.P (63350.HK)$ offers a leverage of 25.4 times with a call price set at HKD 660, characterized by a relatively high leveraged price. Societe Generale’s bear certificate (62808) $SG#TENCTRP2812W.P (62808.HK)$ provides a leverage of 26.4 times with the call price similarly set at HKD 660, also noted for its relatively high leveraged price.
Fellow investors, do you have any unique insights on Tencent's short-term trend? Are you optimistic about an upward breakout or do you expect it to remain range-bound? Feel free to share your thoughts in the comments section and let's exchange views. If you'd like to access more analysis on Hong Kong stock derivatives, be sure to follow the 'Hong Kong Warrants Jenny' account, where you'll find additional in-depth yet accessible analysis articles waiting for you.
This article does not constitute any investment advice.
This article is for reference only and does not constitute any investment advice. The market data, opinions, and analysis contained herein may change at any time without prior notice. We shall not be liable for any loss or damage arising from reliance on the information in this article. Technical analysis merely indicates whether certain technical conditions are met; a comprehensive evaluation of asset performance should incorporate additional data. Trading decisions should not be based solely on the content of this article. Please note that past performance is not indicative of future results.
#Tencent Short-term Strategy #HK Stock Warrants Opportunities #Technical Analysis Insights #Support and Resistance Levels Analysis #Warrant Selection #Bull and Bear Contracts Deployment #Market Volatility Operations #Trading Strategy Sharing #HK Stock Warrants Jenny #Investment Risk Management
Risk Disclaimer: The above content only represents the author's view. It does not represent any position or investment advice of Futu. Futu makes no representation or warranty.Read more

Comments
to post a comment
1