聯儲局再降25bp!美股接着奏樂接着舞?

Investment hot topic: How to analyze and deploy the last non-farm report before the US election and Fed meeting?
Next week may be the most stimulating moment for global capital markets! This is because there are two major events that are sufficient to influence market trends,US presidential election votingAndFederal Reserve interest rate meeting。
But before that, this Friday (November 1st, 8:30 PM Beijing time), there will be a major economic announcement, which isthe U.S. October non-farm payroll report.
Why is this non-farm payroll report important? What indicators do investors need to pay attention to? How to analyze and deploy? In this article, Mr. Bull will help everyone sort it out!
Why is this non-farm payroll report important?
Because the timing of this non-farm payroll report is very delicate, before the election and the interest rate meeting.
The non-farm report reflects the health of the labor market., although it does not directly impact the stock market, it will affect the formulation of monetary policy, and is an important reference indicator for the Federal Reserve's interest rate hikes and cutsImportant indicators for the Federal Reserve to raise or lower interest rates, and the Federal Reserve's interest rates will impact both the stock market and the bond market.
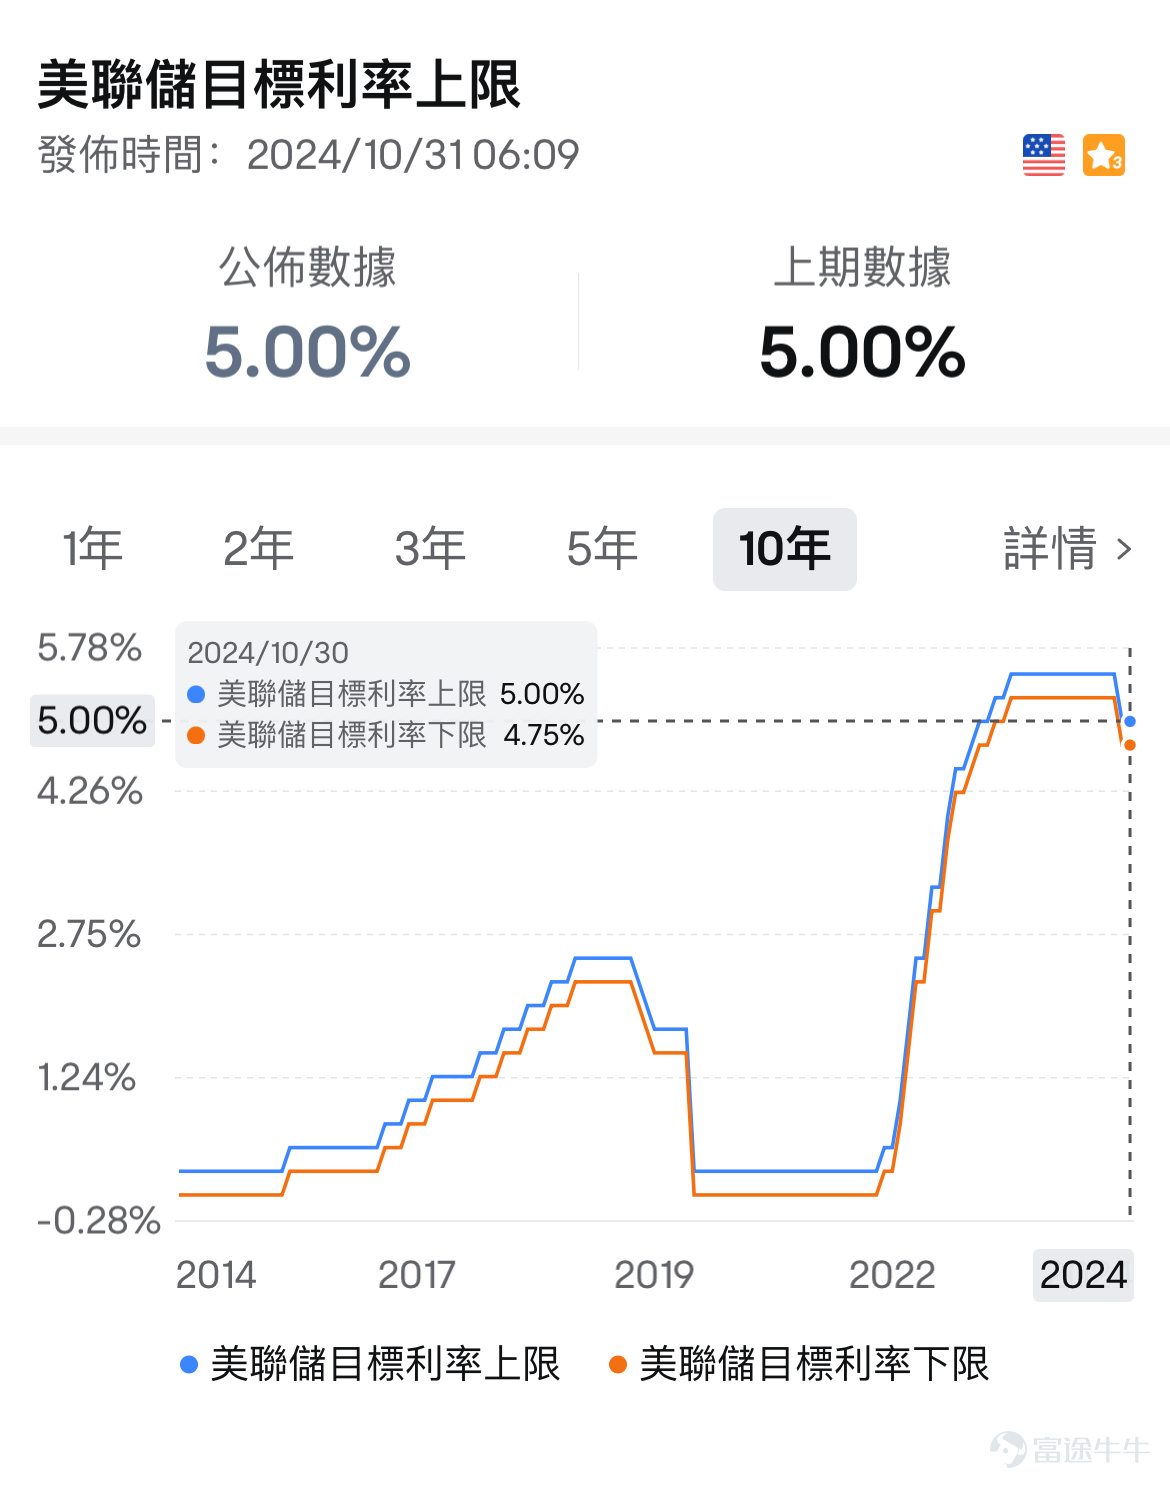
On September 18 this year, the Federal Reserve initiated a rate cut cycle, announcing a 50 basis point cut, bringing the benchmark interest rate down to 4.75% to 5%. Although the rate cut was anticipated, the magnitude exceeded expectations, with analysts at the time speculating that the Federal Reserve was concerned about deteriorating employment and implemented a preemptive rate cut.

The chart is from the Market > USA Stocks > Selected Macro Data section of the Futubull app
However, after the Federal Reserve's rate cut, U.S. bond yields increased instead of decreasing, currently the 10-year U.S. bond yield has returned to around 4.2%, catching many U.S. bond investors off guard (as bond prices move inversely to yields).

The main reasons may be twofold, one being that the September non-farm data after the rate cut was not as bad as expected, with an addition of 0.25 million far exceeding expectations, making the market feel that employment may not deteriorate severely. In addition, the increasing probability of Trump's re-election recently is seen to push up inflation, thus lowering the expectations for rate cuts. These two factors have led to a continuous surge in US bond rates.
Therefore, the October non-farm data is very important this time, as it may be one of the indicators determining whether US bond rates have peaked in the short term.
What indicators do investors need to pay attention to? How to analyze them?
A complete non-farm employment report includes a lot of data. Investors can focus on the following two data points:
– Nonfarm Payrolls:It refers to employment data excluding agricultural labor force, simply understood as the employment numbers in the US manufacturing, construction, and service sectors.
– Unemployment RateThe unemployment rate is the proportion of the unemployed population to the employed population in a country.
The analysis method is also very simple. If the number of non-agricultural employed people increases and the unemployment rate is low, it indicates a strong job market, a prosperous economic market, and less urgency to reduce interest rates. If the number of non-agricultural employed people increases less and the unemployment rate is high, it may indicate the risk of potential economic recession, affecting investment and consumer confidence, increasing the urgency to reduce interest rates.
In addition, short-term market fluctuations are also related to expectations. Mooers can use the Futubull app to check the market's expected value through the path of Market > US Stocks > Economic Calendar, and add it to your calendar.Market > US Stocks > Economic Calendarpath, find the expected market value of relevant data, and add it to your calendar.
You can see that the current market's expectation for the number of new non-agricultural employed people in October is0.115 million, while the expected unemployment rate is 4.1%。

If the non-farm data in October exceeds expectations, indicating a good employment situation, it may strengthen the expectation of a "soft landing", which could be a potential bullish signal for the US stock market and may further drive the US stock market in the short term.
If the non-farm data in October falls below expectations, it may imply weakening employment, which could strengthen the expectation of a rate cut by the Federal Reserve. In this case, rate-sensitive sectors may benefit in the short term, such as US bonds, small-cap stocks, biomedical stocks, and so on.
How should investors deploy their assets?
How to deploy actually depends on your assessment of the impact of non-farm data on the future market. There are three potential scenarios:
1. If non-farm data exceeds expectations, the market follows the narrative of a "soft landing".In this case, the overall US stock market may benefit. If you are unsure how to choose individual stocks, you may consider large cap index ETFs, such as tracking $S&P 500 Index (.SPX.US)$ or $NASDAQ 100 Index (.NDX.US)$ ETFs, among which $Vanguard S&P 500 ETF (VOO.US)$ and $Invesco QQQ Trust (QQQ.US)$ are the two largest ETFs tracking these two indices respectively.
Click here., you can learn more about investing in US large cap ETFs.

2. Non-farm payrolls fall short of expectations, leading the market to discuss 'rate cut trade'.Therefore, US Treasury bonds may benefit in the short term, as the price of US Treasury bonds is inversely related to interest rates. Among them $iShares 20+ Year Treasury Bond ETF (TLT.US)$ is the largest ETF in terms of assets under management, tracking 20-year US Treasury bonds. TLT also has leveraged versions, such as $Direxion Daily 20+ Year Treasury Bull 3X Shares ETF (TMF.US)$ is three times long position, $Direxion Daily 20+ Year Treasury Bear 3x Shares ETF (TMV.US)$ is three times short position. However, it is important to note that leveraged ETFs can lead to significant gains and losses, not suitable for investors with lower risk tolerance.
Click here.can learn more about investment methods for US Treasury bonds.

3. If you are not clear about the direction and believe that future market volatility may be significant, even panic emotions may arise, then consider adding some long volatility ETFs to the portfolio to hedge risks. Long volatility ETFs track $VIX (LIST91327.US)$ When the market is in panic, the VIX index will rise, and related ETFs may benefit, among which the largest long volatility ETF in terms of assets is $ProShares Ultra VIX Short-Term Futures ETF (UVXY.US)$ 。
Click here., you can learn more about investing in the fear index VIX.

However, Sir Bull still wants to remind you of the risks.Regarding risks., market trends are constantly changing, often leading to unexpected situations. Therefore, mooers should assess their risk tolerance, implement good profit-taking and stop-loss strategies to avoid significant losses.
Alright, mooer, that's all for today. Do you think the non-farm payroll data on Friday will exceed expectations? How will the market react? Feel free to leave a comment to share~
PS. Please pay attention. @牛牛課堂, orClick here.Join the class to get more investment dry goods, greatly improve investment skills! If you want to exchange more, you can also join the mooer.Official investment exchange groupLearning, Chief Analyst real-time online guidance!
Risk Disclaimer: The above content only represents the author's view. It does not represent any position or investment advice of Futu. Futu makes no representation or warranty.Read more


Comments (3)
to post a comment
25
61