
政策大禮包頻出!中國資產能否持續回暖?
Futu Research | Hong Kong stocks rebound strongly: What range are the current market and various industries' valuations in?
In the afternoon of October 18, Hong Kong stocks surged across the board, with the Hang Seng Index rising by 3.61% to close at 20804.11 points; the Hang Seng Tech Index skyrocketed by 5.77% to 4600.85 points. This wave of increase not only reflects the positive change in market sentiment but also the strengthening confidence of investors in future economic growth.
Looking back at recent analysis, after experiencing previous fluctuations, from a medium to long-term perspective, the valuation of Hong Kong stocks, especially the Hang Seng Index and Hang Seng Tech Index, remains at relatively attractive levels. Next, we will analyze the valuation situation of these two indices specifically and compare them with the valuation of U.S. stock global sectors, demonstrating the more advantageous valuation of Hong Kong stocks.
1. Hang Seng Index
1. PE-TTM
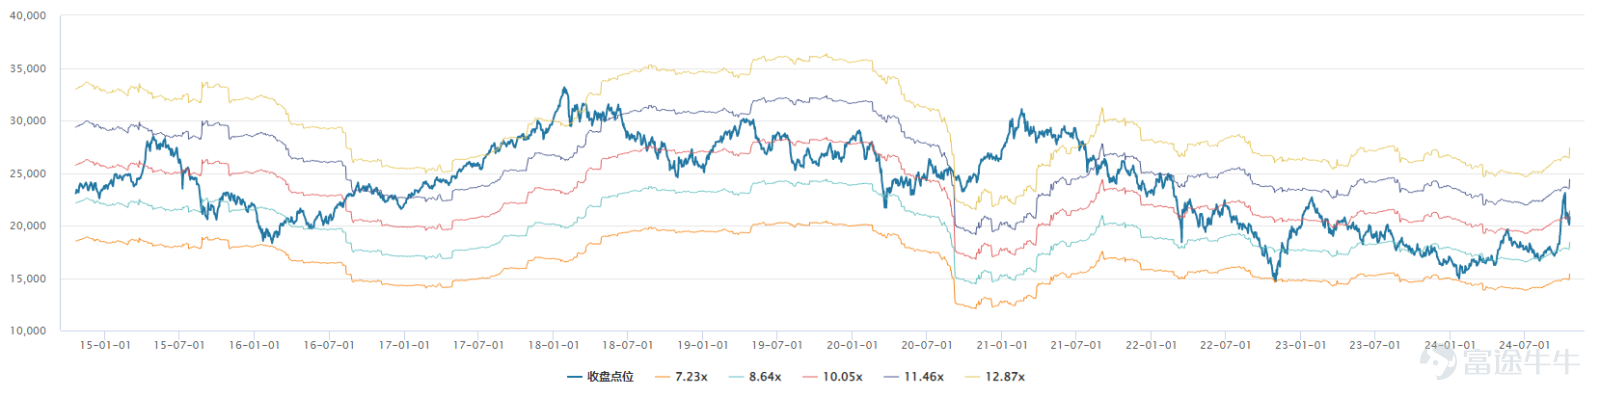
As of October 18, the price-to-earnings ratio (PE-TTM) of the Hang Seng Index was 9.78 times, at the 42.61st percentile of historical data over the past decade, below the historical average level, indicating the current valuation is within a reasonable range.
Chart: Comparison of historical PE-Band of Hang Seng Index, where the red line represents the historical valuation central position.

Source: Wind
2. PB
On the same day, the price-to-book ratio (PB) of the Hang Seng Index was 0.97 times, ranking at the 27.45th percentile of historical data from the past ten years, significantly lower than the historical average level, indicating a lower valuation and a certain margin of safety.
Chart: Historical PB-Band comparison of the Hang Seng Index, with the red line indicating the historical valuation central position.

Source: Wind
2. Hang Seng Tech Index
1. PE-TTM
On October 18, the price-earnings ratio (PE-TTM) of the Hang Seng Tech Index was 24.55 times, ranking at the 25.91st percentile over the past ten years, much lower than the danger value of 44.35 times, close to the opportunity value of 23.05 times, indicating the current valuation is relatively reasonable.
Chart: Comparison of hang seng tech index's historical PE-Band, with the red line indicating the historical valuation central position.

Source: Wind
2, pb
The pb (pb) of the Hang Seng Tech Index is 2.64 times, ranking at 45.91% of the past ten years, on par with the historical median.
Chart: Comparison of hang seng tech index's historical PB-Band, with the red line indicating the historical valuation central position.

Source: Wind
3, Valuation Comparison of Hong Kong/American Stock Global Sectors
As of the closing on October 18th, based on secondary industry structure data provided by Wind, except for autos, auto parts, and retail trade, the overall valuation of various sectors in the Hong Kong stock market is lower than the US stock market.
Image: Comparison of industry valuations between the Hong Kong and American stock markets

Source: Wind
Based on the above analysis, despite recent market fluctuations, from a valuation perspective, Hong Kong stocks still have significant attractiveness. However, investors can seize trading opportunities in high volatility markets, but be cautious not to chase prices in ranges where valuations deviate significantly.
Risk Disclaimer: The above content only represents the author's view. It does not represent any position or investment advice of Futu. Futu makes no representation or warranty.Read more

Comment (1)
to post a comment
6
5