
非農數據下修!美股狂歡能否持續?

Futu Research | Taking July CPI as an example, how to seize trading opportunities?
Recently, US macroeconomic data have been released frequently. Coupled with the liquidity crisis caused by Japanese yen arbitrage transactions and ongoing geopolitical risks, the US stock market has fluctuated greatly. Global capital markets have been strongly shocked by the sell-off fears triggered by the July non-farm payrolls report, which has made investors pay more attention to the performance of subsequent US economic data.
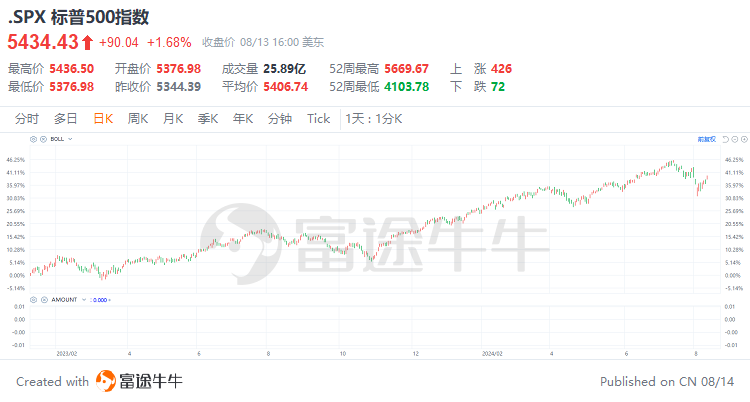
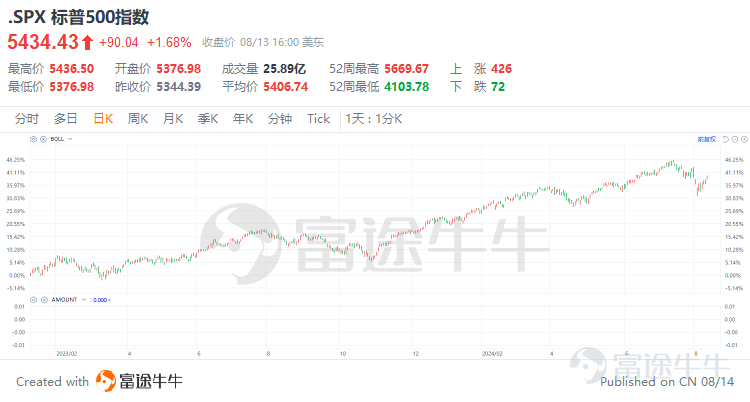
Last week, a positive initial jobless claim report once pushed the S&P 500 index to its biggest single-day increase in nearly two years, injecting strength into the market. However, the July Consumer Price Index (CPI) data to be released this week will undoubtedly be the focus of the market. If the July CPI data clearly exceeds or falls short of market expectations, it may cause sharp market fluctuations.
In this context, in response to recent changes in macro data, we need to formulate corresponding trading strategies according to different data situations.So, how should we adjust our trading decisions based on fluctuations in this data?
CPI data may be the trigger for market fluctuations. The year-on-year CPI growth rate is expected to slow further in July
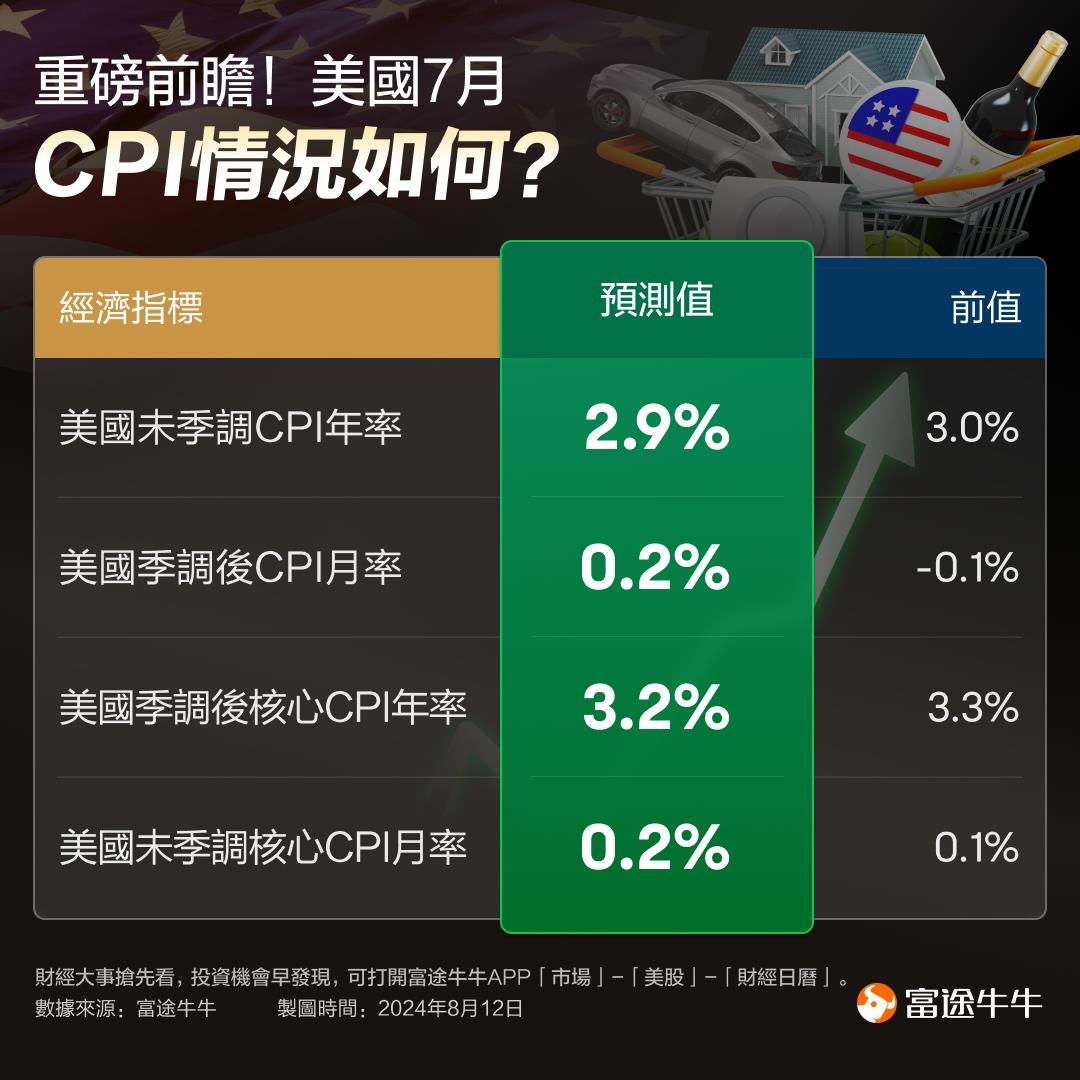
On August 14, the US Bureau of Labor Statistics will release the July CPI data. The market generally expects inflation to show signs of slowing down, even though it has not yet reached the Fed's 2% target. The overall CPI growth rate is expected to drop slightly to 2.9% in July, and the core CPI growth rate is expected to be 3.2% year over year, all slightly down from the previous month, marking the lowest level in more than three years.
The decline in the inflation rate for core commodities, combined with the slowdown in wage growth to 3.6% in the July employment data, indicates a reduction in cost pressure on the service sector and is expected to further drive the decline in the inflation rate. The Cleveland Federal Reserve's model even predicts that the year-on-year CPI growth rate in August may drop to 2.7%.
Earlier, the Federal Reserve reiterated in its July interest rate resolution statement that the Fed will only consider cutting interest rates if it is more confident that inflation is moving sustainably towards the 2% target.
Therefore, if the July CPI data slows down as expected, it is expected to add more weight to the September interest rate cut; if the data changes beyond expectations, it may cause market fluctuations.
Faced with frequently released US macroeconomic data, how can investors lay out their trading strategies?
The level of inflation and unemployment are the two core indicators that the Federal Reserve focuses on. Changes in these two indicators not only show the health of the US economy, but also significantly affect the Federal Reserve's monetary policy.
Next, we will divide it into 3 types of background assumptions based on changes in indicators to explore what investment strategies investors can consider adopting based on different circumstances.
1. The CPI growth rate has slowed, the unemployment rate has increased slightly, and the probability of interest rate cuts in September has increased: the economy remains stable and market transactions “cut interest rates”
Assuming that the CPI growth rate slows year-on-year and the unemployment rate increases slightly, we can understand that the level of US inflation is under control, the labor market remains stable, and the overall economic environment remains healthy. Under such circumstances, the Federal Reserve can begin to relax monetary policy in an orderly manner, cut interest rates steadily, and market transactions “cut interest rates” logic. We can adopt the following trading strategies:
(1) Interest rate cuts will cause treasury bond yields to decline, which will benefit bond prices. According to long-term estimates, in theory, for every 1 percentage point cut in interest rates, the TLT price may rise by about 15%. Therefore, we can make multi-bonds and buy bond ETFs, related targets such as$iShares 20+ Year Treasury Bond ETF (TLT.US)$ with$Ishares Iboxx $ Investment Grade Corporate Bond Etf (LQD.US)$; At the same time, it is also possible to consider selling put options to obtain premium income, which can be combined with Cash Plus to increase yield.
(2) Interest rate cuts will cause the dollar to depreciate, which will benefit safe-haven assets such as cryptocurrencies. Therefore, we can make more crypto-related products and buy Bitcoin ETFs, related targets such as$iShares Bitcoin Trust(IBIT.US)$,$Fidelity Wise Origin Bitcoin Fund (FBTC.US) $。
(3) Under the premise of economic stability, interest rate cuts will help reduce the financing costs of enterprises and improve the company's EPS, thereby driving up the general market. Because we can make large market indices such as SPX, buy large market index ETFs, related targets such as$SPDR S&P 500 ETF (SPY.US) $,$iShares Core S&P 500 ETF (IVV.US) $, and$Vanguard S&P 500 ETF (VOO.US) $。
(4) On the premise of economic stability, interest rate cuts are beneficial to the stability of the general market and reduce market panic. Therefore, we can consider shorting volatility. Relevant targets such as$ProShares Short VIX Short-Term Futures ETF (SVXY.US)$,$1x Short VIX Futures ETF (SVIX.US)$ 。
Using Strategy 1 as an example, it is possible to estimate how much return we can get by selling TLT put options and superimposed on the Cash Plus Strategy:
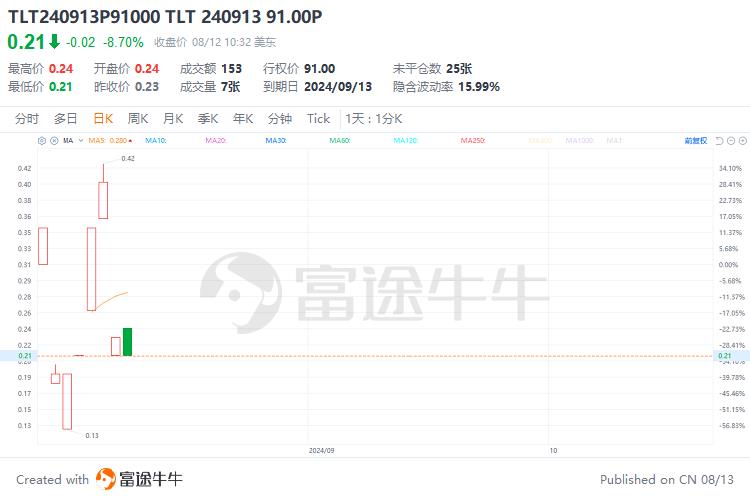
Assuming that $91 is less than our ideal price to buy TLT, we can sell 1 TLT put option with an exercise price of $91 and an expiration date of September 13 (before the interest meeting). As long as the TLT price does not fall below $91 on September 13, we can earn $21 in a month (calculated at the closing price on August 12 EST), and the annualized yield is about 2.8% when rolled over; at the same time, we can earn interest income of about 5% per annum.
Taken together, Strategy 1 alone can give us an annualized return of 7.8%. If the option execution doesn't matter, you can buy TLT at a lower cost.
2. The CPI growth rate rebounded beyond expectations, the unemployment rate stabilized, and the probability of interest rate cuts declined in September: market conditions fluctuated
(1) In the case of market fluctuations, we can consider adopting a swing trading strategy to buy high and sell low.
(2) Considering that interest rate cuts are a long-term trend, cutting interest rates will benefit bond prices in the long term. According to long-term estimates, in theory, for every percentage point cut in interest rates, the TLT price may rise by about 15%. Therefore, we can still continue to hold bond ETFs, related targets such as$iShares 20+ Year Treasury Bond ETF (TLT.US)$with$Ishares Iboxx $ Investment Grade Corporate Bond Etf (LQD.US)$; and earn premium income by selling high-priced call options.
(3) In volatile markets, cash management and investment should be strengthened. Investing in products such as Cash Plus (Cash Plus) can boost returns.
Using Strategy 2 as an example, we can measure how much return we can get by holding TLT and selling TLT bullish options strategy:
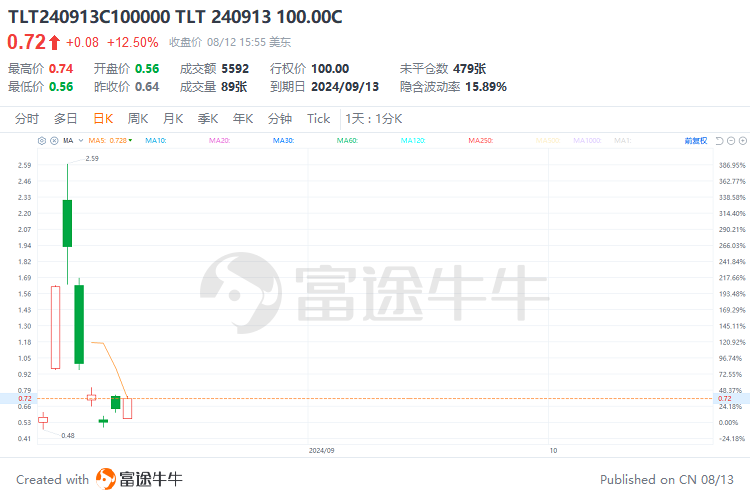
Assuming that we think it is difficult for the TLT price to break through $100, we can sell 1 TLT bullish option with 100 shares of TLT with an expiry date of September 13. As long as the TLT price breaks through $100 on September 13, we can earn $72 in royalties a month, rolling down to an annualized yield of about 9%; plus the TLT annualized dividend rate of 3.72%.
Taken together, Strategy 2 alone can bring us an annualized yield of 12.72%, and at the same time, the spread benefits brought about by the TLT 15% price increase brought about by an average interest rate cut of 1 point. On the premise of holding the original stock, it doesn't matter if it is exercised; it is equivalent to making a profit of TLT by selling it at a high price of $100.
3. The CPI growth rate has slowed beyond expectations, the unemployment rate has increased more than expected, and the probability of interest rate cuts in September has increased dramatically: expectations of economic recession have increased, and market transactions have “declined”
(1) Interest rate cuts will cause treasury bond yields to decline, which is beneficial for bond prices to rise. According to long-term estimates, in theory, for every percentage point cut in interest rates, the TLT price may increase by about 15%. Therefore, we can make multi-bonds and buy bond ETFs, related targets such as$iShares 20+ Year Treasury Bond ETF (TLT.US)$with$Ishares Iboxx $ Investment Grade Corporate Bond Etf (LQD.US)$You can also consider obtaining premium income by selling bearish options, and superimposing Cash Plus to increase the yield (estimated annualized yield of about 7.8% based on the above estimates).
(2) Interest rate cuts will cause the dollar to depreciate, which will benefit safe-haven assets such as cryptocurrencies. Therefore, we can make more crypto-related products and buy Bitcoin ETFs, related targets such as$iShares Bitcoin Trust(IBIT.US)$,$Fidelity Wise Origin Bitcoin Fund (FBTC.US) $。
(3) Due to rising expectations of economic recession, interest rate cuts may cause market panic in the short term, and the US stock market may face adjustments. Therefore, we can short market indices in the short term. Relevant targets such as$Short S&P 500 Proshares (SH.US)$ 、$Proshares Ultrashort S&P500 (SDS.US)$ with$ProShares UltraPro Short S&P500 ETF (SPXU.US)$ ; $ProShares Short QQQ (PSQ.US)$ 、$ProShares UltraShort QQQ (QID.US)$ with$ProShares UltraPro Short QQQ ETF (SQQQ.US)$ 。
(4) Volatility will increase in the context of economic recession and market panic. Therefore, we can consider increasing volatility. Relevant targets such as UVXY$ProShares Ultra VIX Short-Term Futures ETF (UVXY.US)$ 。
In such an uncertain financial market, it is necessary to have sharp insight and the ability to adjust strategies flexibly. As we've discussed, every fluctuation in macroeconomic data is a test of investors' intelligence and decision-making ability.
Whether it's a slowdown in CPI growth or a subtle change in the unemployment rate, every data point is the cornerstone of our investment decisions. Based on this, we have developed three different trading strategies to deal with possible market changes. These strategies not only take into account the immediate reaction of the market, but also focus on the long-term investment layout.
Remember, market fluctuations present us with opportunities, and thorough analysis and smart decisions are key to seizing these opportunities. In this age of information explosion, let us not be fooled by short-term fluctuations, keep a clear mind, and meet the challenges of every market with strategy and patience.
Finally, let's end this topic with a more mature and rational attitude. Investing isn't just a game about numbers; it's also about the art of understanding the meaning behind those numbers. Remember, real investors look for opportunity in volatility and certainty in uncertainty. Let's take a firmer step towards a smarter investment path.
Risk Disclaimer: The above content only represents the author's view. It does not represent any position or investment advice of Futu. Futu makes no representation or warranty.Read more


Comments (8)
to post a comment
101
111