
English
Back
Open Account
段永平增持!拼多多Q1業績可以超預期嗎?

牛牛課堂
joined discussion · ·

[Investment Topic] The king of e-commerce! How do we evaluate PDD's performance?

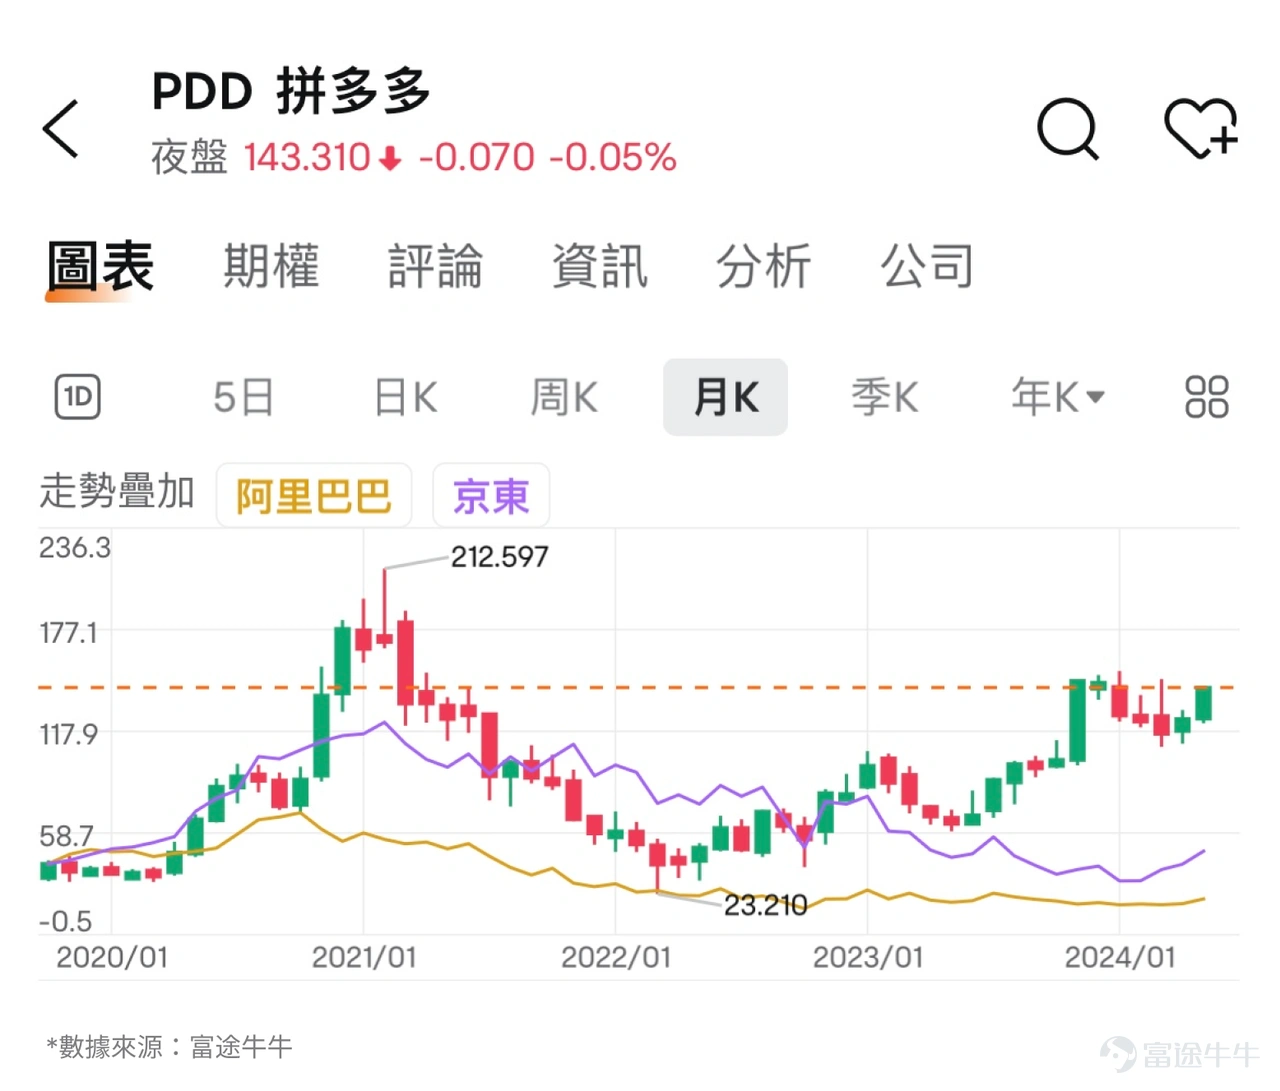
In the two-year period from 2022 to 2023,$PDD Holdings (PDD.US)$they rose by 40% and 79%, respectively, with a total increase of 151% over the two years. The stock price also once returned to nearly two-thirds of its highest point. In the overall decline of Chinese concept stocks, this performance can be said to be extremely rare. By contrast,$Alibaba (BABA.US)$there was a 34% decline during the same period, and the stock price was only one-fourth of its highest point.$JD.com (JD.US)$It dropped by 57% and the stock price was also only a little over one-fourth of the previous high. On one hand, there was a substantial increase, on the other hand, there was a dramatic decline. Under the two extremes, by the end of November 2023, the market cap of PDD Holdings surpassed that of Alibaba, becoming the largest domestic e-commerce platform in terms of market cap. In the following months, the market caps of the two companies alternated, and it was no longer the situation where one company dominated as it did in the past. In the environment of weak consumer confidence, PDD Holdings has achieved a comeback in the highly competitive e-commerce industry. So, can PDD Holdings continue to maintain its leading advantage? We can grasp three key points by looking at its performance:Changes in performance growth rate, changes in profitability, and a comparison of actual performance with expectations.. 1. Changes in performance growth rate For PDD Holdings' performance growth rate, we can look at two points, including the change in its own performance growth rate and the comparison with peers in the e-commerce industry. The most intuitive manifestation of PDD's rise against the trend is reflected in its high revenue growth.From Q1 2022 to Q4 2023, PDD's...
In the two-year period of 2022-2023,$PDD Holdings (PDD.US)$It rose by 40% and 79% respectively, with a cumulative increase of 151% over the two years. The stock price also once returned to nearly 2/3 of its highest point. In the overall decline of Chinese concept stocks, this performance can be said to be extremely rare. In contrast,$Alibaba (BABA.US)$It fell by 34% during the same period, and the stock price was only 1/4 of its highest point.$JD.com (JD.US)$It fell by 57%, and the stock price was also only slightly higher than 1/4 of its previous high.
In the two-year period from 2022 to 2023,$PDD Holdings (PDD.US)$they rose by 40% and 79%, respectively, with a total increase of 151% over the two years. The stock price also once returned to nearly two-thirds of its highest point. In the overall decline of Chinese concept stocks, this performance can be said to be extremely rare. By contrast,$Alibaba (BABA.US)$there was a 34% decline during the same period, and the stock price was only one-fourth of its highest point.$JD.com (JD.US)$It dropped by 57% and the stock price was also only a little over one-fourth of the previous high. On one hand, there was a substantial increase, on the other hand, there was a dramatic decline. Under the two extremes, by the end of November 2023, the market cap of PDD Holdings surpassed that of Alibaba, becoming the largest domestic e-commerce platform in terms of market cap. In the following months, the market caps of the two companies alternated, and it was no longer the situation where one company dominated as it did in the past. In the environment of weak consumer confidence, PDD Holdings has achieved a comeback in the highly competitive e-commerce industry. So, can PDD Holdings continue to maintain its leading advantage? We can grasp three key points by looking at its performance:Changes in performance growth rate, changes in profitability, and a comparison of actual performance with expectations.. 1. Changes in performance growth rate For PDD Holdings' performance growth rate, we can look at two points, including the change in its own performance growth rate and the comparison with peers in the e-commerce industry. The most intuitive manifestation of PDD's rise against the trend is reflected in its high revenue growth.From Q1 2022 to Q4 2023, PDD's...
On the one hand, there is a significant rise, on the other hand, there is a dramatic fall. Under these two extreme situations, by the end of November 2023, PDD's market cap surpassed Alibaba's, becoming the largest company in China's e-commerce platform market cap. In the following months, the market caps of the two companies took turns leading, no longer the previous situation of one being dominant.
In the environment of low consumer confidence and the turbulent e-commerce industry, PDD Holdings has achieved a breakthrough. So, can PDD Holdings continue to maintain its leading advantage? We can grasp three key points by looking at its performance:Performance growth rate change, profitability change, and a comparison of actual performance with expectations..
1. Changes in performance growth rate
For PDD Holdings' performance growth rate, we can look at two points, including the change in its own performance growth rate and the comparison with its peers in the e-commerce industry.
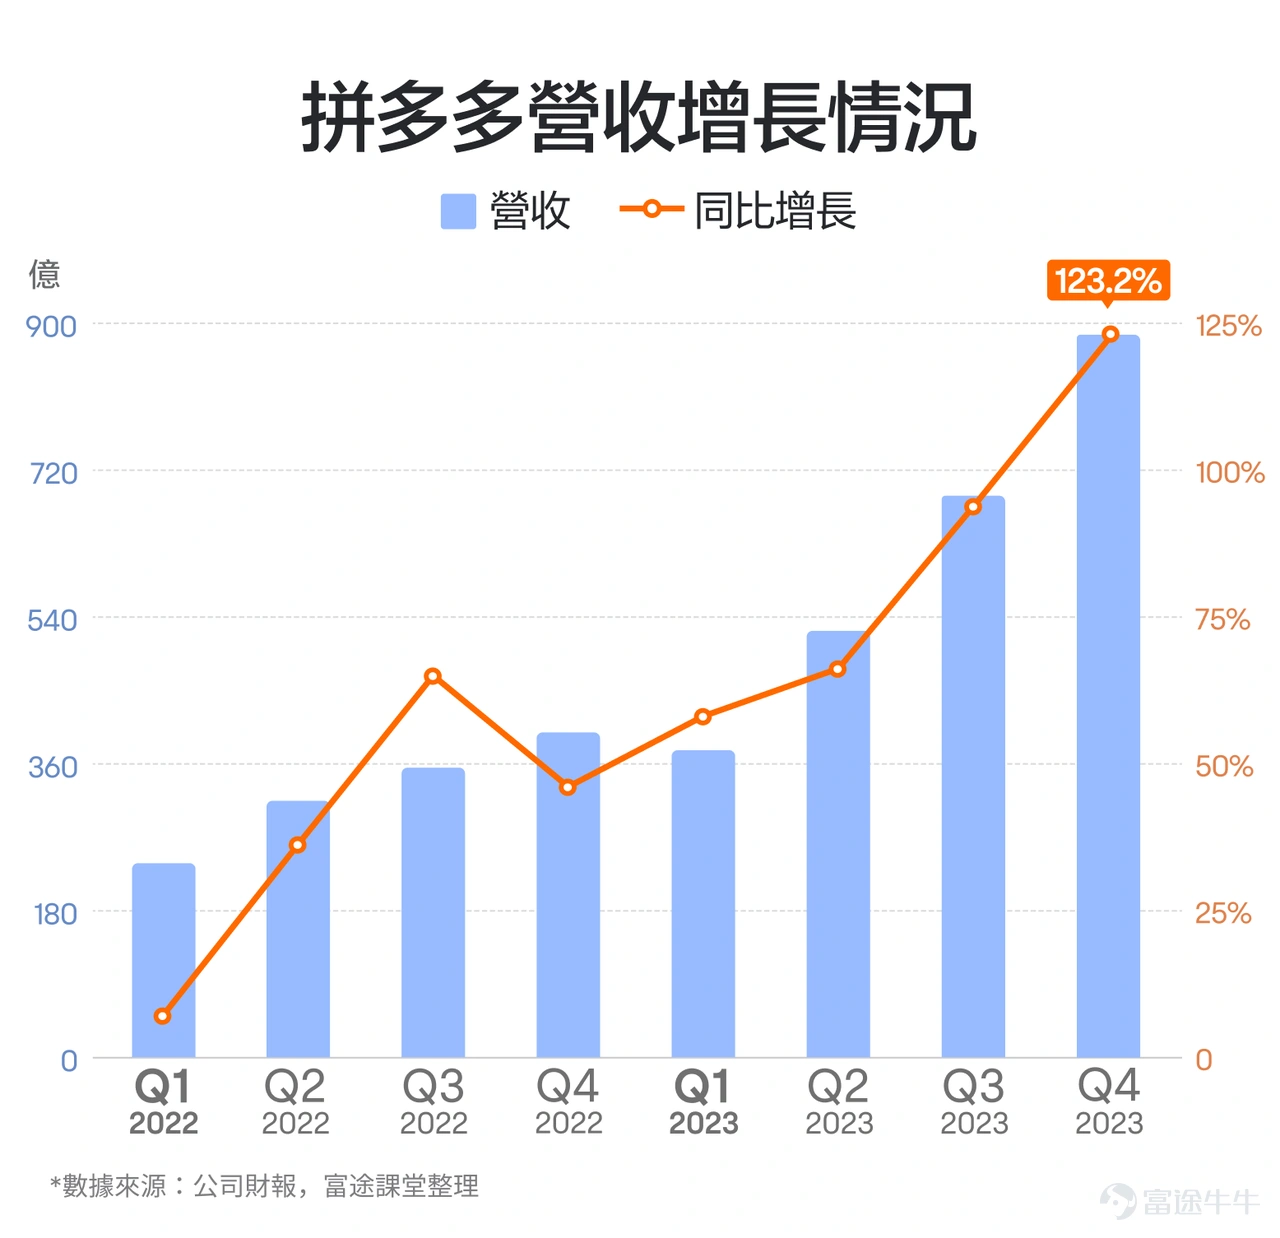
The most intuitive aspect of PDD Holdings' counter-trend rise is reflected in the high-speed growth of its revenue.From Q1 2022 to Q4 2023, PDD Holdings' revenue growth rate has mostly accelerated, with the latest Q4 of 2023 seeing a year-on-year increase of more than double.The rapid growth in performance is also an important driver of the significant increase in its stock price.
In the two-year period from 2022 to 2023,$PDD Holdings (PDD.US)$they rose by 40% and 79%, respectively, with a total increase of 151% over the two years. The stock price also once returned to nearly two-thirds of its highest point. In the overall decline of Chinese concept stocks, this performance can be said to be extremely rare. By contrast,$Alibaba (BABA.US)$there was a 34% decline during the same period, and the stock price was only one-fourth of its highest point.$JD.com (JD.US)$It dropped by 57% and the stock price was also only a little over one-fourth of the previous high. On one hand, there was a substantial increase, on the other hand, there was a dramatic decline. Under the two extremes, by the end of November 2023, the market cap of PDD Holdings surpassed that of Alibaba, becoming the largest domestic e-commerce platform in terms of market cap. In the following months, the market caps of the two companies alternated, and it was no longer the situation where one company dominated as it did in the past. In the environment of weak consumer confidence, PDD Holdings has achieved a comeback in the highly competitive e-commerce industry. So, can PDD Holdings continue to maintain its leading advantage? We can grasp three key points by looking at its performance:Changes in performance growth rate, changes in profitability, and a comparison of actual performance with expectations.. 1. Changes in performance growth rate For PDD Holdings' performance growth rate, we can look at two points, including the change in its own performance growth rate and the comparison with peers in the e-commerce industry. The most intuitive manifestation of PDD's rise against the trend is reflected in its high revenue growth.From Q1 2022 to Q4 2023, PDD's...
PDD's revenue growth engine mainly has two parts. In the early stage, under the backdrop of low economic confidence, people's consumption showed a downward trend, and PDD, known for its low prices, perfectly followed this trend and became the biggest beneficiary.In the later stage, under the impetus of Temu, PDD's international business advanced by leaps and bounds, becoming another important growth driver for revenue.
So how does PDD compare to its peers in the e-commerce industry? The main comparison is with Alibaba and JD.com. Let's compare the revenue growth rate and sales expense ratio of these three e-commerce companies.
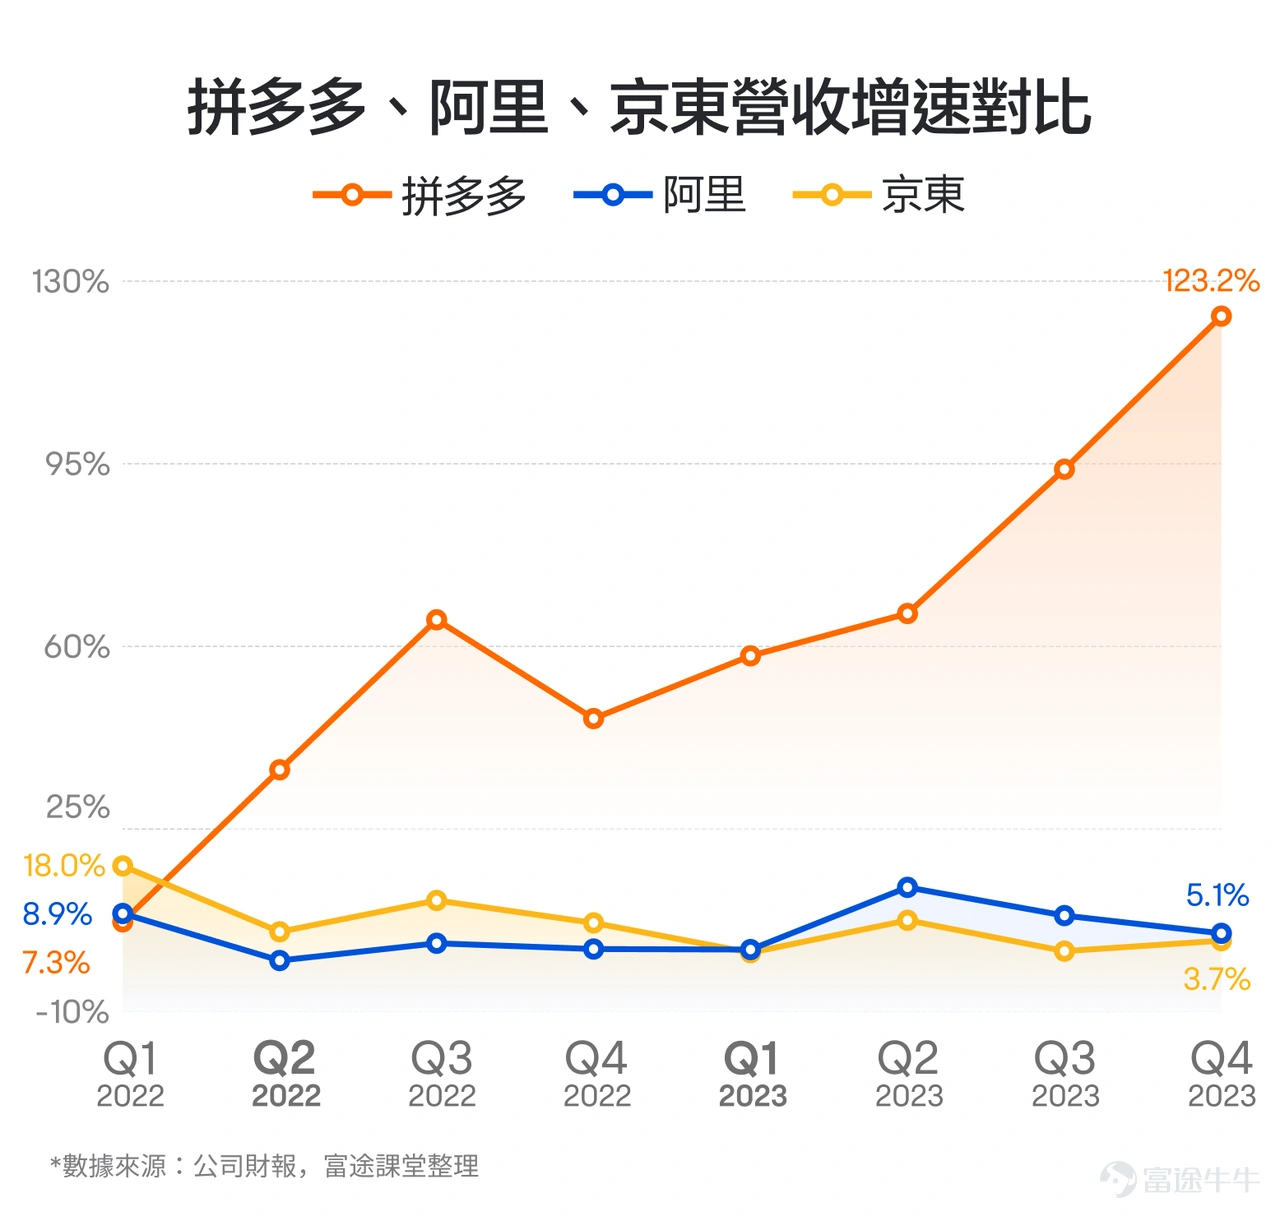
First, let's compare the revenue growth rates of the three companies. The faster the revenue growth, the more favorable position the company is in competition. From the 2022 Q2 quarter when PDD's stock price started to rise, PDD's quarterly revenue growth rate has consistently surpassed Alibaba and JD.com. In 2023, when Alibaba and JD.com only maintained single-digit growth overall, PDD took the opportunity to grab a larger share of the market and entered a period of continuous accelerated growth in each quarter.
In the two-year period from 2022 to 2023,$PDD Holdings (PDD.US)$they rose by 40% and 79%, respectively, with a total increase of 151% over the two years. The stock price also once returned to nearly two-thirds of its highest point. In the overall decline of Chinese concept stocks, this performance can be said to be extremely rare. By contrast,$Alibaba (BABA.US)$there was a 34% decline during the same period, and the stock price was only one-fourth of its highest point.$JD.com (JD.US)$It dropped by 57% and the stock price was also only a little over one-fourth of the previous high. On one hand, there was a substantial increase, on the other hand, there was a dramatic decline. Under the two extremes, by the end of November 2023, the market cap of PDD Holdings surpassed that of Alibaba, becoming the largest domestic e-commerce platform in terms of market cap. In the following months, the market caps of the two companies alternated, and it was no longer the situation where one company dominated as it did in the past. In the environment of weak consumer confidence, PDD Holdings has achieved a comeback in the highly competitive e-commerce industry. So, can PDD Holdings continue to maintain its leading advantage? We can grasp three key points by looking at its performance:Changes in performance growth rate, changes in profitability, and a comparison of actual performance with expectations.. 1. Changes in performance growth rate For PDD Holdings' performance growth rate, we can look at two points, including the change in its own performance growth rate and the comparison with peers in the e-commerce industry. The most intuitive manifestation of PDD's rise against the trend is reflected in its high revenue growth.From Q1 2022 to Q4 2023, PDD's...
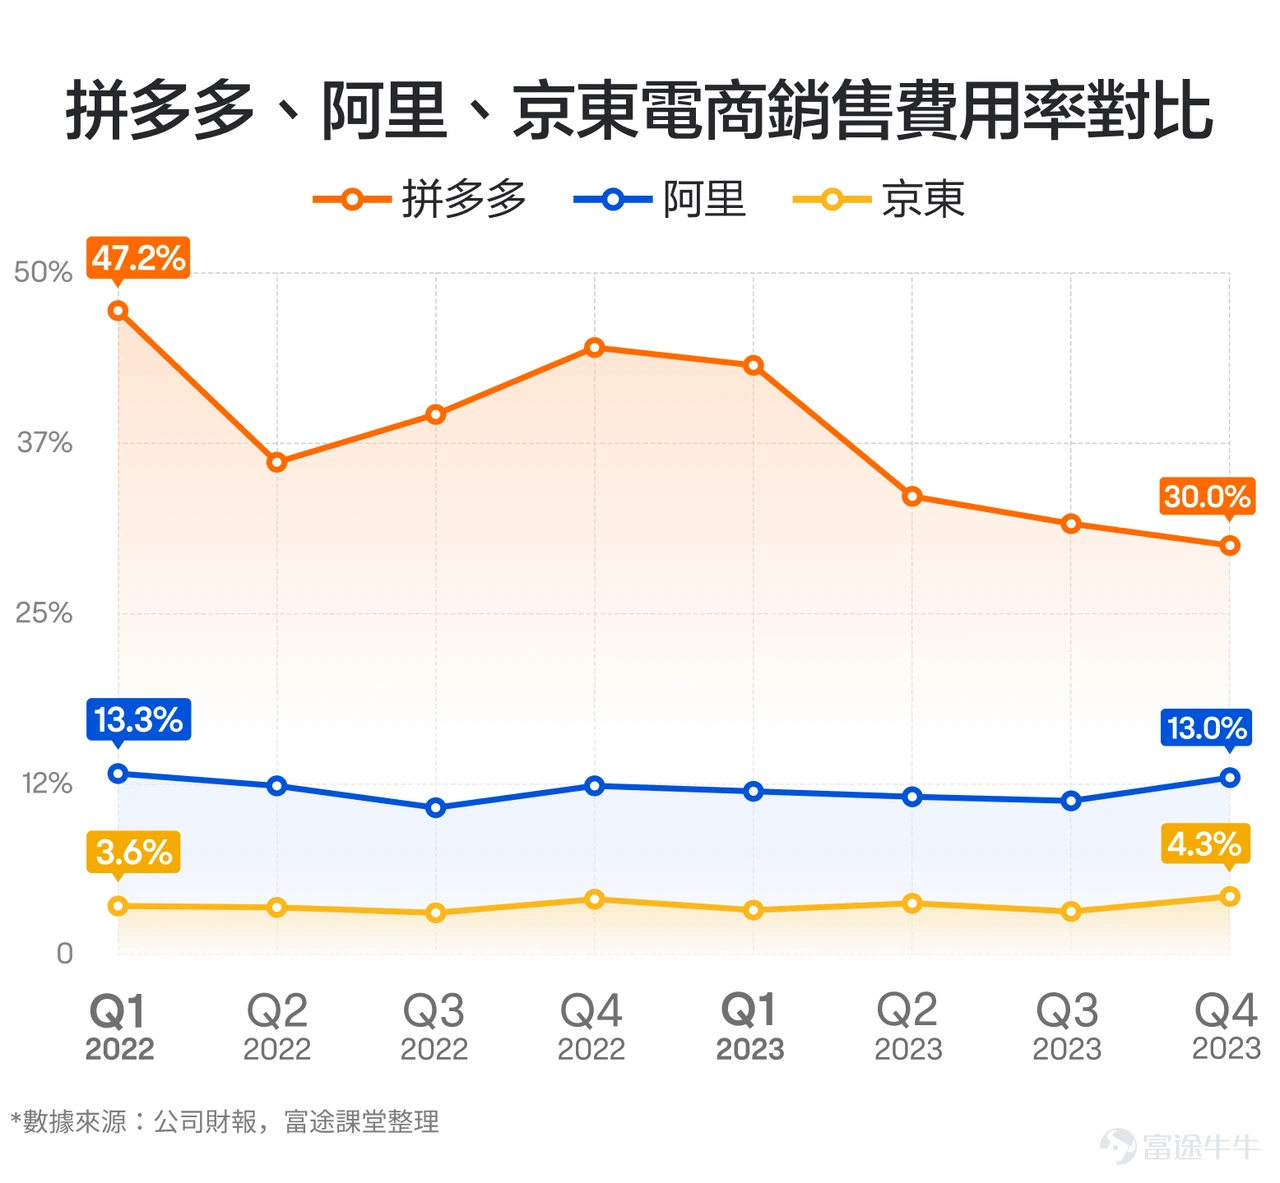
Next, let's compare the sales expense ratios of the three companies. If this indicator tends to rise, the company may be at a disadvantage in competition. If it keeps decreasing, the competitive position may be optimized.
In the two-year period from 2022 to 2023,$PDD Holdings (PDD.US)$they rose by 40% and 79%, respectively, with a total increase of 151% over the two years. The stock price also once returned to nearly two-thirds of its highest point. In the overall decline of Chinese concept stocks, this performance can be said to be extremely rare. By contrast,$Alibaba (BABA.US)$there was a 34% decline during the same period, and the stock price was only one-fourth of its highest point.$JD.com (JD.US)$It dropped by 57% and the stock price was also only a little over one-fourth of the previous high. On one hand, there was a substantial increase, on the other hand, there was a dramatic decline. Under the two extremes, by the end of November 2023, the market cap of PDD Holdings surpassed that of Alibaba, becoming the largest domestic e-commerce platform in terms of market cap. In the following months, the market caps of the two companies alternated, and it was no longer the situation where one company dominated as it did in the past. In the environment of weak consumer confidence, PDD Holdings has achieved a comeback in the highly competitive e-commerce industry. So, can PDD Holdings continue to maintain its leading advantage? We can grasp three key points by looking at its performance:Changes in performance growth rate, changes in profitability, and a comparison of actual performance with expectations.. 1. Changes in performance growth rate For PDD Holdings' performance growth rate, we can look at two points, including the change in its own performance growth rate and the comparison with peers in the e-commerce industry. The most intuitive manifestation of PDD's rise against the trend is reflected in its high revenue growth.From Q1 2022 to Q4 2023, PDD's...
We can see that since the first quarter of 2022, although PDD's sales expense ratio has experienced seasonal fluctuations due to activities such as 618 and Double 11, the overall trend is downward, decreasing from 47.2% in 2022Q1 to 30% in 2023Q4. Alibaba's sales expense ratio fluctuates around 10-13% overall. JD.com's sales expense ratio has remained stable, with a slight decrease.
For future performance, it may be difficult to expect PDD to continue to maintain double-digit growth, or even achieve stable growth of more than 30%. After all, the explosive growth of Temu's international business still needs further observation.
What we need to pay more attention to is how long PDD's revenue growth can continue to outperform its peers by a large margin, and whether PDD's sales expense ratio can maintain a stable or downward trend.This determines whether PDD can continue to maintain its relative competitiveness among its peers.
2. Changes in profitability
The second focus point for PDD's performance is the changes in profitability.Mainly including gross margin and net profit margin.
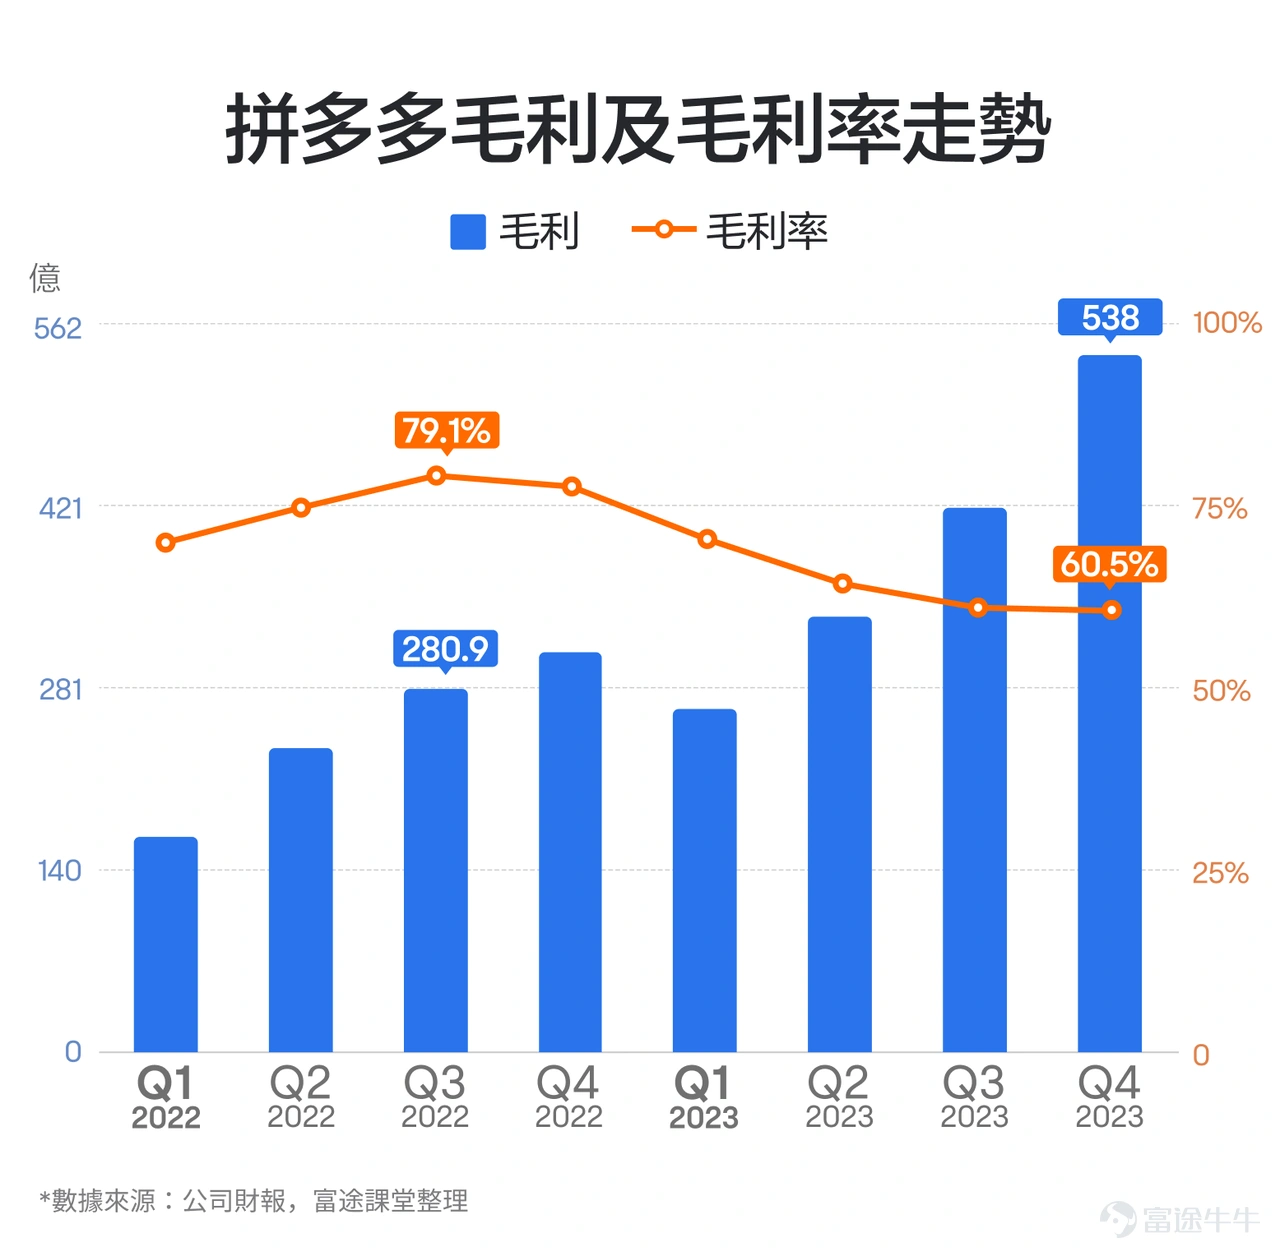
Looking at the gross margin,PDD's gross margin level has shown a trend of first rising and then falling since the first quarter of 2022. The previous increase was largely due to the economies of scale brought by rapid revenue growth. However, starting from the third quarter of 2022, PDD's gross margin has been decreasing quarter by quarter, dropping from 79.1% all the way to 60.5%, a total decrease of 18 percentage points.
In the two-year period from 2022 to 2023,$PDD Holdings (PDD.US)$they rose by 40% and 79%, respectively, with a total increase of 151% over the two years. The stock price also once returned to nearly two-thirds of its highest point. In the overall decline of Chinese concept stocks, this performance can be said to be extremely rare. By contrast,$Alibaba (BABA.US)$there was a 34% decline during the same period, and the stock price was only one-fourth of its highest point.$JD.com (JD.US)$It dropped by 57% and the stock price was also only a little over one-fourth of the previous high. On one hand, there was a substantial increase, on the other hand, there was a dramatic decline. Under the two extremes, by the end of November 2023, the market cap of PDD Holdings surpassed that of Alibaba, becoming the largest domestic e-commerce platform in terms of market cap. In the following months, the market caps of the two companies alternated, and it was no longer the situation where one company dominated as it did in the past. In the environment of weak consumer confidence, PDD Holdings has achieved a comeback in the highly competitive e-commerce industry. So, can PDD Holdings continue to maintain its leading advantage? We can grasp three key points by looking at its performance:Changes in performance growth rate, changes in profitability, and a comparison of actual performance with expectations.. 1. Changes in performance growth rate For PDD Holdings' performance growth rate, we can look at two points, including the change in its own performance growth rate and the comparison with peers in the e-commerce industry. The most intuitive manifestation of PDD's rise against the trend is reflected in its high revenue growth.From Q1 2022 to Q4 2023, PDD's...
The reason for the decline in PDD's gross margin is not that the existing domestic business is no longer profitable. It is mainly due to the strong promotion of the international business launched in the fourth quarter of 2022, Temu, and the need for massive subsidies to users in the early rapid expansion of the Duoduo Mai Cai business launched in recent years.
The various business sectors of PDD do not disclose their revenue and profit performance separately, but from a business perspective, the gross margin of this business is most likely negative. It doesn't increase profits in the early stages of development, which lowers the overall gross margin performance.
However, in terms of gross margin, PDD still has two aspects worth paying attention to. First, the overall change in gross margin. We can see that while the gross margin ratio is declining, PDD's gross margin level is still growing. In 2023 Q4, the gross margin is 53.8 billion, a year-on-year increase of 74.2%.
At the same time, we can also pay attention to the marginal improvement in the decline of the gross margin ratio. We can see that in the four quarters of 2023, the decline in PDD's gross margin ratio is: 7.1, 6.2, 3.2, and 0.5 percentage points, and the overall decline is narrowing.If the decline continues to narrow or even starts to rebound, it may indicate an improvement in the potential loss situation of the Temu business or the Duoduo Grocery business, and even achieve a turnaround from loss to profit.
Looking at the net profit margin,PDD also shows an increase in net profit levels, but with an overall decline in net profit margin. The main reason for the decline in PDD's net profit margin is, of course, the significant decline in gross margin. However, we can also see that the decline in PDD's net profit margin is much lower than the decrease in gross margin. By 2023 Q4, PDD's net profit margin reached about 26.2%, showing a rebound both year-on-year and quarter-on-quarter.
In the two-year period from 2022 to 2023,$PDD Holdings (PDD.US)$they rose by 40% and 79%, respectively, with a total increase of 151% over the two years. The stock price also once returned to nearly two-thirds of its highest point. In the overall decline of Chinese concept stocks, this performance can be said to be extremely rare. By contrast,$Alibaba (BABA.US)$there was a 34% decline during the same period, and the stock price was only one-fourth of its highest point.$JD.com (JD.US)$It dropped by 57% and the stock price was also only a little over one-fourth of the previous high. On one hand, there was a substantial increase, on the other hand, there was a dramatic decline. Under the two extremes, by the end of November 2023, the market cap of PDD Holdings surpassed that of Alibaba, becoming the largest domestic e-commerce platform in terms of market cap. In the following months, the market caps of the two companies alternated, and it was no longer the situation where one company dominated as it did in the past. In the environment of weak consumer confidence, PDD Holdings has achieved a comeback in the highly competitive e-commerce industry. So, can PDD Holdings continue to maintain its leading advantage? We can grasp three key points by looking at its performance:Changes in performance growth rate, changes in profitability, and a comparison of actual performance with expectations.. 1. Changes in performance growth rate For PDD Holdings' performance growth rate, we can look at two points, including the change in its own performance growth rate and the comparison with peers in the e-commerce industry. The most intuitive manifestation of PDD's rise against the trend is reflected in its high revenue growth.From Q1 2022 to Q4 2023, PDD's...
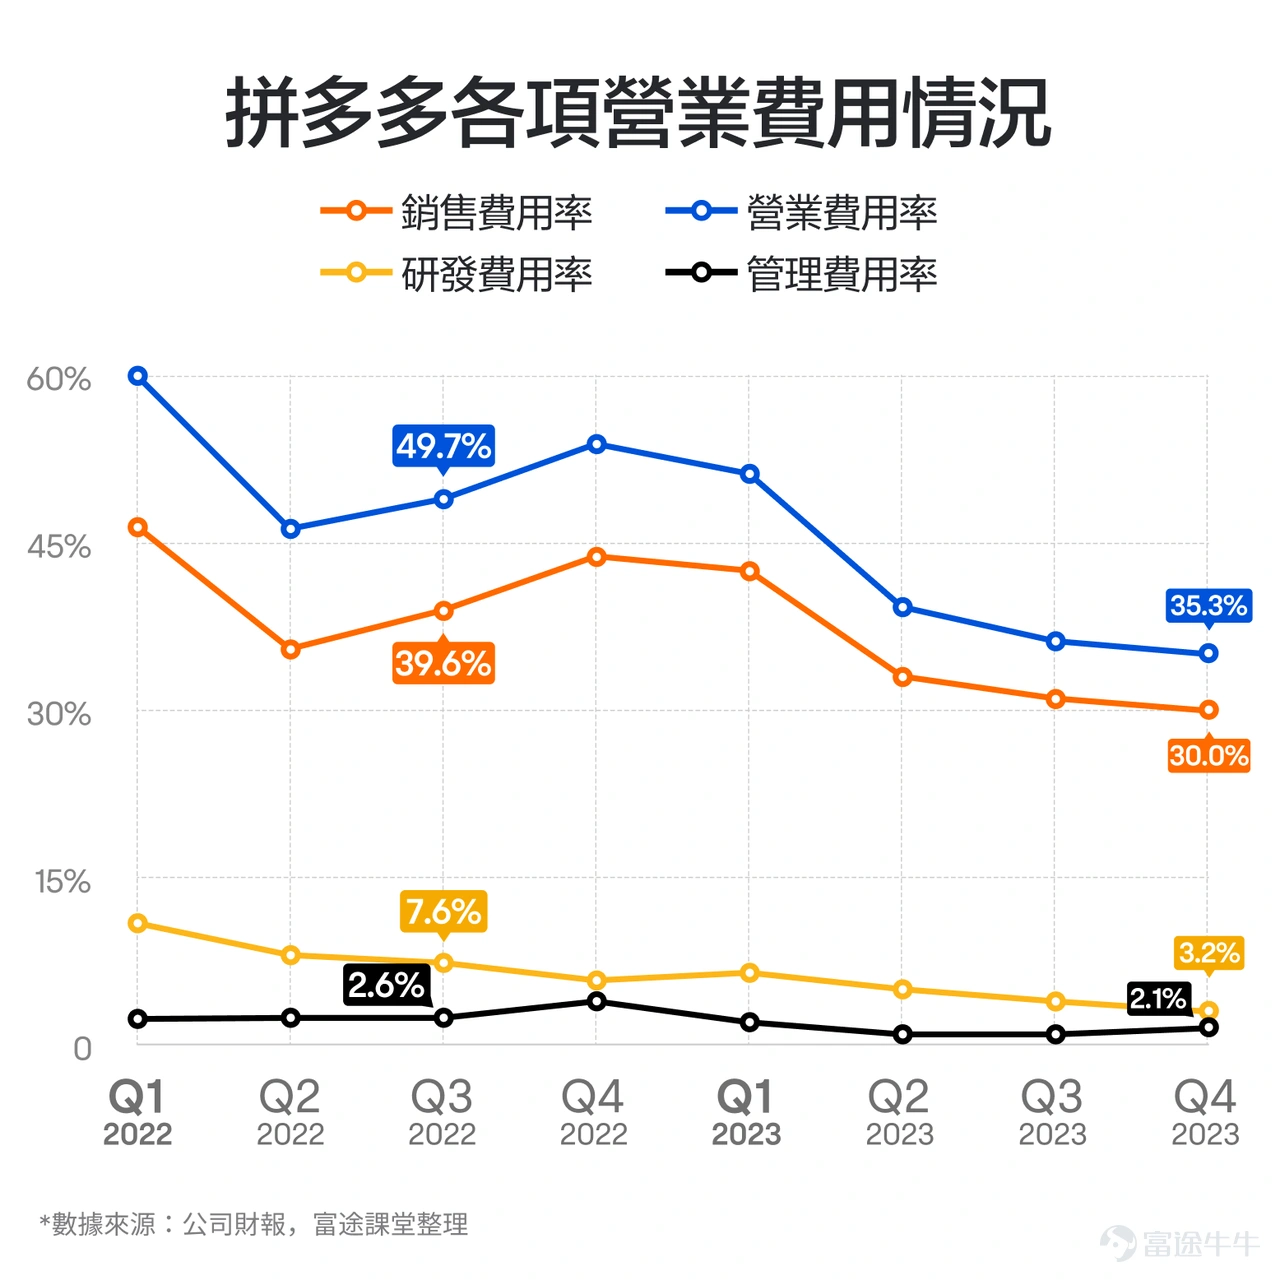
This is mainly due to PDD's control over operating expenses. PDD's sales expense ratio decreased from 39.6% in 2022 Q3 to 30% in 2023 Q4, R&D expense ratio decreased from 7.6% to 3.2%, and management expense ratio decreased from 2.6% to 2.1%. The overall operating expense ratio decreased from 49.7% to 35.3%, partially offsetting the impact of the gross margin decline on net profit margin.
In the two-year period from 2022 to 2023,$PDD Holdings (PDD.US)$they rose by 40% and 79%, respectively, with a total increase of 151% over the two years. The stock price also once returned to nearly two-thirds of its highest point. In the overall decline of Chinese concept stocks, this performance can be said to be extremely rare. By contrast,$Alibaba (BABA.US)$there was a 34% decline during the same period, and the stock price was only one-fourth of its highest point.$JD.com (JD.US)$It dropped by 57% and the stock price was also only a little over one-fourth of the previous high. On one hand, there was a substantial increase, on the other hand, there was a dramatic decline. Under the two extremes, by the end of November 2023, the market cap of PDD Holdings surpassed that of Alibaba, becoming the largest domestic e-commerce platform in terms of market cap. In the following months, the market caps of the two companies alternated, and it was no longer the situation where one company dominated as it did in the past. In the environment of weak consumer confidence, PDD Holdings has achieved a comeback in the highly competitive e-commerce industry. So, can PDD Holdings continue to maintain its leading advantage? We can grasp three key points by looking at its performance:Changes in performance growth rate, changes in profitability, and a comparison of actual performance with expectations.. 1. Changes in performance growth rate For PDD Holdings' performance growth rate, we can look at two points, including the change in its own performance growth rate and the comparison with peers in the e-commerce industry. The most intuitive manifestation of PDD's rise against the trend is reflected in its high revenue growth.From Q1 2022 to Q4 2023, PDD's...
The decline in operating expenses is largely a reflection of PDD's continuous improvement in operational efficiency, which is a significant competitive advantage in the increasingly intense e-commerce industry. Going forward, we can continue to monitor PDD's operating expense ratio and the impact it has on net profit margin.
3. Comparison of actual performance with performance expectations.
Since PDD's revenue is disclosed in a consolidated manner without specific breakdown by business segments, and the company's management rarely synchronizes operational data with the outside world prior to the release of financial results, PDD's performance flexibility could be very large. Each time the actual performance released may have a significant deviation from the performance expectations of Wall Street analysts, resulting in potentially large fluctuations in PDD's stock price after the performance announcement.
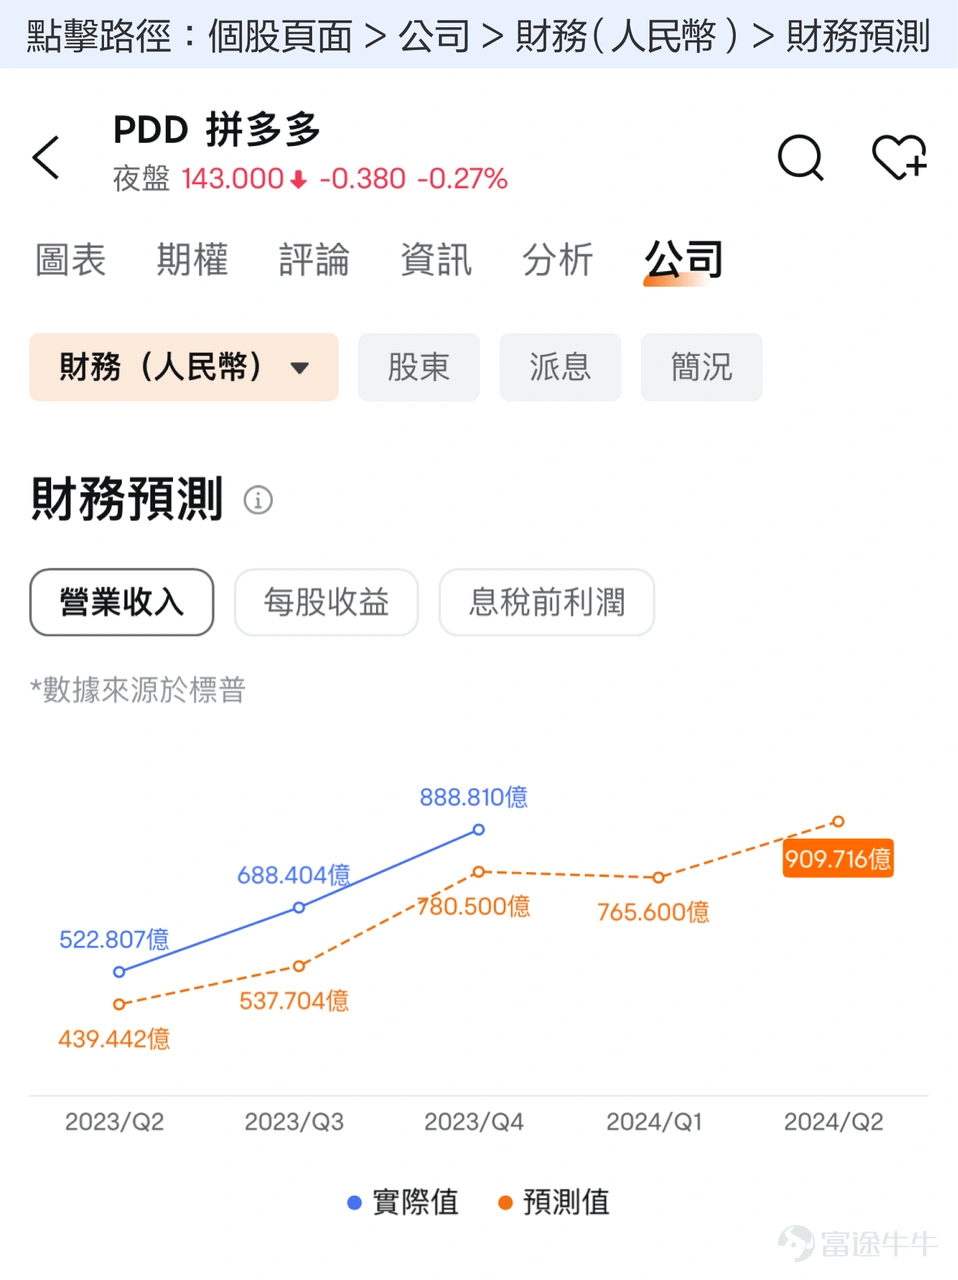
On the Futubull app, we can see the comparison between PDD's performance forecast and actual performance. Taking the latest four quarters' performance as an example, PDD has exceeded expectations significantly for four consecutive times, and its stock price has experienced short-term increases after each performance release. With such outstanding performances in the past, the market may have even higher expectations for PDD's new performance.
In the two-year period from 2022 to 2023,$PDD Holdings (PDD.US)$they rose by 40% and 79%, respectively, with a total increase of 151% over the two years. The stock price also once returned to nearly two-thirds of its highest point. In the overall decline of Chinese concept stocks, this performance can be said to be extremely rare. By contrast,$Alibaba (BABA.US)$there was a 34% decline during the same period, and the stock price was only one-fourth of its highest point.$JD.com (JD.US)$It dropped by 57% and the stock price was also only a little over one-fourth of the previous high. On one hand, there was a substantial increase, on the other hand, there was a dramatic decline. Under the two extremes, by the end of November 2023, the market cap of PDD Holdings surpassed that of Alibaba, becoming the largest domestic e-commerce platform in terms of market cap. In the following months, the market caps of the two companies alternated, and it was no longer the situation where one company dominated as it did in the past. In the environment of weak consumer confidence, PDD Holdings has achieved a comeback in the highly competitive e-commerce industry. So, can PDD Holdings continue to maintain its leading advantage? We can grasp three key points by looking at its performance:Changes in performance growth rate, changes in profitability, and a comparison of actual performance with expectations.. 1. Changes in performance growth rate For PDD Holdings' performance growth rate, we can look at two points, including the change in its own performance growth rate and the comparison with peers in the e-commerce industry. The most intuitive manifestation of PDD's rise against the trend is reflected in its high revenue growth.From Q1 2022 to Q4 2023, PDD's...
For revenue, according to the Futubull app, analysts' forecast for PDD's Q1 2024 revenue is 76.56 billion.If the actual performance exceeds this forecast by a large margin, it could be a significant bullish signal for the short-term stock price. Conversely, if the actual performance falls below expectations, it could be a bearish signal in the short term.
So what if PDD's performance exactly meets expectations? It may still be considered somewhat bearish because PDD has already exceeded expectations for four consecutive times. To further boost the stock price, just being satisfactory is not enough, it may require outstanding performance.
With this, you may have some new insights on how to interpret PDD's performance. It is worth noting that for many high-profile companies, each performance release could mean a rare trading opportunity for different types of investors.
For example, if an investor interprets the company's past performance and combines it with the latest developments,they may consider going long if they believe that a company's latest performance will release some positive signals and be beneficial for short-term stock prices.The ways to go long can be considering buying stocks or considering buying call options, etc.
On the other hand,if an investor believes that a company's latest performance will not be optimistic and will put pressure on short-term stock prices,they may consider going short, which can include considering short selling with margin or considering buying put options, etc.
Of course,If an investor finds the direction of a company's performance uncertain, but expects a significant upward or downward volatility in stock prices after the performance announcement,Consider implementing a straddle strategy by simultaneously buying call options and put options to seize potential opportunities.
In conclusion,
In terms of performance growth, PDD Holdings' revenue growth significantly surpasses its peers, while the sales expense ratio tends to decrease, demonstrating the company's continuous enhancement of competitiveness in the industry. Going forward, we can observe whether the company can sustain this trend.
In terms of profitability, PDD Holdings' gross margin has declined significantly due to money-burning businesses like Temu, while the operating expense ratio has improved significantly, and the net profit margin has slightly decreased. In the future, we can focus on the marginal improvement of the company's gross margin, as well as its ability to sustain higher operational efficiency, thereby improving the net profit margin.
In terms of performance expectations, PDD Holdings has greater performance flexibility. We can monitor the actual performance against the performance expectations. If it significantly exceeds expectations, it may have a positive impact on the stock price.
Whenever the company releases its performance reports, it may bring potential trading opportunities. Investors can consider suitable types of trades based on their personal risk tolerance.
In the two-year period from 2022 to 2023,$PDD Holdings (PDD.US)$they rose by 40% and 79%, respectively, with a total increase of 151% over the two years. The stock price also once returned to nearly two-thirds of its highest point. In the overall decline of Chinese concept stocks, this performance can be said to be extremely rare. By contrast,$Alibaba (BABA.US)$there was a 34% decline during the same period, and the stock price was only one-fourth of its highest point.$JD.com (JD.US)$It dropped by 57% and the stock price was also only a little over one-fourth of the previous high. On one hand, there was a substantial increase, on the other hand, there was a dramatic decline. Under the two extremes, by the end of November 2023, the market cap of PDD Holdings surpassed that of Alibaba, becoming the largest domestic e-commerce platform in terms of market cap. In the following months, the market caps of the two companies alternated, and it was no longer the situation where one company dominated as it did in the past. In the environment of weak consumer confidence, PDD Holdings has achieved a comeback in the highly competitive e-commerce industry. So, can PDD Holdings continue to maintain its leading advantage? We can grasp three key points by looking at its performance:Changes in performance growth rate, changes in profitability, and a comparison of actual performance with expectations.. 1. Changes in performance growth rate For PDD Holdings' performance growth rate, we can look at two points, including the change in its own performance growth rate and the comparison with peers in the e-commerce industry. The most intuitive manifestation of PDD's rise against the trend is reflected in its high revenue growth.From Q1 2022 to Q4 2023, PDD's...
Lastly, we have a small benefit, giving you a $200 value additional card to start your investment plan! Stack with the newcomer reward to get up to $2000 in rewards.Right away!
*Target audience: Limited to invited existing users who are over 18 years old, registered in the Hong Kong region with the Futu app but have not yet opened a securities account.
Risk Disclaimer: The above content only represents the author's view. It does not represent any position or investment advice of Futu. Futu makes no representation or warranty.Read more
Lol
2
Thumbs Up
17
Respect
1
Sob
1
Heart
1
117K Views
Report
Comments (5)
Write a Comment...
5
22
22