
標普納指保持漲勢,你是多頭還是空軍?

[Technical Market Analysis] Staged pullback in the US stock market, is it a harbinger of a major market adjustment? Share viewpoints to earn points.
The three major US stock indices consecutively decline,$Dow Jones Industrial Average (.DJI.US)$Ending a 6-day downtrend,$Nasdaq Composite Index (.IXIC.US)$Repeatedly leaning towards softness.
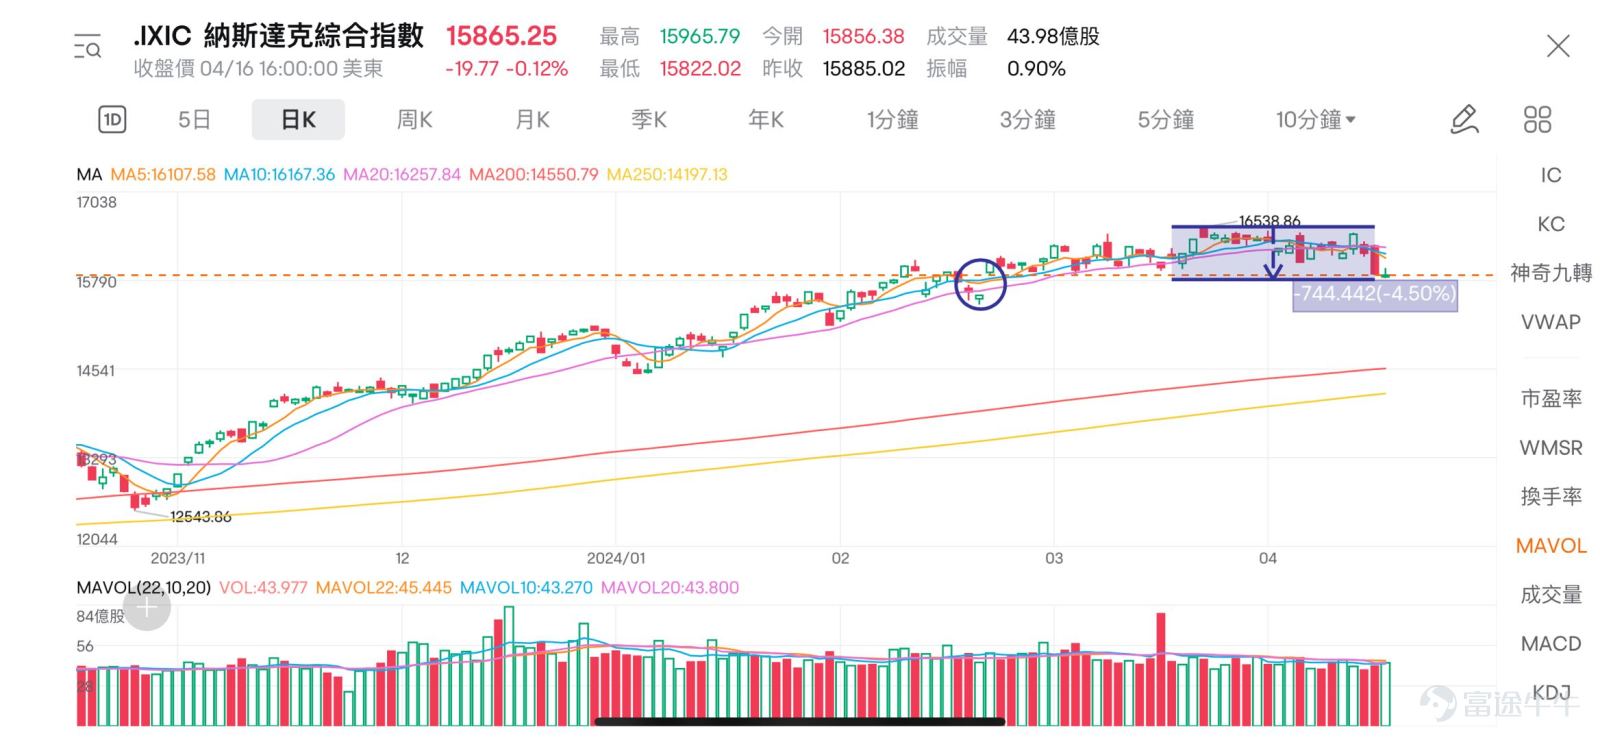
從技術走勢上看,美股三大指數日線趨勢,均線都發出空頭排列信號(MA5<MA10<MA20)。特別是納指4月15日,一根大陰燭倒插回落Close前期裂口位(15583.68—15869.24),後續這個裂口位是否會補返?月線趨勢,又是否會真正走出M頂形態?
![The three major US stock indices consecutively declined,$Dow Jones Industrial Average (.DJI.US)$ending a 6-day decline,$Nasdaq Composite Index (.IXIC.US)$showing repeated softness. From a technical perspective, the daily trends of the three major US stock indices show a bearish arrangement of moving averages (MA5 < MA10 < MA20).Especially on April 15th, the NASDAQ Composite Index witnessed a singlered candle.Large cap candlestick reversalClosePrevious period crack position (15583.68-15869.24)Will this crack position be filled later? Monthly trend, will it truly break out of the M-top pattern? Compared to gold in the same period,$XAU/USD (XAUUSD.CFD)$Has reached a historical high. Many mooers have also joined the anti-inflation team, making a lot of profit. Technical bulls also discussed the price trend in early March.[Share Link: Discussing the gold price trend in early March]。 So, what is the adjustment of this round of US stocks all about?Is it a staged pullback, or a precursor to a large cap adjustment? How do you see the future market? Let's gather to observe the investment ideas of mooers together[Give Me A Like]~ 【Mooer Talks Technical Analysis】 @CowCow3 —— Is the US stock market about to plunge? It is crucial to observe the volume and price situation in May and June! @IM SY——Is the large cap market dragged down by heavyweight stocks? The range of this pullback can be predicted based on historical data. @美股保安谷哥—— Timing to reduce positions? Analyzing the quick decline in the market trend after a slow rise! @速阻流——Nasdaq enters a frightening...](https://nnqimage.futunn.com/sns_client_feed/999991/20240417/1713346194656-5f84e26f71.jpeg/big?area=2&is_public=true&imageMogr2/ignore-error/1/format/webp)
相比同期黃金,$XAU/USD (XAUUSD.CFD)$Has reached a historical high. Many mooers have also joined the anti-inflation team, earning money with pride. Technical experts have alsodiscussed the trend of gold prices in early March.。
So, this round of adjustment in the US stock market, is ita temporary pullback, or a precursor to a large cap adjustment? How do you see the future market? Let's take a look at the investment ideas of mooers together. ~
~
~【Mooer Talks Tech】
@CowCow3 —— Is the US stock market about to experience a major decline? Keep a close eye on the volume and price situation in May and June!
![The three major US stock indices consecutively declined,$Dow Jones Industrial Average (.DJI.US)$ending a 6-day decline,$Nasdaq Composite Index (.IXIC.US)$showing repeated softness. From a technical perspective, the daily trends of the three major US stock indices show a bearish arrangement of moving averages (MA5 < MA10 < MA20).Especially on April 15th, the NASDAQ Composite Index witnessed a singlered candle.Large cap candlestick reversalClosePrevious period crack position (15583.68-15869.24)Will this crack position be filled later? Monthly trend, will it truly break out of the M-top pattern? Compared to gold in the same period,$XAU/USD (XAUUSD.CFD)$Has reached a historical high. Many mooers have also joined the anti-inflation team, making a lot of profit. Technical bulls also discussed the price trend in early March.[Share Link: Discussing the gold price trend in early March]。 So, what is the adjustment of this round of US stocks all about?Is it a staged pullback, or a precursor to a large cap adjustment? How do you see the future market? Let's gather to observe the investment ideas of mooers together[Give Me A Like]~ 【Mooer Talks Technical Analysis】 @CowCow3 —— Is the US stock market about to plunge? It is crucial to observe the volume and price situation in May and June! @IM SY——Is the large cap market dragged down by heavyweight stocks? The range of this pullback can be predicted based on historical data. @美股保安谷哥—— Timing to reduce positions? Analyzing the quick decline in the market trend after a slow rise! @速阻流——Nasdaq enters a frightening...](https://nnqimage.futunn.com/sns_client_feed/999991/20240417/1713340880218-f532103e03.jpeg/big?area=2&is_public=true&imageMogr2/ignore-error/1/format/webp)
@IM SY——Is the large cap being dragged down by heavyweight stocks? You can predict the range of this pullback based on historical data.
![The three major US stock indices consecutively declined,$Dow Jones Industrial Average (.DJI.US)$ending a 6-day decline,$Nasdaq Composite Index (.IXIC.US)$showing repeated softness. From a technical perspective, the daily trends of the three major US stock indices show a bearish arrangement of moving averages (MA5 < MA10 < MA20).Especially on April 15th, the NASDAQ Composite Index witnessed a singlered candle.Large cap candlestick reversalClosePrevious period crack position (15583.68-15869.24)Will this crack position be filled later? Monthly trend, will it truly break out of the M-top pattern? Compared to gold in the same period,$XAU/USD (XAUUSD.CFD)$Has reached a historical high. Many mooers have also joined the anti-inflation team, making a lot of profit. Technical bulls also discussed the price trend in early March.[Share Link: Discussing the gold price trend in early March]。 So, what is the adjustment of this round of US stocks all about?Is it a staged pullback, or a precursor to a large cap adjustment? How do you see the future market? Let's gather to observe the investment ideas of mooers together[Give Me A Like]~ 【Mooer Talks Technical Analysis】 @CowCow3 —— Is the US stock market about to plunge? It is crucial to observe the volume and price situation in May and June! @IM SY——Is the large cap market dragged down by heavyweight stocks? The range of this pullback can be predicted based on historical data. @美股保安谷哥—— Timing to reduce positions? Analyzing the quick decline in the market trend after a slow rise! @速阻流——Nasdaq enters a frightening...](https://nnqimage.futunn.com/sns_client_feed/999991/20240418/1713410375354-8d11b41681.png/big?area=2&is_public=true&imageMogr2/ignore-error/1/format/webp)
@美股保安谷哥—— When is the right time to reduce positions? Analyze the sudden downturn in the market after a slow upward trend!
![The three major US stock indices consecutively declined,$Dow Jones Industrial Average (.DJI.US)$ending a 6-day decline,$Nasdaq Composite Index (.IXIC.US)$showing repeated softness. From a technical perspective, the daily trends of the three major US stock indices show a bearish arrangement of moving averages (MA5 < MA10 < MA20).Especially on April 15th, the NASDAQ Composite Index witnessed a singlered candle.Large cap candlestick reversalClosePrevious period crack position (15583.68-15869.24)Will this crack position be filled later? Monthly trend, will it truly break out of the M-top pattern? Compared to gold in the same period,$XAU/USD (XAUUSD.CFD)$Has reached a historical high. Many mooers have also joined the anti-inflation team, making a lot of profit. Technical bulls also discussed the price trend in early March.[Share Link: Discussing the gold price trend in early March]。 So, what is the adjustment of this round of US stocks all about?Is it a staged pullback, or a precursor to a large cap adjustment? How do you see the future market? Let's gather to observe the investment ideas of mooers together[Give Me A Like]~ 【Mooer Talks Technical Analysis】 @CowCow3 —— Is the US stock market about to plunge? It is crucial to observe the volume and price situation in May and June! @IM SY——Is the large cap market dragged down by heavyweight stocks? The range of this pullback can be predicted based on historical data. @美股保安谷哥—— Timing to reduce positions? Analyzing the quick decline in the market trend after a slow rise! @速阻流——Nasdaq enters a frightening...](https://nnqimage.futunn.com/sns_client_feed/999991/20240417/1713340812026-796a47e6cd.jpeg/big?area=2&is_public=true&imageMogr2/ignore-error/1/format/webp)
@速阻流——Is the Nasdaq entering a panic zone? Predict that this pullback will be in the form of repeated sideways movement.
![The three major US stock indices consecutively declined,$Dow Jones Industrial Average (.DJI.US)$ending a 6-day decline,$Nasdaq Composite Index (.IXIC.US)$showing repeated softness. From a technical perspective, the daily trends of the three major US stock indices show a bearish arrangement of moving averages (MA5 < MA10 < MA20).Especially on April 15th, the NASDAQ Composite Index witnessed a singlered candle.Large cap candlestick reversalClosePrevious period crack position (15583.68-15869.24)Will this crack position be filled later? Monthly trend, will it truly break out of the M-top pattern? Compared to gold in the same period,$XAU/USD (XAUUSD.CFD)$Has reached a historical high. Many mooers have also joined the anti-inflation team, making a lot of profit. Technical bulls also discussed the price trend in early March.[Share Link: Discussing the gold price trend in early March]。 So, what is the adjustment of this round of US stocks all about?Is it a staged pullback, or a precursor to a large cap adjustment? How do you see the future market? Let's gather to observe the investment ideas of mooers together[Give Me A Like]~ 【Mooer Talks Technical Analysis】 @CowCow3 —— Is the US stock market about to plunge? It is crucial to observe the volume and price situation in May and June! @IM SY——Is the large cap market dragged down by heavyweight stocks? The range of this pullback can be predicted based on historical data. @美股保安谷哥—— Timing to reduce positions? Analyzing the quick decline in the market trend after a slow rise! @速阻流——Nasdaq enters a frightening...](https://nnqimage.futunn.com/sns_client_feed/999991/20240417/1713340775302-cb6a949ea4.jpeg/big?area=2&is_public=true&imageMogr2/ignore-error/1/format/webp)
@大V天龍召喚者—— Is it risky to trade the Nasdaq Composite Index long currently? The possibility of 'upward for a long time' may reappear.
![The three major US stock indices consecutively declined,$Dow Jones Industrial Average (.DJI.US)$ending a 6-day decline,$Nasdaq Composite Index (.IXIC.US)$showing repeated softness. From a technical perspective, the daily trends of the three major US stock indices show a bearish arrangement of moving averages (MA5 < MA10 < MA20).Especially on April 15th, the NASDAQ Composite Index witnessed a singlered candle.Large cap candlestick reversalClosePrevious period crack position (15583.68-15869.24)Will this crack position be filled later? Monthly trend, will it truly break out of the M-top pattern? Compared to gold in the same period,$XAU/USD (XAUUSD.CFD)$Has reached a historical high. Many mooers have also joined the anti-inflation team, making a lot of profit. Technical bulls also discussed the price trend in early March.[Share Link: Discussing the gold price trend in early March]。 So, what is the adjustment of this round of US stocks all about?Is it a staged pullback, or a precursor to a large cap adjustment? How do you see the future market? Let's gather to observe the investment ideas of mooers together[Give Me A Like]~ 【Mooer Talks Technical Analysis】 @CowCow3 —— Is the US stock market about to plunge? It is crucial to observe the volume and price situation in May and June! @IM SY——Is the large cap market dragged down by heavyweight stocks? The range of this pullback can be predicted based on historical data. @美股保安谷哥—— Timing to reduce positions? Analyzing the quick decline in the market trend after a slow rise! @速阻流——Nasdaq enters a frightening...](https://nnqimage.futunn.com/sns_client_feed/999991/20240417/1713340853275-5b2f108fe4.jpeg/big?area=2&is_public=true&imageMogr2/ignore-error/1/format/webp)
Interactive Session
UseTechnical MethodsAnalysis of the future market of the three major U.S. stock indices, youWill it rise or fall??
Key support, where to look for the resistance level again?
How do you trade in a volatile market situation?
[Interactive Rewards]
Technical genius award:The 3 most exciting technical analysis For mooers, can get 188 points
Participate in the sharing award:Join the discussion(50 or more words)+Original post title Mooers can receive 66 points【Event Duration】
As of 24:00 on April 24, 2024.
【Technical Classroom】
The above article is more suitable for fragmented learning. If you want to learn more about technical analysis knowledge, please click:
Risk Disclaimer: The above content only represents the author's view. It does not represent any position or investment advice of Futu. Futu makes no representation or warranty.Read more


Comments (42)
to post a comment
57
23