台積電淨利潤超預期!後市你怎麼看?

【Investment Talk】What do you think of TSMC's financial statements? These three indicators you need to watch out for!
Semiconductor chip industry, known as the pearl of modern technology. TSMC is one of the key companies in the chip industry chain. As the leader of the global wafer broker, TSMC's performance has also fluctuated with the cycle of the global chip industry, and the company's stock price has also fluctuated enormously in recent years.
So, what do you think of TSMC's financial statements? And how to determine the position of its performance cycle? We focus on these metrics: revenue growth and gross margin, revenue structure, capital expenditure and cash flow.
1. Revenue growth and gross margin
For industries with a cyclical nature, changes in revenue growth, as well as changes in profitability, are important references for determining the direction of cyclical operations. When revenue growth continues to accelerate and profitability indicators such as gross margins continue to increase, it is essentially when the cyclical outlook is higher, and vice versa.
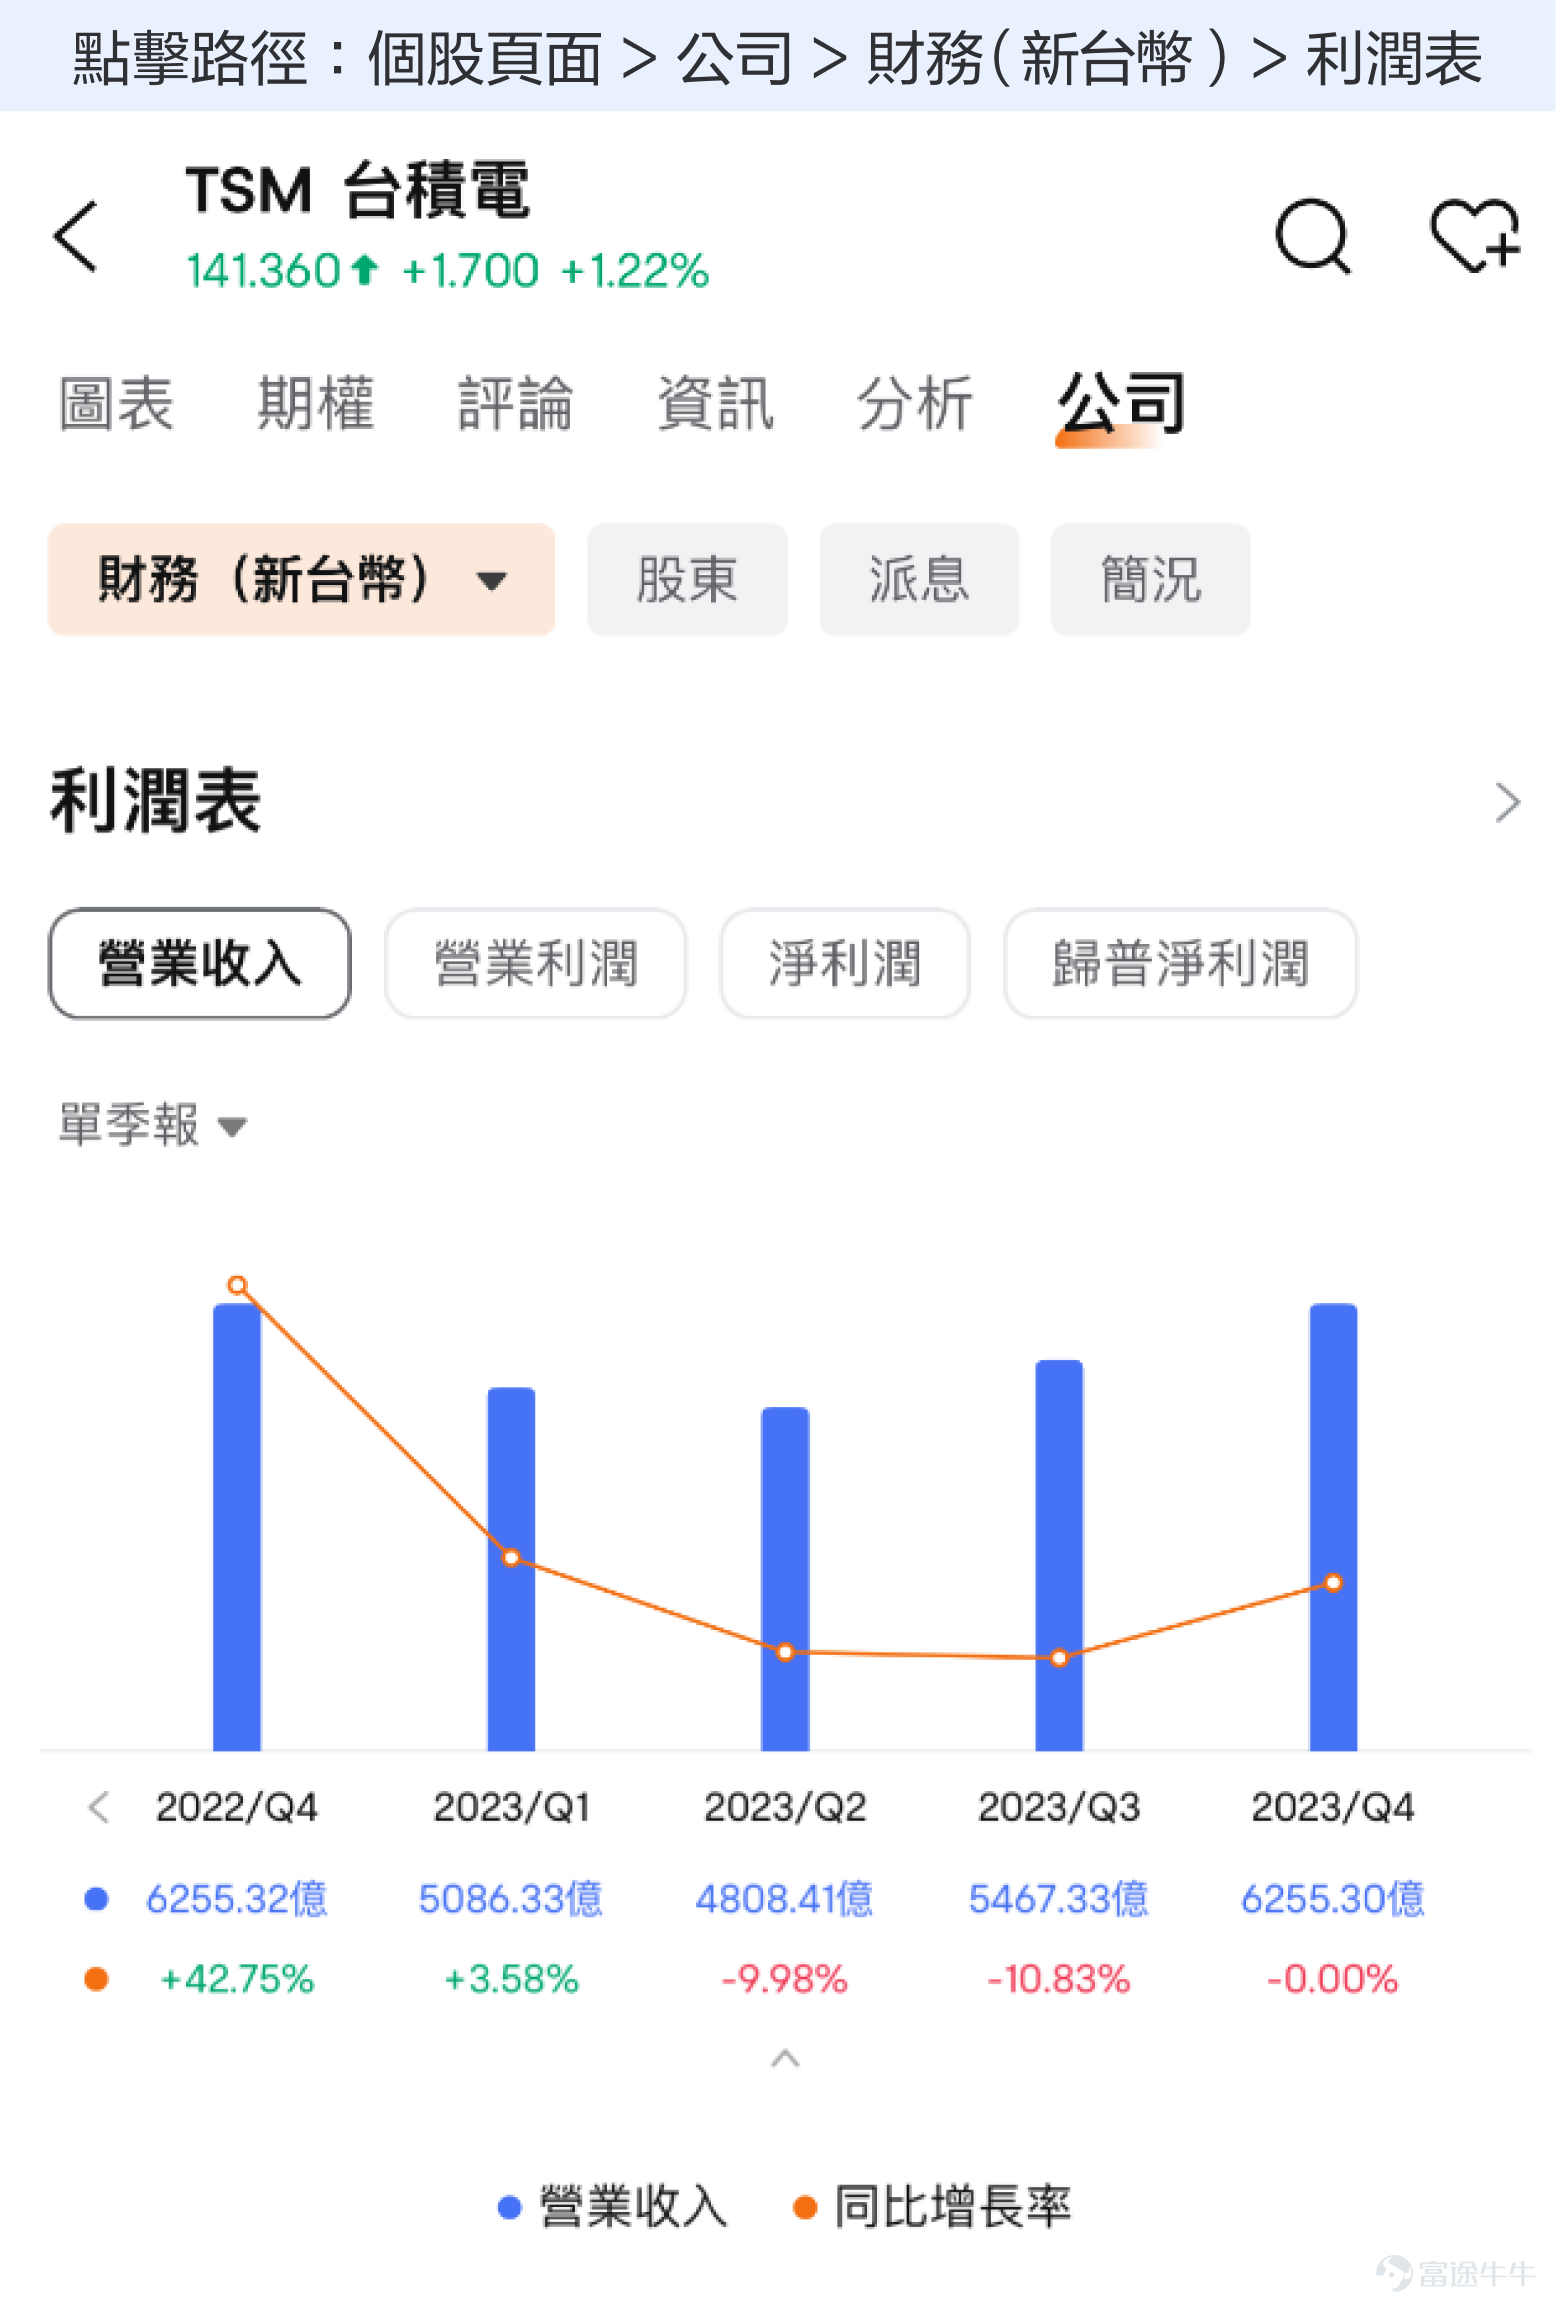
In terms of revenue growth, we saw TSMC's revenue decline for three consecutive quarters, finally falling in Q3 2023, growing by 10.2%, continuing to rebound in 2023Q4, growing 14.4% compared to the same period last year, but TSMC's revenue remained flat relative to the same period last year.

TSMC's revenue is calculated by product shipments multiplied by price. In Q4 2023, TSMC saw a rebound in both shipments and product prices, driving relative growth in revenue ratio. And rising prices may mean a continued warming of demand.
In terms of gross profit margin, TSMC's Q4 2023 gross margin was around 53%, continuing its downward path after a slight rebound in 2023Q3. This may be due to the impact of high depreciation expense driven by 3nm mass production.
Overall, TSMC's revenue growth for two consecutive quarters may mean that demand in the industry is heating up, but TSMC's gross profit margin has not stopped falling, driven by higher depreciation costs, but more so because demand explosiveness remains insufficient and has failed to drive its profitability back up, we can then Continue to observe revenue and gross margins to determine their cyclical warming.
2. Income structure
From an application perspective, TSMC's revenue structure is dominated by smartphones and high-performance computing, both of which account for around 80% of the company's revenue.

In Q4 2023, mobile phone revenue declined for two consecutive quarters, and revenue rose sharply from 33% in the second quarter to 43%, to some extent showing a warming in demand in the mobile phone market. Subsequently, we can continue to observe the change in demand cycles in the mobile phone market and the resulting impact on TSMC results.
From the point of view of chip processing technology, the revenue of TSMC can be divided into 7nm and above 7nm. Generally speaking, the lower the processing of chips and the more advanced the level of technology. TSMC is the world's most advanced wafer fabricator company, with most of its revenue coming from relatively advanced processes at 7nm and below.

In recent quarters, TSMC's revenue below 7nm was dominated by 5nm and 7nm, and gradually switched from 7nm processes to more advanced 5nm processes. By Q3 2023, TSMC 3nm technology began formal mass production, which also contributed about 6% of overall revenue, further increasing to 15% in Q4 2023。
In the coming quarters, with the release of new Apple devices and the introduction of the latest high-end models in the Android industry chain, revenue from TSMC's 3nm technology segment may be expected to further drive revenue growth.
3. Capital expenditure and cash flow
TSMC is the leader of the global wafer broker and a company whose market value is second only to that of the entire chip industry chain. Despite the industry's outstanding position, it also has its problems that it has to stay ahead of the technology. The chip replacement industry, driven by Moore's Law, is constantly moving towards more advanced process technologies. Once TSMC breaks loose, it is a backwater boat, never retreating, being outpaced by competitors such as Samsung Electronics in minutes.
Developing new technological processes, in addition to requiring R&D expenses, but also supporting new production line capacity, means that TSMC's capital expenditure remains relatively high. We see that from 2006-2023, the cumulative capital expenditure of TSMC amounted to NT$6.7 trillion, while the net profit for the same period was about 6 trillion, with capital expenditure even more than net profit. Because of this, the cumulative free cash flow of TSMC amounted to approximately 3.3 trillion million during the period, representing only about 60% of total net profit.

IN MANY VALUATION MODELS, FREE CASH FLOW IS A VERY IMPORTANT VALUATION INDICATOR. TSMC'S FREE CASH FLOW IS FAR BELOW NET PROFIT AND NEGATIVELY AFFECTS ITS VALUATION, THUS AFFECTING LONG-TERM SHARE PRICE PERFORMANCE.
So with this indicator of capital expenditure, in the short term, we can observe the attitude of the company itself towards the industry cycle. In general, a company may reduce capital expenditure if it determines the cycle goes down, and if the judgment cycle continues to run, it may continue to increase capital expenditure. In recent quarters, TSMC's capital expenditure has continued to decline, and we can continue to observe changes in the company's capital expenditure.

In the long run, TSMC's capital expenditure trends may be linked to technological trends in wafer manufacturing. If future Moore's law fails completely, chip processes lose room for improvement, and TSMC's capital expenditure growth may slow down. But by the time when TSMC enters, while competitors are slowly catching up, the competitive pressure intensifies, and while TSMC's cash flow has improved, gross margins may also fall, and then there will be another logic of competition and valuation.
4. Finally, summarize

Want to know more about the financial season?
If you would like to learn more about the financial season, please join our course“Star company earnings season Raiders”, learn more about the financial information of the company!#睇業績,用 Futubull
For more information Welcome to follow 👉 @牛牛課堂
Risk Disclaimer: The above content only represents the author's view. It does not represent any position or investment advice of Futu. Futu makes no representation or warranty.Read more


Comments
to post a comment
26
11