【Technical Challenges】Are you no longer counting on valuation? Find support resistance in one fell swoop! Answer the question to earn points
【Awarded】Tech Challenge, dare you! Welcome everyone Like  reviewsforwards Earn points~
reviewsforwards Earn points~Many adults get on the wrong car, buy at the drop, and sell at the beginning of the boom. The first step is to grip it easilyStock buying and selling points? The key is to observe the normSupport resistance level! That's right, this is the drawing board tool I've come to know this week — “Speed resistance”
【Basic Concepts】
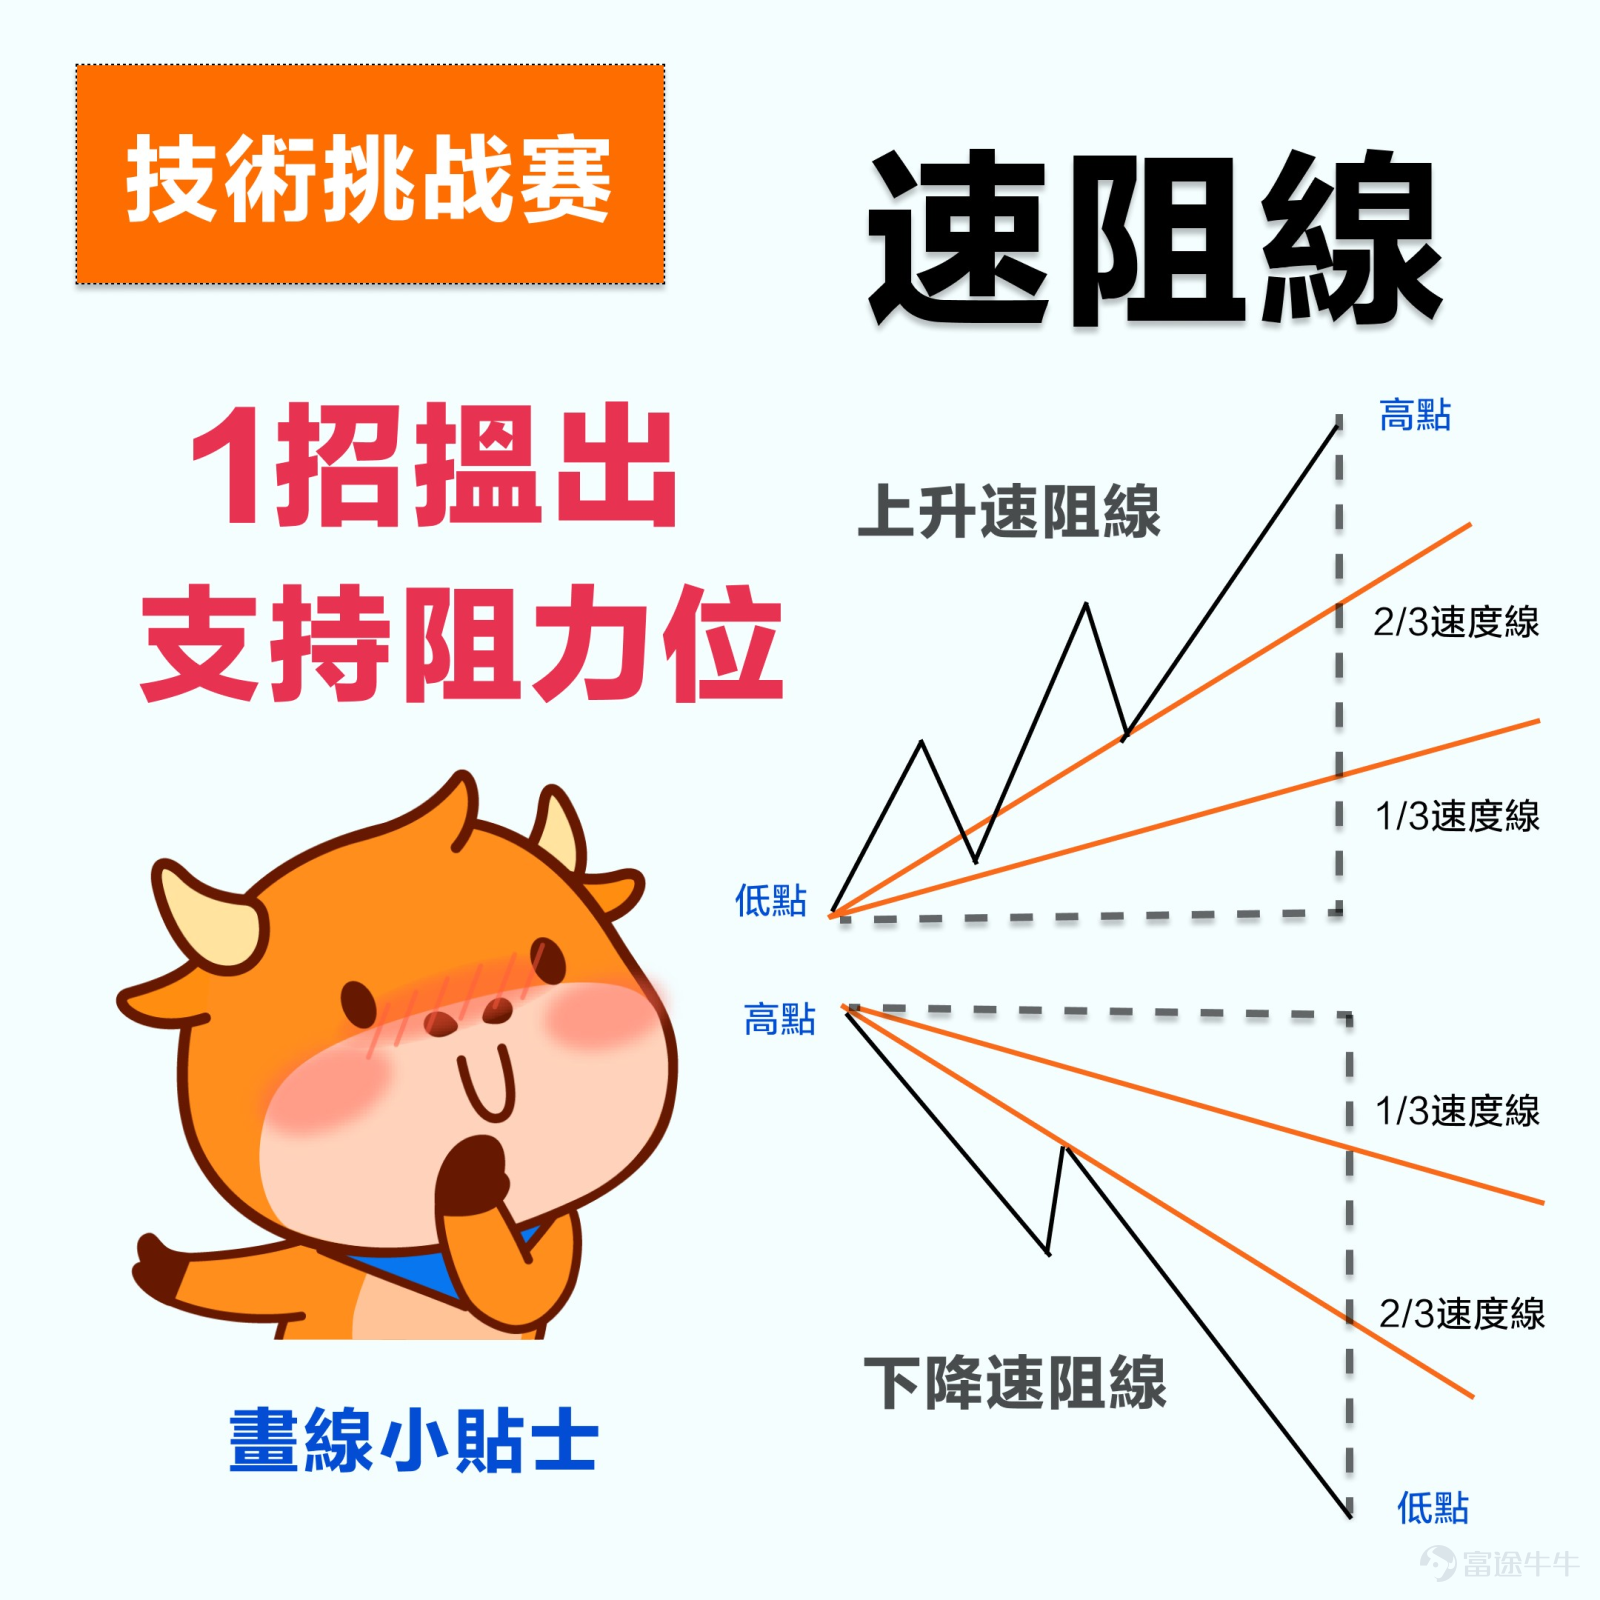
Speed resistance lines, also known as Speed Resistance Lines, are speed lines combined with trend lines and pullback percentages to determine stock price support and pressure levels.
![【Awarded】Tech Challenge, dare you! Welcome everyone Like [Heart]reviews[Microphone]forwards [+1] Earn points~ Many adults get on the wrong car, buy at the drop, and sell at the beginning of the boom. The first step is to grip it easilyStock buying and selling points? The key is to observe the normSupport resistance level! That's right, this is the drawing board tool I've come to know this week — “Speed resistance”[Cool Guy][Cool Guy] 【Basic Concepts】 Speed resistance lines, also known as Speed Resistance Lines, are speed lines combined with trend lines and pullback percentages to determine stock price support and pressure levels. [Drafting line/tap] The resistance line is a selected wave of motionlowswithhighs, then two resistance lines appear, one called 1/3 resistance line, one called 2/3 resistance line, often used to doBounce resistance level,Adjust the support levelReferences. Simply put, the trend is divided into 3 parts, and when the price starts to reverse, it often encounters support or resistance in these places in one-third and two-thirds. 【Hands-on Guide】 (1) Depending on the market price trend, it is divided into:Rise Speed Resistance Line(is a line extending from the bottom of the market to the upper right),Descent Speed Resistance Line(is a line extending from the top of the market to the lower right) (2) In a bullish trend, the benchmark retreats to1/3Speed LineAt that time, the trend may not have gone bad, and the benchmark may bounce back after a squat and continue to run along the original upward trend. (3) The flag is moving in a wave...](https://nnqimage.futunn.com/999991/editor_image/0e4a9e2db5e03fb29986b80c09cf4790.png/big?imageMogr2/ignore-error/1/format/webp)
[Drafting line/tap]
The resistance line is a selected wave of motionlowswithhighs, then two resistance lines appear, one called 1/3 resistance line, one called 2/3 resistance line, often used to doBounce resistance level,Adjust the support levelReferences. Simply put, the trend is divided into 3 parts, and when the price starts to reverse, it often encounters support or resistance in these places in one-third and two-thirds.
【Hands-on Guide】
(1) Depending on the market price trend, it is divided into:Rise Speed Resistance Line(is a line extending from the bottom of the market to the upper right),Descent Speed Resistance Line(is a line extending from the top of the market to the lower right)
(2) In a bullish trend, the benchmark retreats to1/3Speed LineAt that time, the trend may not have gone bad, and the benchmark may bounce back after a squat and continue to run along the original upward trend.
(3) In a bullish trend, the benchmark retreats to2/3Speed LineAt the moment, this is a very crucial point, and if the previous trend still wants to continue, the adjustment is best to stop at 2/3 of the resistance line. Once the level is broken downwards, the probability means that the trend of the previous wave is interrupted.
【Today's Challenge】
👏 👏 The orange line below is in the speed resistance area, most likely meaning
![【Awarded】Tech Challenge, dare you! Welcome everyone Like [Heart]reviews[Microphone]forwards [+1] Earn points~ Many adults get on the wrong car, buy at the drop, and sell at the beginning of the boom. The first step is to grip it easilyStock buying and selling points? The key is to observe the normSupport resistance level! That's right, this is the drawing board tool I've come to know this week — “Speed resistance”[Cool Guy][Cool Guy] 【Basic Concepts】 Speed resistance lines, also known as Speed Resistance Lines, are speed lines combined with trend lines and pullback percentages to determine stock price support and pressure levels. [Drafting line/tap] The resistance line is a selected wave of motionlowswithhighs, then two resistance lines appear, one called 1/3 resistance line, one called 2/3 resistance line, often used to doBounce resistance level,Adjust the support levelReferences. Simply put, the trend is divided into 3 parts, and when the price starts to reverse, it often encounters support or resistance in these places in one-third and two-thirds. 【Hands-on Guide】 (1) Depending on the market price trend, it is divided into:Rise Speed Resistance Line(is a line extending from the bottom of the market to the upper right),Descent Speed Resistance Line(is a line extending from the top of the market to the lower right) (2) In a bullish trend, the benchmark retreats to1/3Speed LineAt that time, the trend may not have gone bad, and the benchmark may bounce back after a squat and continue to run along the original upward trend. (3) The flag is moving in a wave...](https://nnqimage.futunn.com/999991/editor_image/4d4f05bdd78e3e4f91fafb3b4c935738.jpg/big?imageMogr2/ignore-error/1/format/webp)
A: Support position, pressure level
B: Pressure level, support position
The answer is correct and the answer is reasonable 6 students, you can get 66 pointsFutubull Picking 3 digits , SHARE SCREENSHOT DRAWINGS“Speed resistance”User, Submit 88 Points
(Deadline for answers: December 7)
[Drawing Line Tool Guide]
![【Awarded】Tech Challenge, dare you! Welcome everyone Like [Heart]reviews[Microphone]forwards [+1] Earn points~ Many adults get on the wrong car, buy at the drop, and sell at the beginning of the boom. The first step is to grip it easilyStock buying and selling points? The key is to observe the normSupport resistance level! That's right, this is the drawing board tool I've come to know this week — “Speed resistance”[Cool Guy][Cool Guy] 【Basic Concepts】 Speed resistance lines, also known as Speed Resistance Lines, are speed lines combined with trend lines and pullback percentages to determine stock price support and pressure levels. [Drafting line/tap] The resistance line is a selected wave of motionlowswithhighs, then two resistance lines appear, one called 1/3 resistance line, one called 2/3 resistance line, often used to doBounce resistance level,Adjust the support levelReferences. Simply put, the trend is divided into 3 parts, and when the price starts to reverse, it often encounters support or resistance in these places in one-third and two-thirds. 【Hands-on Guide】 (1) Depending on the market price trend, it is divided into:Rise Speed Resistance Line(is a line extending from the bottom of the market to the upper right),Descent Speed Resistance Line(is a line extending from the top of the market to the lower right) (2) In a bullish trend, the benchmark retreats to1/3Speed LineAt that time, the trend may not have gone bad, and the benchmark may bounce back after a squat and continue to run along the original upward trend. (3) The flag is moving in a wave...](https://nnqimage.futunn.com/999991/editor_image/a1d606297bee3b94add0baf579d8efe1.jpg/big?imageMogr2/ignore-error/1/format/webp)
【Risk Alert】
As a variation of the drawing line tool, point setting is a random process with limitations and fragility, this activity serves only as a way to help users understand technical analysis methods, not as any investment advice. The stock market is risky, so invest with caution!
Risk Disclaimer: The above content only represents the author's view. It does not represent any position or investment advice of Futu. Futu makes no representation or warranty.Read more


Comments (12)
to post a comment
31
17