
【產品推薦官】邊個牛牛功能最幫到你賺錢?
The “Play with the Futubull” article takes you to enjoy the financial flow Futubull Niu Niu
1. What is the flow of money?
Capital flow is an important indicator commonly used in technical analysis. The calculation method is that if stocks are traded at one price or higher, that is, active buying, it is defined as capital inflow; if stocks are traded at one price or lower, active selling is defined as capital outflow. The difference between capital inflows and capital outflows is the net outflow of capital.
2. What is the use of looking at the flow of capital?
1) Analyzing and predicting the future market by analyzing the willingness to trade long and short is of high reference significance for short-term operations.
Under normal circumstances, the direction of capital flow and stock price trends can be divided into four basic situations:
Stock prices are rising and capital inflows are net:The sale was actively digested, and purchases followed the rise, reflecting the stock's strong gains and is likely to continue to improve.
Stock prices rose but there was a net outflow of capital:There may be short positions or chips leaving the market, and holders may need to stay on the sidelines;
Stock prices fell and there was a net outflow of capital:Purchases are actively digested, and sales follow the decline, reflecting a bearish trend in the market;
Stock prices fell but there was a net inflow of capital:There may be new capital entering the market or bears taking the initiative to close positions, and there is an opportunity for a new upward wave.
*The trend of stock prices is affected by various factors. Investors should consider various other factors in a comprehensive manner while using capital inflows as a reference indicator.
2) On the other hand, by distinguishing between main capital and retail capital according to the size of a single transaction volume, it is possible to show the trend of institutional capital very well to investors.
3. How to use Futunniu to see the flow of capital?
Entrance: Individual Stock Detailed Quotation Page - Fund Tracking (Below In-depth Placement)
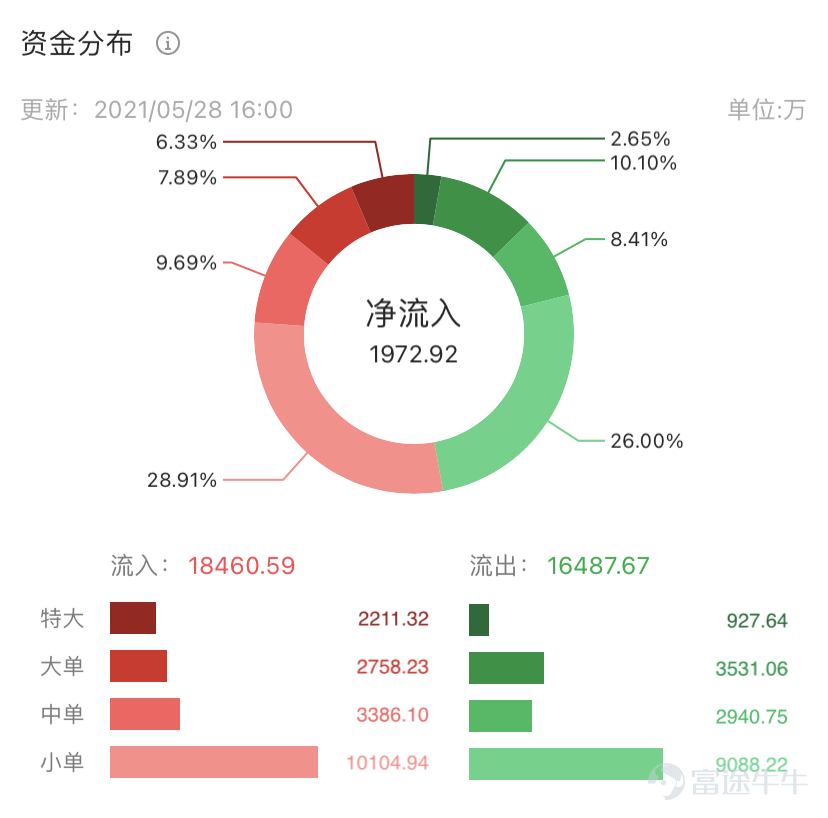
1) Capital distribution
The pie chart shows the ratio of large orders, large orders, medium orders, and small orders to the total turnover. The bar chart shows the inflow and outflow amounts of large orders, large orders, medium orders, and small orders.

The threshold values for extra large, large, medium, and small orders are divided in proportion, and the display is distinguished by the depth of color. In order of the transaction amount of the previous 200 days in order of history, the top 10% of capital orders were very large orders, the top 10%-30% were large orders, the 30%-5% range was the middle order, and the final 55%-100% range was a small order.
2) Real-time capital flow trends
Shows the changes in net capital flow for the day, including 5 curves: overall, large orders, medium orders, and small orders. Long press to bring up a cross-hair window showing the details of the funds for that minute.

3) Historical capital flows
You can view the net flow of funds by day, week, and month. Press and hold to reveal a cross-hair floating window showing the net flow amount and closing price.

4) Capital flow details
Click “Historical Data” in the upper right corner to view the daily flow details. You can swipe horizontally to view more fields.

If you have any experience or feedback on the use of the “Capital Flow” function, Niu Futubull very much welcomes you>> [Play around with Futubull] Grasp the flow of capital and discover major dynamics<<Post your opinion, we will read it carefully, and send out rewards such as credit processing for high-quality content~
Risk Disclaimer: The above content only represents the author's view. It does not represent any position or investment advice of Futu. Futu makes no representation or warranty.Read more


Comment (1)
to post a comment
64
93