
【玩轉牛牛】看懂籌碼分佈圖,輕鬆把握主力操盤思路
[Play Bull Bull] Understand the chip distribution map and continue to track the main capital trends!
1. What is chip distribution
“Chip distribution”, also known as “distribution of tradable stock holding costs”, is the distribution of the number of shares in the circulation market of a certain stock at different prices at a certain point in time. In a nutshell,“Chip distribution” reflects the cost price of investors holding a certain stock at a certain point in time.
For example, a company has 1,000 shares of chips in circulation. After trading with investors, these chips are held by four people A, B, C, and D, respectively. Among them:
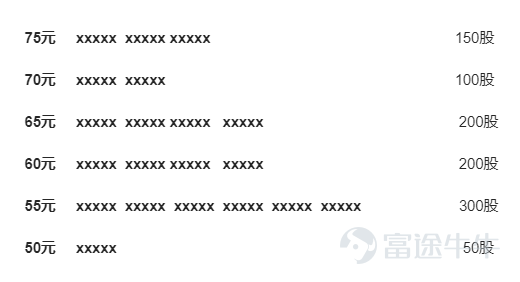
A bought 50 shares for 50 yuan and 150 shares for 55 yuan, holding a total of 200 shares;
B bought 150 shares at 55 yuan and 200 shares at 60 yuan, holding a total of 350 shares;
C bought 200 shares for 65 yuan and 100 shares for 70 yuan, holding a total of 300 shares;
D bought 150 shares for 75 yuan and held a total of 150 shares.
Using “x” to represent the number of chips, and each “x” represents 10 shares, then graphically representing this chip distribution model is:

The above is an example of a simple “chip distribution chart”, which can directly reflect the number of chips corresponding to each price point. If it is a real stock of a listed company, the stock circulation market will be larger (usually at least tens of millions of shares), and the price distribution range will also be wider.
2. What is the use of chip distribution
In the capital market, the main players win control by holding the vast majority of chips, while individual investors are oppressed with fewer chips. In this game, the main players are at a disadvantage because their bulky chips are at a disadvantage, while individual investors have an advantage due to their lightness. For individual investors, the first problem they encounter is how to promote their strengths and avoid their shortcomingsHow to detect the behavior of the main force。
And the main function of chip distribution is to judge the movement of the main forces。
No matter how the chips in circulation are distributed in stocks, the number of chips is fixed and constant. All investors' purchases and sales leave traces in the chip distribution map. Individual investors who are good at research can analyze the entry and exit of the main players through the chip distribution map to understand the intentions of the main players.
Specific research ideas mainly include the following aspects:
1) Can effectively identify the entire process of opening and distributing positions by the main players;
2) Able to effectively determine important support and resistance levels in market development;
3) Able to effectively determine the nature and market trend of the stock
3. How do you view chip distribution
The chip distribution map is placed on the right side of the daily K-line chart, and shares a coordinate system with the daily K-line chart. They all use “price level” as the vertical coordinate. Combining the K-line chart to look at the chip distribution, it is possible to better understand the turnover of chips in stock price changes.

The chip distribution map can be viewed from the following dimensions:
1) Look at the data to understand the current distribution of chips
a. Color (follow the software's settings for rising and falling colors, taking red, green, and falling as an example)
Red: profitable chip area, indicating the cost of holding a chip <current price
Green: Losing chip area, indicating chip holding cost > current price

b. Field
Profit ratio: the percentage of profitable chips;
Average cost: the average price of all chips;
Pressure level: the average price of chips in the total set of chips;
Support level: the average price of chips in the total profit market;
90% chip range: the price range where 90% of the chips are distributed
70% chip range: The price range where 70% of the chips are distributed
The higher the degree of coincidence of chips in these two ranges indicates that the more concentrated chip costs are, the less fluctuation in stock prices is.
2) Look at the graphics to predict the possible transfer of chips

a. Intensive low levels: As stock prices fall, high-cost chips gradually shift to lower levels. When most of the chips are concentrated at the bottom, the resistance to rising stock prices decreases, and there is a chance that there will be a wave of rise
b. High concentration: As stock prices rise, chip costs gradually shift from low to high levels. When most chips are concentrated at the top, it may indicate that low chips have left the market profitably. Downward momentum is forming, so it is necessary to carefully follow up higher
c. Double peak pattern: It mostly occurs in stocks where the stock price fluctuates repeatedly in a range. High concentration levels can be regarded as resistance levels, and low density areas can be seen as support levels. Investors need to control the pace of “selling high and taking a low back”
3) Watch the flow and resume the chip transfer process

Although the chip distribution is static and only shows the cost distribution of stocks at a certain point in time, studying the chip distribution map at different points in time, looking for trends in the movement of chips over time, and reviewing the game process of various forces can help predict the movement of chips to a certain extent.
There is an article at the bottom of the Niu Niu [Chip Distribution] pagetimelinesBulls can pull the timeline to get the chip distribution of a certain stock for all trading days in the past two months, showing the chip transfer process during this period as if it were a “movie.”
4. Function entrance
1) Stock Price Page - K Line Chart - Horizontal Screen Mode

2) Individual Stock Quote Page - Chip Distribution Card

After reading the introduction to the chip distribution map, are there any friends who are eager to try their hand at it?
Put the truth into practice and leave your valuable suggestions on the “Chip Distribution Map” feature in the comments section, or on the topic [Play Bull Bull] Understand the chip distribution map and easily grasp the main trading ideas Let's share your usage experience below and talk about how you can use this function to track individual stock market trends and analyze investment strategies~
Risk Disclaimer: The above content only represents the author's view. It does not represent any position or investment advice of Futu. Futu makes no representation or warranty.Read more


Comments (30)
to post a comment
155
366