English
Back
Open Account
Here are the introduction of Quotes features you may be interested in Futubull.
Futubull Team
joined discussion · Jun 4, 2021 15:16 ·

The daily short sale data of US stocks is now available online for the first time in China!

In version 11.8 on the mobile app, Futubull has newly launcheddaily short sale data for all U.S. stocks, currently accessing the two largest exchange groups in terms of trading volume in U.S. markets: Nasdaq and NYSE. According to Nasdaq Exchange, Futu is the first domestic platform to access this data!The change in stock price is influenced by the comparison of long and short forces, timely tracking of short sale data can assist in understanding changes in short interest and making investment decisions.

In addition to the bi-monthly updated short interest data, Futubull has addedUpdated dailyAll daily short sale data of US stocks, helping mooer to clearly track the updated changes in short sale data and makemore timelyinvestment decisions.

Please follow mooer to see how to use this new feature, making it apowerful tool for assisting investment, helping us achieve more investment returns~

What is short selling?
Short selling refers to investors in the securities market borrowing a large amount of securities at high prices when the security prices soar, selling them at a high price in the market, then buying back the securities at a low price after the future fall in prices, returning the borrowed securities, and thus making a profit.
How to use short sale data to assist investment decisions?
1. Usage Scenarios
Short interest data is one of the important indicators for analyzing stocks, which can assist investors in analyzing the market sentiment and potential performance of a particular stock. Futubull fans who prefer to go long can track short interest data to avoid stocks that may have a downward trend in price; for Mooers interested in short selling, they can identify individual stocks with excessively high short interest ratios to discover investment opportunities.

Second, understand the short sale data indicators
Daily short volume:The number of shares of the stock traded short in the public market daily.
* Daily short interest data is provided by major exchanges and is generally updated once a day.
Short interest volume:The number of shares of the stocks that were short sold and not covered at the deadline.
Short interest ratio:Short interest volume/total shares outstanding
Short interest data needs to be settled and calculated by the exchange, generally updated every half a month.

Third, determine market sentiment based on short sale data indicators to assist decision-making.
Short sell transactions to some extent reflect investors' judgment on the stock's future stock price.
When a stock has a high volume of short sell transactions, it reflects investors' expectation of a decrease in the stock price in the future. If the short sell volume of a stock rises sharply, there is a high chance of the stock declining in the short term.
In version 11.8 on the mobile end, Futubull has newly launched the daily short selling data for all US stocks, which has already been connected to the two largest exchange groups in the US in terms of trading volume: NASDAQ and NYSE. According to the NASDAQ Exchange, Futubull is the first domestic platform to access this data!  The change in stock price is influenced by the comparison of bullish and bearish forces. Tracking short sale data promptly can assist in understanding the changes in short interest and making investment decisions. In addition to the bi-weekly updated short interest data, Futubull has newly added daily updated short sale data for all US stocks this time, helping mooers easily track the updated changes in short sale data and make more timely investment decisions.  Now let's take a look together with Futubull below to see how to use this new feature, making it a powerful tool for investment assistance, and helping us gain more investment returns~  What is short selling? Short selling refers to investors in the securities market borrowing a large amount of securities at a high price to sell on the market when the securities price is soaring. Then, they buy back the securities at a lower price after the securities price falls in the future, return the borrowed securities, and thus make a profit. How to use short sale data to assist investment decisions? One. Using Scenarios Short sale analysis is one of the key indicators for analyzing stocks, which can assist investors in analyzing the market sentiment and potential performance of a particular stock. Mooers who like to go long can track short sale data to avoid stocks that may have a downward trend in stock price; mooers interested in short selling can identify stocks with excessively high short interest ratios to discover investment opportunities. Second, understanding short sale data...
In addition to the short sell volume, short sell transaction ratio analysis can also be considered. If the short sell volume of a certain stock increases, but the change in the short sell transaction ratio is not significant, it may not necessarily have a significant meaning. If the short sell transaction ratio keeps rising, the chances of a stock price decline will be higher.

2. The change in short interest quantity/ratio is an important indicator reflecting market bearish sentiment and stock price movements.
A higher short interest quantity indicates that short sellers are currently suppressing stock prices, increasing the likelihood of a stock price decline; conversely, a significant decrease in short interest quantity indicates that short sellers are covering their positions by buying stocks, which may further stimulate stock price increase.
As shown in the chart below, the trend of stock prices is negatively correlated with the short interest ratio, but the correlation is not absolute because there are many factors that influence stock prices. It is not advisable to rely solely on a single indicator to judge the trend of stock prices. If a stock has a high short sell ratio and the price continues to rise for various reasons, short sellers will have to buy back the stocks at a high price, triggering a short squeeze.
In version 11.8 on the mobile end, Futubull has newly launched the daily short selling data for all US stocks, which has already been connected to the two largest exchange groups in the US in terms of trading volume: NASDAQ and NYSE. According to the NASDAQ Exchange, Futubull is the first domestic platform to access this data!  The change in stock price is influenced by the comparison of bullish and bearish forces. Tracking short sale data promptly can assist in understanding the changes in short interest and making investment decisions. In addition to the bi-weekly updated short interest data, Futubull has newly added daily updated short sale data for all US stocks this time, helping mooers easily track the updated changes in short sale data and make more timely investment decisions.  Now let's take a look together with Futubull below to see how to use this new feature, making it a powerful tool for investment assistance, and helping us gain more investment returns~  What is short selling? Short selling refers to investors in the securities market borrowing a large amount of securities at a high price to sell on the market when the securities price is soaring. Then, they buy back the securities at a lower price after the securities price falls in the future, return the borrowed securities, and thus make a profit. How to use short sale data to assist investment decisions? One. Using Scenarios Short sale analysis is one of the key indicators for analyzing stocks, which can assist investors in analyzing the market sentiment and potential performance of a particular stock. Mooers who like to go long can track short sale data to avoid stocks that may have a downward trend in stock price; mooers interested in short selling can identify stocks with excessively high short interest ratios to discover investment opportunities. Second, understanding short sale data...

Where can I check the daily short sell data of U.S. stocks?
- Entrance: Open the Futubull app, enter the 'Detailed Quote' page of a U.S. stock, click on the 'Analysis' tab, select 'Fundamentals,' and you can view the daily short sell data of individual stocks under 'Short Sale Analysis'.
In version 11.8 on the mobile end, Futubull has newly launched the daily short selling data for all US stocks, which has already been connected to the two largest exchange groups in the US in terms of trading volume: NASDAQ and NYSE. According to the NASDAQ Exchange, Futubull is the first domestic platform to access this data!  The change in stock price is influenced by the comparison of bullish and bearish forces. Tracking short sale data promptly can assist in understanding the changes in short interest and making investment decisions. In addition to the bi-weekly updated short interest data, Futubull has newly added daily updated short sale data for all US stocks this time, helping mooers easily track the updated changes in short sale data and make more timely investment decisions.  Now let's take a look together with Futubull below to see how to use this new feature, making it a powerful tool for investment assistance, and helping us gain more investment returns~  What is short selling? Short selling refers to investors in the securities market borrowing a large amount of securities at a high price to sell on the market when the securities price is soaring. Then, they buy back the securities at a lower price after the securities price falls in the future, return the borrowed securities, and thus make a profit. How to use short sale data to assist investment decisions? One. Using Scenarios Short sale analysis is one of the key indicators for analyzing stocks, which can assist investors in analyzing the market sentiment and potential performance of a particular stock. Mooers who like to go long can track short sale data to avoid stocks that may have a downward trend in stock price; mooers interested in short selling can identify stocks with excessively high short interest ratios to discover investment opportunities. Second, understanding short sale data...

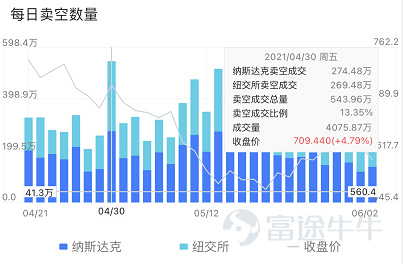
1. View the total short sell volume of a specific stock in the daily short sell data chart. Click on the crosshairs to see the total volume and short sell transaction ratio for the day.
In version 11.8 on the mobile end, Futubull has newly launched the daily short selling data for all US stocks, which has already been connected to the two largest exchange groups in the US in terms of trading volume: NASDAQ and NYSE. According to the NASDAQ Exchange, Futubull is the first domestic platform to access this data!  The change in stock price is influenced by the comparison of bullish and bearish forces. Tracking short sale data promptly can assist in understanding the changes in short interest and making investment decisions. In addition to the bi-weekly updated short interest data, Futubull has newly added daily updated short sale data for all US stocks this time, helping mooers easily track the updated changes in short sale data and make more timely investment decisions.  Now let's take a look together with Futubull below to see how to use this new feature, making it a powerful tool for investment assistance, and helping us gain more investment returns~  What is short selling? Short selling refers to investors in the securities market borrowing a large amount of securities at a high price to sell on the market when the securities price is soaring. Then, they buy back the securities at a lower price after the securities price falls in the future, return the borrowed securities, and thus make a profit. How to use short sale data to assist investment decisions? One. Using Scenarios Short sale analysis is one of the key indicators for analyzing stocks, which can assist investors in analyzing the market sentiment and potential performance of a particular stock. Mooers who like to go long can track short sale data to avoid stocks that may have a downward trend in stock price; mooers interested in short selling can identify stocks with excessively high short interest ratios to discover investment opportunities. Second, understanding short sale data...

2. Click on the grayed-out 'Nasdaq' legend to view the short sell transaction trends of NYSE and all its affiliates separately; click on the grayed-out 'NYSE' legend to view the short sell transaction trends of Nasdaq and all its affiliates separately.
In version 11.8 on the mobile end, Futubull has newly launched the daily short selling data for all US stocks, which has already been connected to the two largest exchange groups in the US in terms of trading volume: NASDAQ and NYSE. According to the NASDAQ Exchange, Futubull is the first domestic platform to access this data!  The change in stock price is influenced by the comparison of bullish and bearish forces. Tracking short sale data promptly can assist in understanding the changes in short interest and making investment decisions. In addition to the bi-weekly updated short interest data, Futubull has newly added daily updated short sale data for all US stocks this time, helping mooers easily track the updated changes in short sale data and make more timely investment decisions.  Now let's take a look together with Futubull below to see how to use this new feature, making it a powerful tool for investment assistance, and helping us gain more investment returns~  What is short selling? Short selling refers to investors in the securities market borrowing a large amount of securities at a high price to sell on the market when the securities price is soaring. Then, they buy back the securities at a lower price after the securities price falls in the future, return the borrowed securities, and thus make a profit. How to use short sale data to assist investment decisions? One. Using Scenarios Short sale analysis is one of the key indicators for analyzing stocks, which can assist investors in analyzing the market sentiment and potential performance of a particular stock. Mooers who like to go long can track short sale data to avoid stocks that may have a downward trend in stock price; mooers interested in short selling can identify stocks with excessively high short interest ratios to discover investment opportunities. Second, understanding short sale data...

3. In addition to the daily short volume of individual stocks, Futu also provides the total short interest of the stock. Click on the cross-shaped floating window to view the short interest and proportion on the day.
In version 11.8 on the mobile end, Futubull has newly launched the daily short selling data for all US stocks, which has already been connected to the two largest exchange groups in the US in terms of trading volume: NASDAQ and NYSE. According to the NASDAQ Exchange, Futubull is the first domestic platform to access this data!  The change in stock price is influenced by the comparison of bullish and bearish forces. Tracking short sale data promptly can assist in understanding the changes in short interest and making investment decisions. In addition to the bi-weekly updated short interest data, Futubull has newly added daily updated short sale data for all US stocks this time, helping mooers easily track the updated changes in short sale data and make more timely investment decisions.  Now let's take a look together with Futubull below to see how to use this new feature, making it a powerful tool for investment assistance, and helping us gain more investment returns~  What is short selling? Short selling refers to investors in the securities market borrowing a large amount of securities at a high price to sell on the market when the securities price is soaring. Then, they buy back the securities at a lower price after the securities price falls in the future, return the borrowed securities, and thus make a profit. How to use short sale data to assist investment decisions? One. Using Scenarios Short sale analysis is one of the key indicators for analyzing stocks, which can assist investors in analyzing the market sentiment and potential performance of a particular stock. Mooers who like to go long can track short sale data to avoid stocks that may have a downward trend in stock price; mooers interested in short selling can identify stocks with excessively high short interest ratios to discover investment opportunities. Second, understanding short sale data...

Combining the daily short volume and short interest of a stock, I believe fellow mooers can have a deeper understanding of the stock's short situation. Hope this feature can help you gain excess returns~

For more usage of daily short sell data on U.S. stocks, wait for fellow mooers to explore it personally~ If you have any feedback or suggestions on the use of this feature, feel free to leave a comment in the comment section.
Risk Disclaimer: The above content only represents the author's view. It does not represent any position or investment advice of Futu. Futu makes no representation or warranty.Read more
Sob
1
Respect
5
Heart
9
Thumbs Up
107
315K Views
Report
Comments (19)
Write a Comment...
19
122
203