
SpaceX's second wave of lock-up expirations is here; how should investors position themselves in spa

Tech Intelligence Bureau | SpaceX earnings announcement imminent; Musk hails it as a 'great buying opportunity'
$SpaceX (SPCX.US)$It will release its first quarterly earnings report since going public after U.S. market hours on August 4 (Eastern Time).
The key highlights of this earnings report center on three aspects:Starlink subscriber growth rate and revenue scale, the specific timeline for Starship commercialization, and guidance on full-year capital expenditure.Ahead of the earnings release, analyst target prices show significant divergence, reflecting marked differences in institutional valuation assessments of SpaceX.
Meanwhile, a large volume of shares is set to be unlocked on August 6. Since its post-IPO peak, SpaceX’s stock has declined by over 50%, heightening market sensitivity to potential selling pressure ahead of the lock-up expiration. If the earnings report fails to concurrently boost market confidence,The possibility of heavy selling pressure around the lock-up expiration date cannot be ignored.Notably, Musk recently responded on social media that, in hindsight, the current SpaceX share price represents an 'excellent buying opportunity.' This statement may emotionally temper some early shareholders' willingness to sell.
Overall, the confluence of earnings release and lock-up expiration creates a dual-event window,which could lead to significant short-term volatility for SpaceX shares.Below, we will systematically analyze its price structure and key signals from a technical perspective.
Recent stock price movement
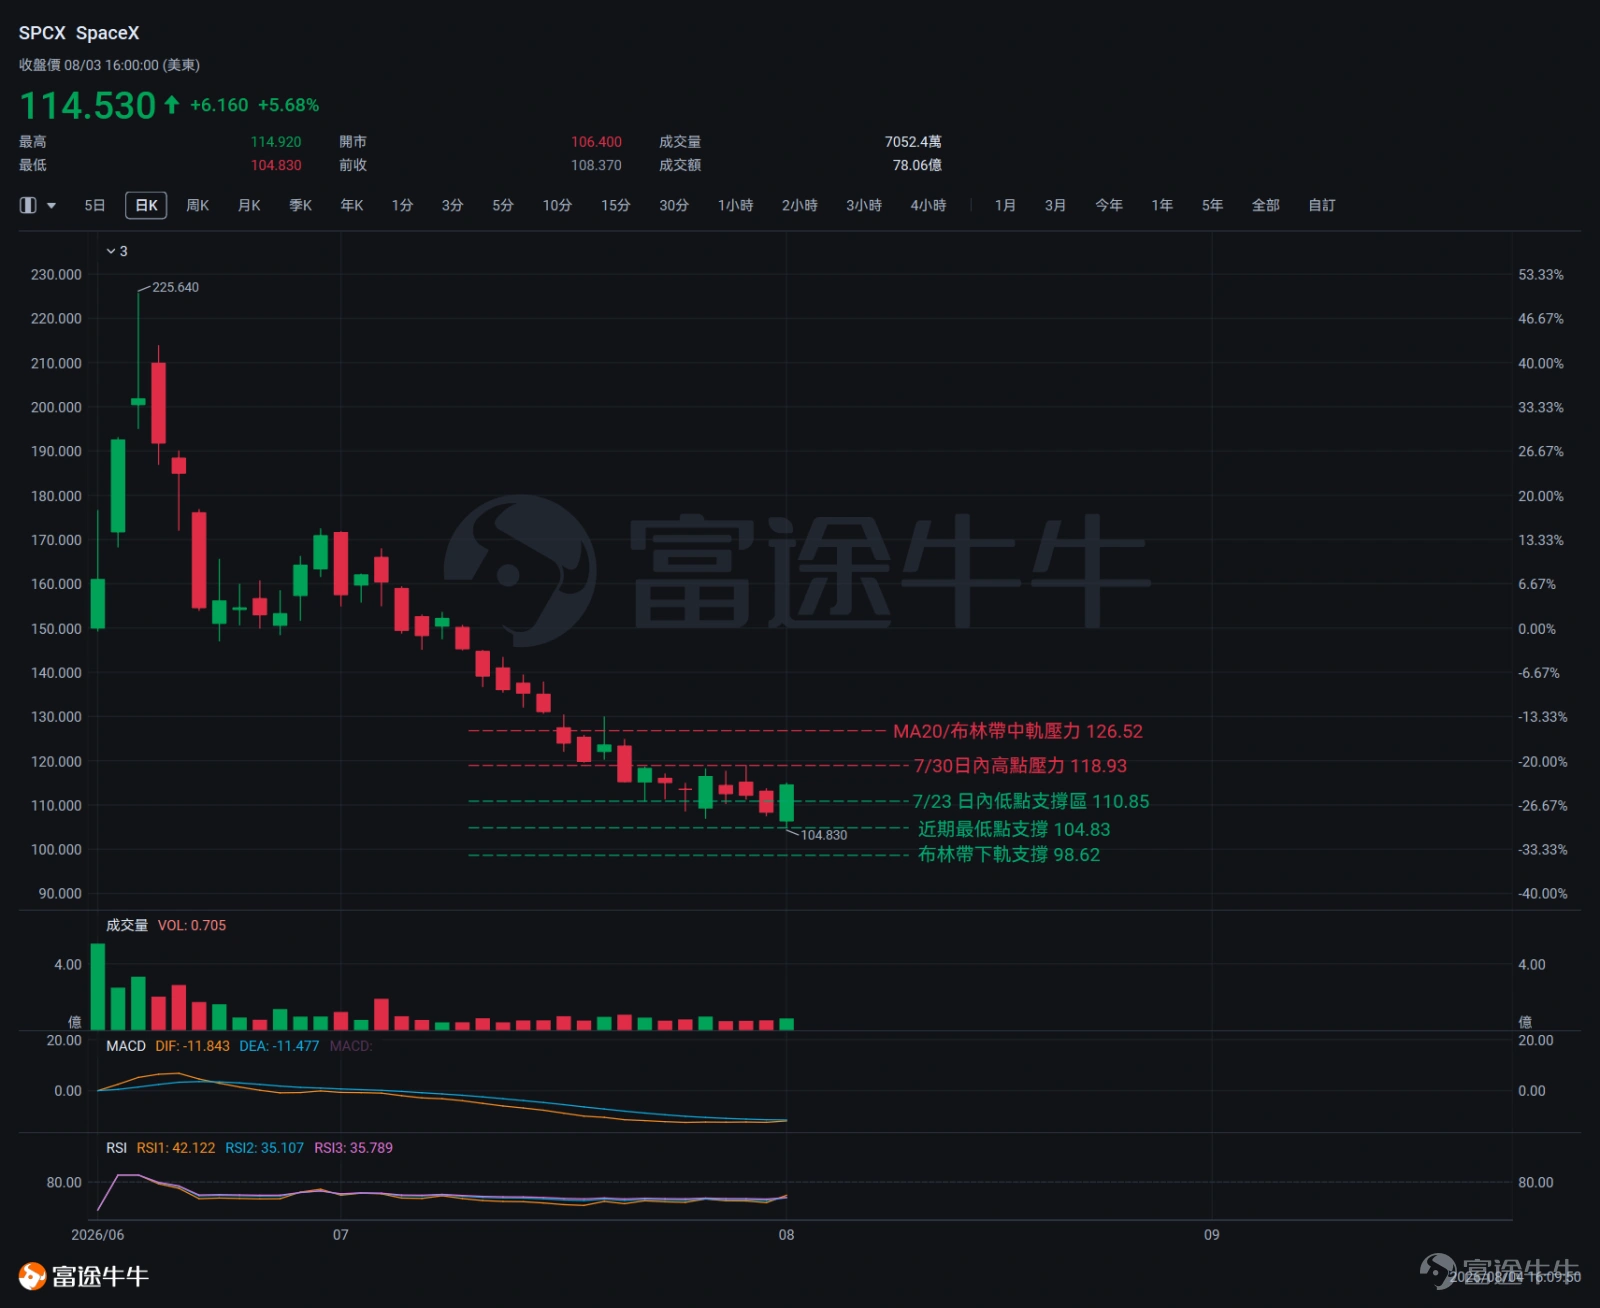
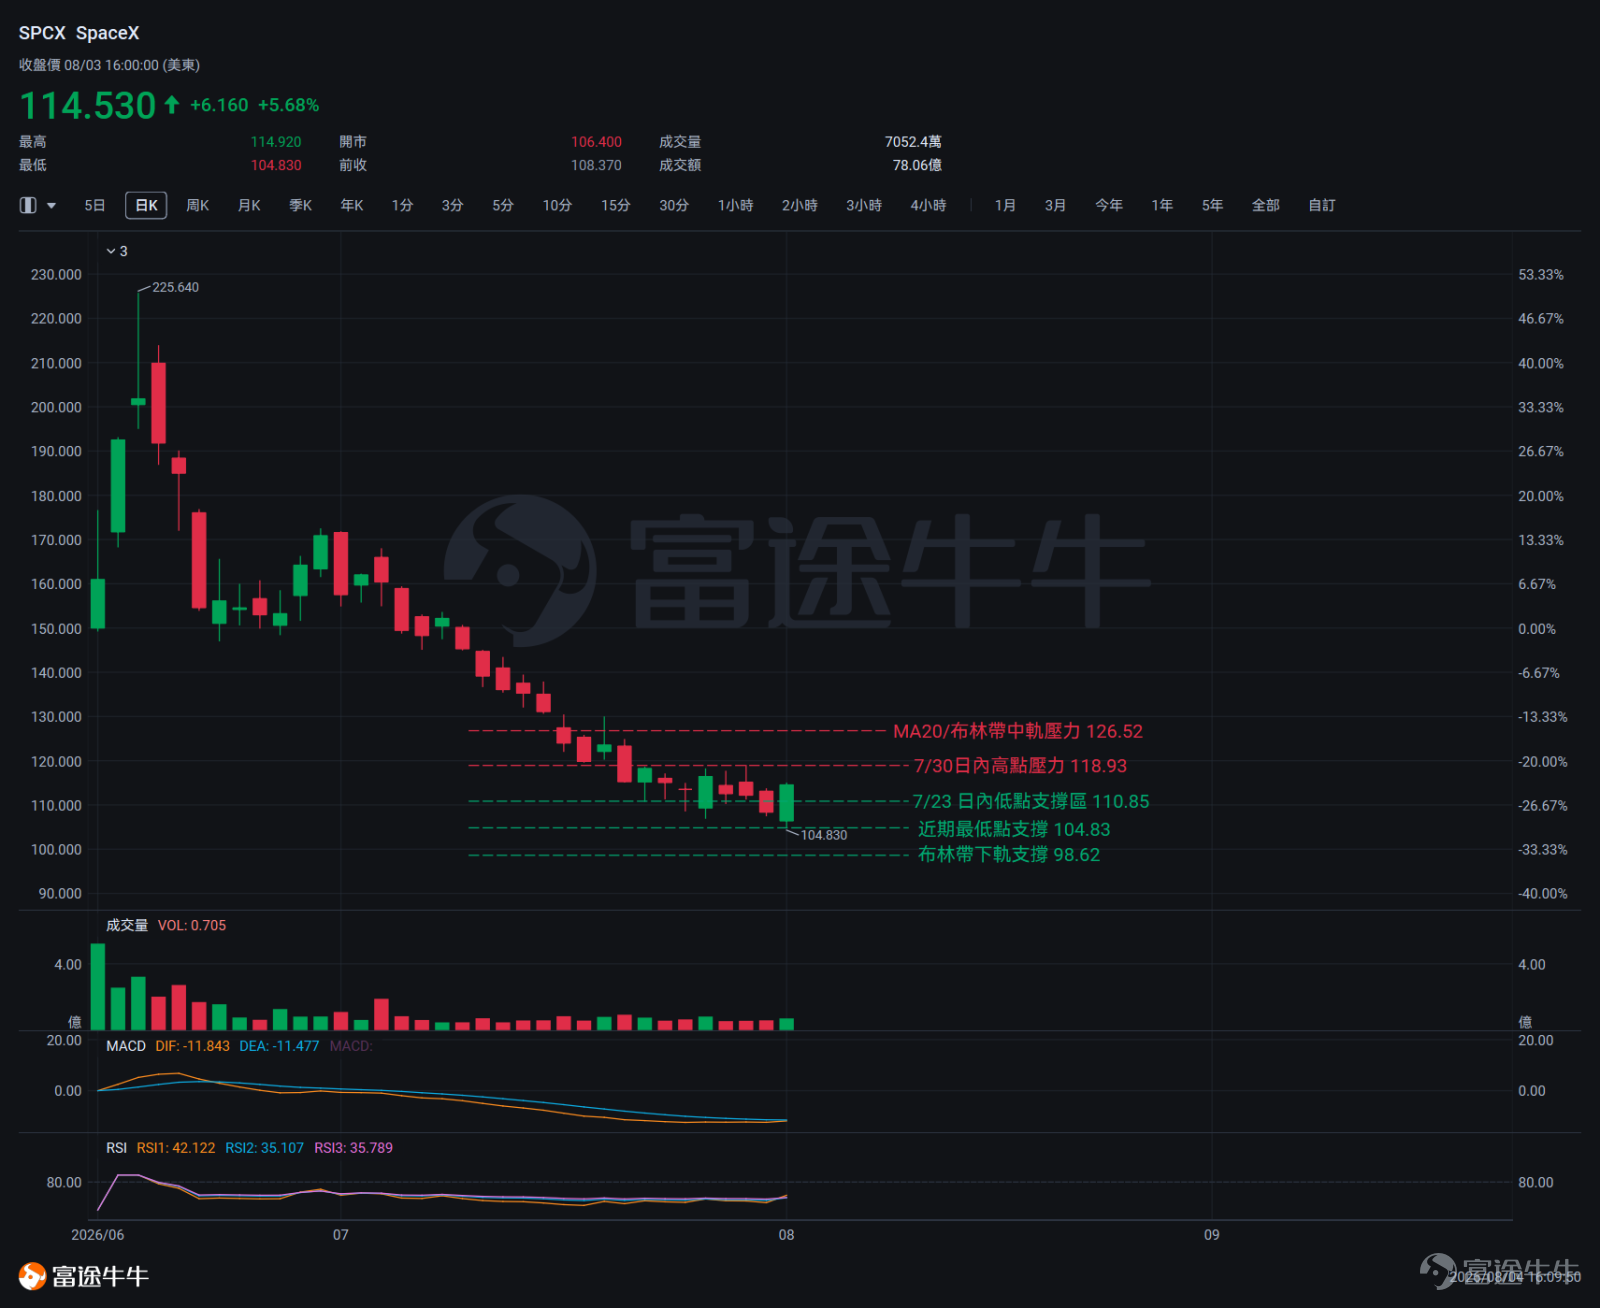
Recently, SpaceX’s share price has consistently traded below the 20-day moving average (MA20) of $126.52, deviating by approximately 10.5%,indicating an overall bearish trend bias.Regarding Bollinger Bands, the stock price has been oscillating between the middle and lower bands, with band width expanding—reflecting elevated recent volatility. Over the past 10 trading days, the closing price declined from $123.54 to a low of $108.37, confirming sustained downward momentum.
A turning point emerged on August 3: On that day, the stock opened lower at $106.40, dipped intraday to a low of $104.83, and then surged sharply to close at $114.53—a pronounced bullish reversal candle with minimal upper shadow, closing near the session high. Combined with the July 31 low of $107.57,The two-day price action has初步 formed a potential double bottom pattern, showing early signs of short-term bottoming and stabilization.
Overall assessment:SpaceX’s current trend remains predominantly characterized by a choppy downtrend. If the market 'validates' its earnings, a short squeeze in the near term warrants attention; if results fall short of expectations, bearish pressure could further amplify downside momentum.
Key Technical Indicator Analysis
Moving Averages (MA):MA20 = $126.52; the current share price is below the MA20, with clear downward pressure from the moving average, reflecting a single-moving-average bearish resistance setup.
RSI:The current RSI value is 35.11, within the neutral range. Over the past 10 days, prices rebounded after testing lower levels, but RSI shows no clear bullish divergence.
MACD:MACD line (-11.84) < Signal line (-11.48), forming a bearish crossover, with negative histogram bars, indicating bearish momentum remains dominant.
Bollinger Bands:The current share price of $114.53 lies between the Bollinger Bands’ middle band ($126.52) and lower band ($98.62). The band width of 55.79 reflects a relatively expanded state, indicating elevated recent volatility.
Comprehensive assessment
In terms of SpaceX’s current share price structure, on the downside support side,$107.57 (dense trading zone at the July 31 low) serves as the nearest key support level,If this level is breached,Immediate support will come into play at the downside level of $104.83 (the intraday low reached on August 3).A break below this level would heighten tail risks, warranting caution over accelerated downside moves.
On the upside, resistance lies at$117.59 (the recent high zone tested multiple times between July 28 and 30), which serves as the key near-term resistance for any rebound.Whether the price can convincingly break above this level accompanied by a concurrent increase in trading volume is critical to determining if the current rebound can extend further.If the breakout occurs without a simultaneous rise in volume, a near-term pullback becomes likely, increasing the probability of range-bound volatility. Further upside resistance sits at $126.52 (the 20-day moving average and the middle Bollinger Band), representing a core medium-term resistance level.Until the prevailing downtrend shows clear signs of reversal, the constraining effect of this level on rally potential should not be underestimated.

Risk Disclaimer: The above content only represents the author's view. It does not represent any position or investment advice of Futu. Futu makes no representation or warranty.Read more


Comments (16)
to post a comment
52
177