
Intel reports strong earnings—will its stock price regain upward momentum?

Intel Q2 2026 Earnings Review and Valuation Discussion: Results Significantly Beat Expectations, with Foundry Turnaround Optionality Yet to Unfold
The following represents solely the author’s personal views and theoretical analysis, and does not constitute any investment advice. Please assume all risks yourself; all tables below are self-prepared by the author.
1. Q2 significantly beat expectations and demonstrated strong operational quality

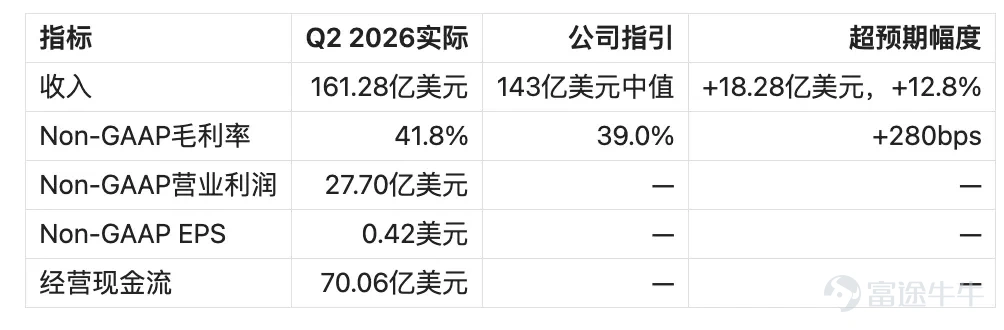
Under GAAP, net loss attributable to shareholders was USD 11.033 billion, with EPS at -$2.16, primarily impacted by a USD 12.529 billion non-cash mark-to-market loss on derivative liabilities related to U.S. government-held shares. This loss arose from Intel’s rising share price, which increased the fair value of the associated liability—a non-cash accounting adjustment. Operational performance should be assessed primarily based on Non-GAAP earnings, segment operating profit, and cash flow.
Revenue, gross margin, and profitability all exceeded expectations this quarter, indicating that improvements stemmed from a combination of scale, product mix, and manufacturing efficiency. Server supply remains tight, client product portfolios are shifting toward premium segments, unit costs for the 18A node are declining rapidly, and disciplined expense management is beginning to unlock operating leverage. Q2 has established a clear chain linking revenue growth to profit improvement.
2. Server price increases were the strongest growth driver this quarter
DCAI revenue reached USD 6.262 billion, up 59% year-over-year and 24% quarter-over-quarter; operating profit was USD 2.474 billion, with an operating margin of 39.5%. Server CPU unit sales rose 9% year-over-year, while average selling price (ASP) surged 48%.
The substantial ASP increase in servers was driven by three factors: higher mix of high-core-count products, improved premium SKU structure, and pricing power in a supply-constrained environment. Demand for Granite Rapids—spanning Intel 3 wafers, substrates, T-glass, memory, and advanced packaging—has risen simultaneously, but current delivery capacity is constrained across multiple nodes. Management expects server supply expansion to tilt toward late Q3 and Q4, with more pronounced revenue contribution appearing in Q4.
This outcome demonstrates that Intel still maintains a robust customer base and strong monetization capability in the server market. Supply ramp-up can directly translate into revenue and profit, representing the clearest path for continued Products segment growth in the second half. While market share reversal still requires confirmation from third-party data, Q2 has already proven that product competitiveness is sufficient to support a rapid recovery in the server business.
3. Client computing revenue recovered, though profit quality still has room for improvement
CCPG revenue was USD 8.877 billion, up 13% year-over-year and 15% quarter-over-quarter; operating profit was USD 2.343 billion, with an operating margin of 26.4%. Client unit volumes declined 8% year-over-year, while ASP rose 27%, indicating that revenue recovery was driven primarily by a richer product mix and higher pricing—not by a rebound in PC end-market demand.
Client computing margins were pressured by inventory-related expenses and early ramp costs for Panther Lake. Intel disclosed in its 10-Q filing that CCPG operating expenses increased by USD 669 million year-over-year, largely due to inventory-related charges from product portfolio adjustments. As these charges are non-recurring and Panther Lake yields improve alongside declining unit costs, CCPG margins have clear upside potential.
Client computing business currently exhibits a combination of 'weak sales volume, structural upgrade, and margins awaiting recovery.' Unit demand in the PC market will remain under pressure through 2026. The key focus for CCPG in the second half is whether revenue growth can translate into higher operating profit, rather than merely tracking shipment volumes.
Fourth, the manufacturing recovery in 18A has already materialized, but external orders still need to ramp up.
Q2 provided several operationally meaningful validation metrics for Intel’s manufacturing capabilities: 18A output increased by over 50% quarter-over-quarter, approximately 25% above internal targets; yields, production cycle times, wafer costs, and fab utilization all continued to improve; and the unit cost of Panther Lake’s lead SKUs has declined by roughly 50% year-to-date, with the company targeting an additional ~20% reduction from current levels by year-end.
Assuming a unit cost of 100 at the beginning of the year, a 50% decline brings it to 50, and a further 20% decline brings it to 40, representing an approximate cumulative 60% reduction for the full year. This learning curve is already sufficient to impact product costs and Foundry losses. Foundry reported an operating loss of USD 2.089 billion in Q2, narrowing by USD 348 million quarter-over-quarter, indicating that internal manufacturing recovery is now reflected in financial statements.
Intel’s advanced manufacturing capability has progressed from process node advancements to tangible improvements in sellable output, unit costs, and segment profitability. Although yield data remains undisclosed, output, costs, cycle times, and narrowing losses together form a more comprehensive cross-validation.
Fifth, capacity realization begins from late Q3 through Q4.
The new supply referenced by management for Q4 does not stem from the concentrated ramp-up of a single new wafer fab, but rather from a confluence of multiple capacity expansions and supply improvements: increased wafer starts for Intel 3, improved yields, and shortened production cycles generating more sellable output, alongside easing bottlenecks in substrates, T-glass, memory, and advanced packaging starting late Q3. Front-end capacity is increasing incrementally, while back-end supply shows more step-function improvements.
This incremental capacity will initially serve Intel’s own server CPUs, such as Granite Rapids. Management confirmed that if wafer, substrate, and memory supply improves as planned from late Q3 through Q4, Q4 revenue will benefit; even with increased supply, the company may still be unable to fully meet server demand at that time. Thus, Q4 serves as a critical validation window for demand strength, capacity execution, and profit conversion.
5.1 Internal capacity release first improves Foundry economics
Intel Foundry reported Q2 revenue of USD 5.765 billion, of which USD 5.472 billion came from internal manufacturing for Intel Products, and external revenue totaled USD 293 million. Of this external revenue, Altera contributed USD 181 million, leaving approximately USD 112 million from other external customers.
This data set reveals the current stage of Foundry: internal manufacturing efficiency is rapidly recovering, while external wafer foundry services have yet to achieve scale. The operating loss of USD 2.089 billion absorbed depreciation and fixed costs from fabs, R&D expenses for 18A/18A-P/14A nodes, investments in PDK and IP ecosystem development, and spending on advanced packaging.
The additional capacity in Q4 primarily came from Intel’s internal CPU supply chain, but it also improves Foundry’s economics. Higher wafer output and finished product deliveries boost factory utilization, increase internal manufacturing revenue, and help amortize depreciation and fixed costs. Therefore, to assess whether capacity expansion is effective, one must simultaneously monitor server shipments, Products’ operating profit, and Foundry’s quarterly loss—not just revenue growth.
5.2 External commercialization determines Foundry’s valuation ceiling
Foundry should be tracked across three tiers:
1. Internal manufacturing recovery has already materialized.
Improved 18A yields and unit costs can increase Intel’s in-house CPU supply and narrow manufacturing losses.
2. Advanced packaging has entered the phase of external volume ramp-up.
EMIB-T yield and reliability have met internal targets, backlog orders are growing, and customers plan to ramp up in 2027.
3. External advanced wafer foundry services have entered a critical validation period.
18A-P and 14A still require named customers, capacity reservations, prepayments, and volume production commitments to support their standalone commercial viability.
In the second half of the year, the following milestones should be tracked sequentially:
The top priority for the second half is to verify whether Intel can convert its capital investments into deliverable capacity as planned, and then translate that capacity into revenue, Products profitability, and a narrowing of Foundry losses. External customers represent a second-phase validation: only when clients are willing to entrust Intel with manufacturing their core products—and share expansion risk through capacity reservations, advance payments, or volume production commitments—will Foundry evolve from an internal manufacturing system into an externally viable platform with independent value.
Intel has already raised its 2026 capital expenditures to over $20 billion and expects 2027 spending to be significantly higher than in 2026. Capacity utilization, customer commitments, and financing structures will collectively determine the ultimate asset value created by these investments.
6. Valuation: Products provide the base value; Foundry determines the upside potential
Intel’s Q3 revenue guidance ranges from $15.8 billion to $16.8 billion, with a midpoint of $16.3 billion—only slightly above Q2’s $16.128 billion. The Non-GAAP gross margin guidance stands at 42.0%, with EPS guided to $0.38. This outlook assumes no significant revenue jump in Q3, consistent with management’s comment that 'supply growth is weighted more toward late Q3 and Q4.' Inventory-related expenses will no longer provide a positive contribution to gross margins, partially offset by the initially low per-unit gross margins of early Panther Lake and Granite Rapids ramp-ups.
Intel Products generated $4.817 billion in operating profit in Q2, bringing the first-half total to $8.875 billion. To reach the full-year target of $20 billion, Q3 and Q4 must average $5.563 billion per quarter—a 15.5% increase over Q2. Server supply coming online in Q4, the fading impact of CCPG inventory-related expenses, and continued manufacturing cost reductions provide a pathway to this goal; execution will ultimately set the profit baseline for 2027.
Intel comprises both the already profitable Products segment and the Foundry segment, which remains in a heavy investment phase—making a sum-of-the-parts valuation approach appropriate. Products should be valued based on normalized Core EPS and a P/E multiple, while Foundry, currently unprofitable, is better assessed using book value and P/B scenarios. The following analysis assumes a fully diluted share count of 5.2 billion shares, incorporating potential dilution from U.S. government-held shares and standard equity-based compensation.
6.1 What is already priced in
The current share price already reflects expectations of Products profitability returning to neutral levels and continued improvements in manufacturing efficiency. However, the market continues to apply a significant discount to Foundry due to uncertainties around external commercialization, return on capital expenditures, and financing risks. Therefore, near-term upside will primarily stem from continued operational delivery and convergence of the Foundry discount—not merely from valuation multiple expansion.
The release of server capacity in Q4, achievement of quarterly Products operating profit consistent with the full-year $20 billion target, and further sequential narrowing of Foundry losses will bolster the credibility of the $92–$93 Products valuation. Named external customers, monetization of advanced packaging capabilities, and disciplined 2027 capital expenditure execution will determine whether Foundry can be revalued from a 1x P/B internal manufacturing asset to a strategic platform trading above 2x P/B.
Valuation conclusion:The current price does not reflect significant undervaluation; the recovery in Products has already been largely priced in. Fourth-quarter capacity ramp-up offers an opportunity for earnings upgrades, while Foundry commercialization will determine the medium- to long-term upside potential.
VII. Conclusion: Improvement in Products is already anticipated; the optionality from Foundry remains unrealized.
Intel's Q2 results significantly exceeded expectations and demonstrated strong operational quality. Rising server volumes and pricing, improved client product mix, lower 18A costs, and a narrowing Foundry loss collectively confirmed improvements in profitability and manufacturing efficiency. The Products segment performed strongly, but this improvement is already consensus view and has been largely reflected in the current valuation.
The most immediate observation window will be from late Q3 into Q4. Whether wafer, substrate, memory, and advanced packaging supplies can be released as planned will determine the growth trajectory of server revenue and Products profitability, and will also test whether Foundry losses can continue to narrow following higher internal manufacturing utilization.
What remains truly unrealized is the Foundry recovery optionality. External revenue in Q2 was still modest, and advanced foundry services have yet to generate visible revenue. Progress on 18A-P, 14A PDKs, advanced packaging orders, and external customer commitments will serve as key validation points in the next phase. These developments will determine whether Foundry can build an externally viable commercial platform with standalone value beyond internal manufacturing recovery.
Risk Disclaimer: The above content only represents the author's view. It does not represent any position or investment advice of Futu. Futu makes no representation or warranty.Read more
Comments
to post a comment
1