
ASML Holding and Taiwan Semiconductor both reported strong earnings—when will the semiconductor sell

Niu Niu Tech Intelligence Bureau | Semiconductor equipment enters a 'super cycle'! ASML and AMAT shares hit record highs
The semiconductor equipment sector has shown strong recent performance,$ASML Holding (ASML.US)$ and $Applied Materials (AMAT.US)$with share prices of key players hitting new highs,driven by substantive shifts on the demand side.
Take memory chips as an example: Samsung, SK Hynix, and Micron together account for approximately 90% of the global DRAM market, and all three have nearly simultaneously raised their capital expenditure plans. Among them, SK Hynix has been the most explicit—its chairman publicly disclosed that the company plans to double its wafer capacity over the next five years and double it again by 2034. This means that within less than a decade, a leading memory manufacturer will expand its capacity to four times its current scale, implying a massive increase in required purchases of lithography tools, etching equipment, and thin-film deposition systems.Once capacity expansion signals are confirmed, upstream equipment suppliers gain greater pricing power.
From a broader perspective, UBS Group characterizes the current phase as the 'early stage of a supercycle' for the global semiconductor equipment market and forecasts the market size will reach $250 billion by 2028.For more opportunities related to the semiconductor equipment supply chain, click here >>
In terms of individual stocks,ASML Holding’s biggest market catalyst this week was Elon Musk’s appearance at an internal virtual technology summit. ASML’s CEO stated plainly at the event that demand for AI infrastructure remains 'enormous,' and commented on Musk’s Terafab chip manufacturing initiative—which would require large-scale EUV lithography tools, with ASML seen as an irreplaceable partner.He offered commentary and urged cautious assessment of the project's rollout pace. Additionally,multiple institutions (including BofA Securities and Bernstein) have collectively raised their target prices.A concentrated endorsement signal has emerged. On the technology roadmap front, ASML Holding’s joint effort with Taiwan Semiconductor and IMEC to integrate 2D-material transistors on 12-inch wafers using EUV lithography has entered the mass production validation phase.
Regarding Applied Materials, Citi significantly raised its price target from $550 to $710—citing 'AI agents driving structural NAND demand' as the core thesis—while maintaining a Buy rating, making it the most direct catalyst of the day.Applied Materials’ shares surged more than 9% intraday, hitting a record high.On the fundamentals side, Applied Materials announced a $500 million expansion of its Tampines facility in Singapore. The CEO noted that 'the number of new wafer fabs under construction has increased significantly,' and simultaneously unveiled new deposition and etch equipment specifically designed to enable breakthroughs in 3D chip manufacturing processes.Both capacity deployment and product lines continue to deepen progressively.
Both stocks are currently trading within an uptrend.In this edition, Bull Bull Tech Intelligence will systematically analyze recent structural characteristics and key reference levels from a technical perspective.
ASML
![The semiconductor equipment sector has shown strong momentum recently,$ASML Holding (ASML.US)$ and $Applied Materials (AMAT.US)$with both companies’ share prices reaching new all-time highs,driven by fundamental shifts on the demand side. Take memory chips as an example: Samsung, SK Hynix, and Micron collectively account for about 90% of the global DRAM market. All three have nearly simultaneously raised their capital expenditure plans. Among them, SK Hynix has been the most explicit—its chairman publicly disclosed that the company intends to double its wafer capacity over the next five years and double it again by 2034. This means that within less than a decade, one leading memory manufacturer will expand its capacity to four times its current scale, implying an enormous demand for lithography systems, etching tools, and thin-film deposition equipment.Once capacity expansion signals are confirmed, upstream equipment suppliers gain greater pricing power. From a broader perspective, UBS Group characterizes the current phase as the 'early stage of a super cycle' in the global semiconductor equipment market and forecasts the market size will reach $250 billion by 2028.[Share Link: For more opportunities in the semiconductor equipment supply chain, click here >>] In terms of individual stocks,ASML Holding’s biggest market catalyst this week was Elon Musk’s appearance at an internal virtual technology summit. ASML’s CEO stated plainly at the event that demand for AI infrastructure remains 'enormous,' and discussed Musk’s Terafab chip manufacturing initiative—which would require large-scale EUV lithography systems, with ASML widely seen as the...](https://nnqimage.futunn.com/sns_client_feed/999991/20260618/web-1781769669465-A0ATbrIR5y.png/big?area=2&is_public=true&imageMogr2/ignore-error/1/format/webp)
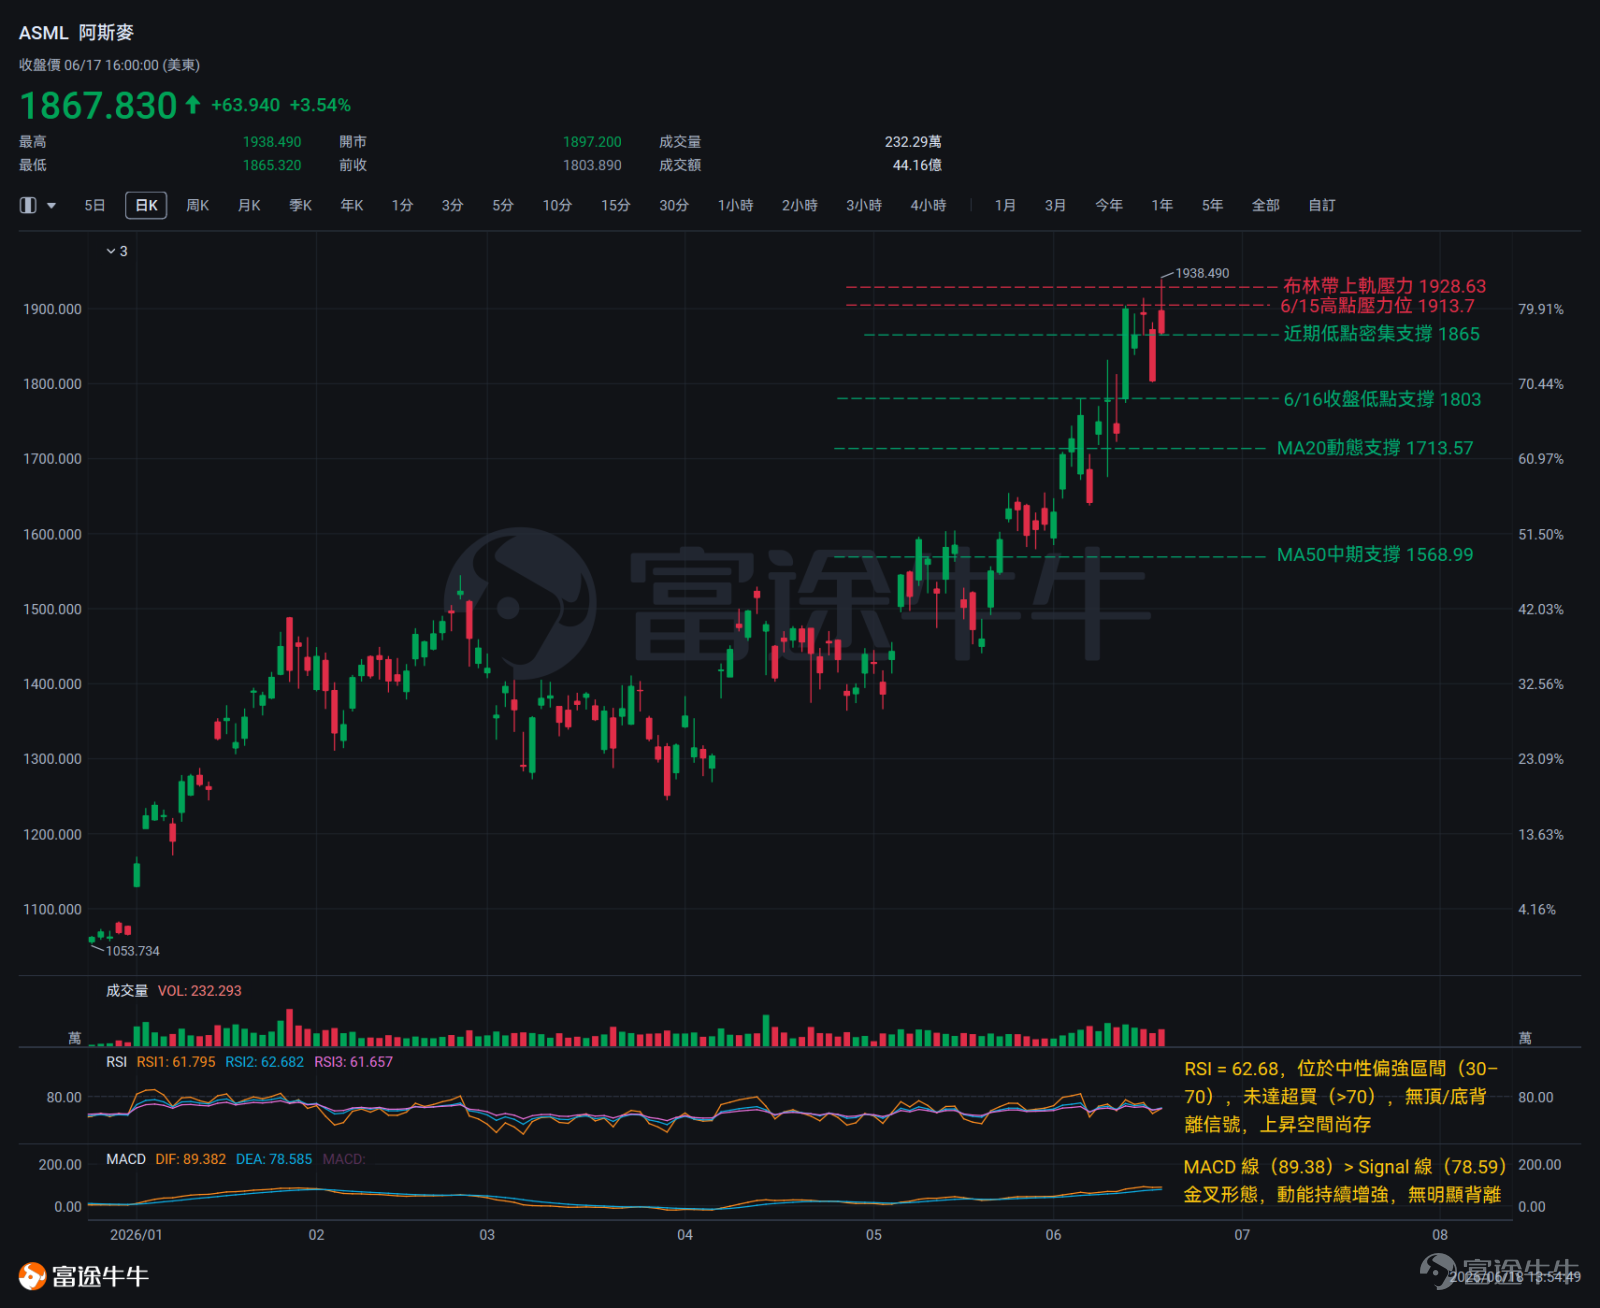
From a trend structure perspective,ASML Holding continues to maintain an upward trend.ASML’s closing price on June 17 at $1,867.83 was 9% above its 20-day moving average ($1,713.57) and 19% above its 50-day moving average ($1,568.99), with moving averages forming a classic bullish alignment. The MACD has formed a golden cross above the zero line, indicating a fully intact momentum structure. Since the low of $1,638 on June 5, the stock has rebounded by more than 14%.The short-term upward momentum is clear.
From the single-day price action,a strong bullish candle on June 11 significantly demonstrated buyers' strength, confirming the start of this rally phase.Subsequently, from June 11 to 12,two consecutive bullish candles extended the upward trend.However, the past three trading days (June 15–17) saw consecutive bearish closes,forming a potential short-term pullback signal.A notably large bearish candle appeared on June 16, reflecting a significant intraday decline; on June 17, a classic 'shooting star' pattern emerged within the $1,900–$1,940 high-volume trading zone,which carries short-term reversal warning implications. Close attention should be paid on June 18 to whether the intraday price momentum can sustain or if it shows signs of topping out after a rally.
Key Technical Indicators Interpretation
Moving Average (MA):The 20-day moving average (MA20) stands at $1,713.57 and the 50-day moving average (MA50) at $1,568.99; the current price remains well above both moving averages, exhibiting a bullish alignment and indicating a healthy short-to-medium-term trend structure.
RSI:The current reading is 62.68, below the overbought threshold (>70), with no bullish or bearish divergence signals; upside potential remains but is approaching the overbought zone.
MACD:The MACD line (89.38) is above the Signal line (78.59), forming a golden cross above the zero axis, indicating sustained strengthening momentum with no clear divergence.
Bollinger Bands:Price at $1,867.83 is trading between the middle band ($1,713.57) and upper band ($1,928.63), trending toward the upper band; volatility has expanded, and trend momentum continues to build.
Technical Comprehensive Analysis
There are currently three layers of support levels to monitor.The price level near $1,865 represents a cluster of recent lows over the past three trading days—June 12, 15, and 17—all of which found support in this zone, making it the most critical short-term support/resistance boundary.If this level is decisively breached, further short-term downside correction becomes likely.The next target to watch is $1,803.$1,803 marks the closing low from June 16 and serves as a strong short-term support level; if this level also fails, further attention will be needed.Whether the dynamic MA20 support ($1,713.57) can effectively hold becomes key.
On the resistance side,The upper Bollinger Band at $1,928.63 serves as the nearest dynamic resistance level.The intraday high of $1,938.49 on June 17 represents the most densely traded recent peak zone.If price can break above this level convincingly with increased volume and hold steady, the upward trend’s continuation will gain further confirmation.
Applied Materials (AMAT)
![The semiconductor equipment sector has shown strong momentum recently,$ASML Holding (ASML.US)$ and $Applied Materials (AMAT.US)$with both companies’ share prices reaching new all-time highs,driven by fundamental shifts on the demand side. Take memory chips as an example: Samsung, SK Hynix, and Micron collectively account for about 90% of the global DRAM market. All three have nearly simultaneously raised their capital expenditure plans. Among them, SK Hynix has been the most explicit—its chairman publicly disclosed that the company intends to double its wafer capacity over the next five years and double it again by 2034. This means that within less than a decade, one leading memory manufacturer will expand its capacity to four times its current scale, implying an enormous demand for lithography systems, etching tools, and thin-film deposition equipment.Once capacity expansion signals are confirmed, upstream equipment suppliers gain greater pricing power. From a broader perspective, UBS Group characterizes the current phase as the 'early stage of a super cycle' in the global semiconductor equipment market and forecasts the market size will reach $250 billion by 2028.[Share Link: For more opportunities in the semiconductor equipment supply chain, click here >>] In terms of individual stocks,ASML Holding’s biggest market catalyst this week was Elon Musk’s appearance at an internal virtual technology summit. ASML’s CEO stated plainly at the event that demand for AI infrastructure remains 'enormous,' and discussed Musk’s Terafab chip manufacturing initiative—which would require large-scale EUV lithography systems, with ASML widely seen as the...](https://nnqimage.futunn.com/sns_client_feed/999991/20260618/web-1781769669258-SiGcBGasCa.png/big?area=2&is_public=true&imageMogr2/ignore-error/1/format/webp)
Applied Materials is currently in an accelerating uptrend.The closing price of $592.92 is significantly above both the 20-day moving average ($492.38) and the 50-day moving average ($440.73), forming a complete bullish alignment with a solid trend foundation. The Bollinger Band width is notably expanding, indicating strong trending characteristics in the current market move.
The price action over the past ten days can be divided into two distinct phases for analysis.From June 4 to June 10, the stock established a low-range consolidation platform between $450 and $500:On June 5, a large bearish candle pushed the price down to $453; on June 8, a strong bullish reversal candle fully engulfed the prior decline, sending a clear signal of bullish participation. Starting June 11, the stock entered an acceleration phase—opening at $522 and closing at $552; on June 12, it continued rising to $567, with price and volume confirming the validity of the breakout above the consolidation platform.However, two consecutive bearish sessions on June 15 and 16 saw the price retreat after encountering selling pressure near the key psychological $600 level, forming a bearish harami pattern on June 16.The price tested the $599–$601 zone twice between June 15 and 16 but failed to break through both times; close monitoring of subsequent price action is warranted.
Key Technical Indicators Interpretation
Moving Average (MA):The 20-day moving average (MA20) is at $492.38, and the 50-day moving average (MA50) is also at $492.38. The stock price is above both moving averages, indicating a bullish alignment with a healthy trend structure.
RSI:The current RSI value is 73.4, placing it in overbought territory (>70). The current price has reached a recent new high, and the RSI is rising in tandem, with no bearish divergence signal observed yet.
MACD:The MACD line (40.86) is above the Signal line (30.89), forming a bullish crossover, indicating strengthening momentum, with no bearish divergence signal observed yet.
Bollinger Bands:The current stock price is trading between the middle Bollinger Band ($492.38) and the upper band ($598.17), closely hugging the lower edge of the upper band. The Bollinger Band width is expanding, reflecting increased volatility and clear trending market characteristics.
Technical Comprehensive Analysis
The overall support structure consists of three progressively layered levels.$567.25 serves as the nearest support level from the recent upward step (the closing price of the bullish candle on June 12).A decisive break below this level would confirm a bearish harami pattern, increasing the likelihood of a pullback toward the $552 zone.$552.64 marks the bottom of the bullish candle body that initiated the move on June 11. A break below this level would weaken the short-term structure, requiring attention to whether the MA20 ($492.38) can provide effective support.
On the resistance side,$600.91 and $623.35 form the core resistance zone.$600.91 was the intraday high on June 16; $623.35 was the intraday high on June 17, marking the top of this upward price range.A valid breakout above $600, followed by a close and sustained hold above that level, would signal potential for further upside continuation; a subsequent breakout beyond $623.35 could indicate accelerating bullish momentum.
![The semiconductor equipment sector has shown strong momentum recently,$ASML Holding (ASML.US)$ and $Applied Materials (AMAT.US)$with both companies’ share prices reaching new all-time highs,driven by fundamental shifts on the demand side. Take memory chips as an example: Samsung, SK Hynix, and Micron collectively account for about 90% of the global DRAM market. All three have nearly simultaneously raised their capital expenditure plans. Among them, SK Hynix has been the most explicit—its chairman publicly disclosed that the company intends to double its wafer capacity over the next five years and double it again by 2034. This means that within less than a decade, one leading memory manufacturer will expand its capacity to four times its current scale, implying an enormous demand for lithography systems, etching tools, and thin-film deposition equipment.Once capacity expansion signals are confirmed, upstream equipment suppliers gain greater pricing power. From a broader perspective, UBS Group characterizes the current phase as the 'early stage of a super cycle' in the global semiconductor equipment market and forecasts the market size will reach $250 billion by 2028.[Share Link: For more opportunities in the semiconductor equipment supply chain, click here >>] In terms of individual stocks,ASML Holding’s biggest market catalyst this week was Elon Musk’s appearance at an internal virtual technology summit. ASML’s CEO stated plainly at the event that demand for AI infrastructure remains 'enormous,' and discussed Musk’s Terafab chip manufacturing initiative—which would require large-scale EUV lithography systems, with ASML widely seen as the...](https://nnqimage.futunn.com/sns_client_feed/999991/20260618/web-1781770146472-ZftMmXu2Fn.png/big?area=2&is_public=true&imageMogr2/ignore-error/1/format/webp)
Risk Disclaimer: The above content only represents the author's view. It does not represent any position or investment advice of Futu. Futu makes no representation or warranty.Read more


Comments
to post a comment
15
25