
Focus on COMPUTEX 2026! Will the entire AI supply chain ignite?
Bull Bull Tech Intelligence Bureau | Jensen Huang Slams 'SaaSpocalypse' Fears—Has the Tide Fully Turned for Software Stocks Like Microsoft and Palantir?
Since late May, U.S. software stocks have rallied collectively. $Microsoft (MSFT.US)$Soared over 11% in three days, $Palantir (PLTR.US)$Up more than 28% cumulatively over five days.
At the Computex conference opening on June 1, NVIDIA CEO Jensen Huang delivered two key messages centered on 'software': First, Huang openly criticized the 'SaaSpocalypse' (SaaS apocalypse) narrative, clearly stating, 'The reality is precisely the opposite'—The vast number of agents emerging in the era of agentic AI will invoke significantly more tools than ever before, presenting a major opportunity—not a threat—for software companies in the AI era.He further cited data showing that AI-powered coding usage on GitHub skyrocketed from 300 million instances in 2023 to 1.4 billion by early 2026, asserting that AI will not reduce employment opportunities for software engineers and calling such concerns 'complete nonsense.'
In this edition of the Tech Intelligence Bureau, we return to price charts and technical indicators to assess whether software stocks have truly bottomed out and reignited a new uptrend.
Microsoft (MSFT)

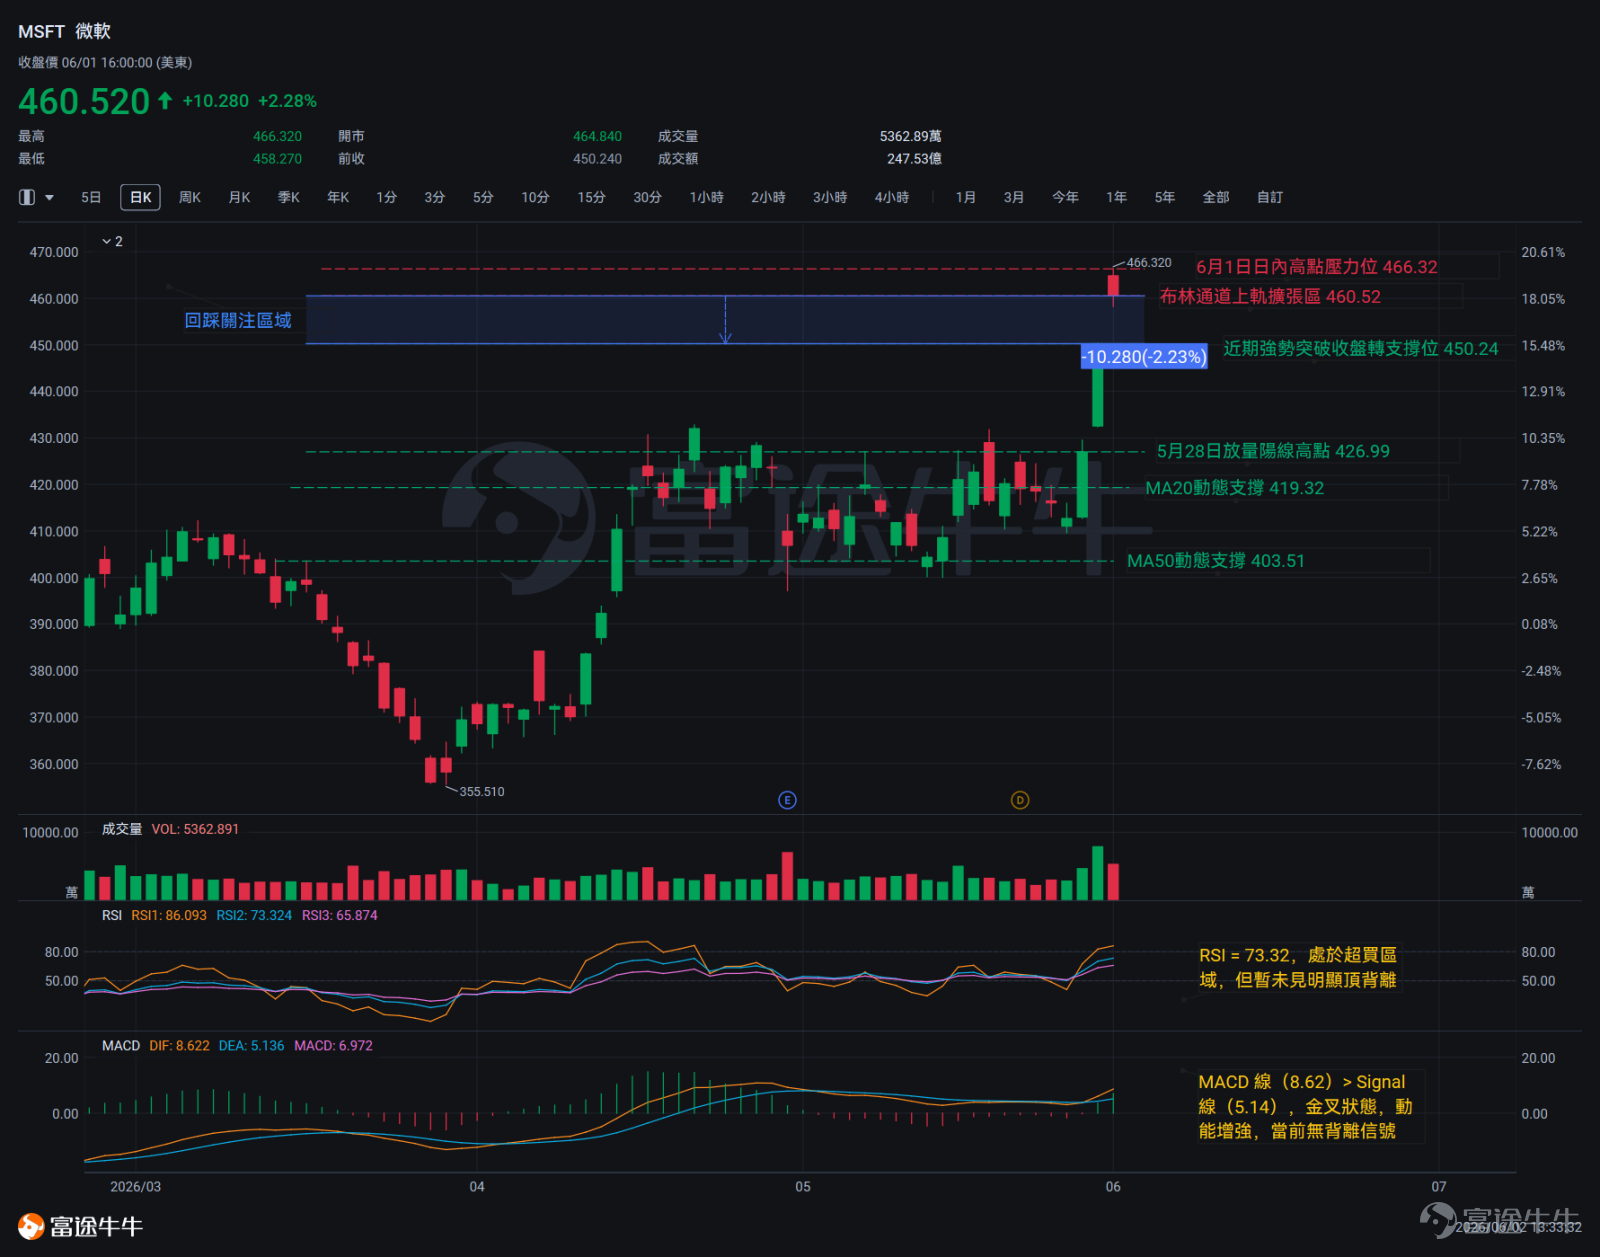
On May 27, Microsoft’s low was still around $409.58, followed by three consecutive days of gap-up openings with successive gains. By the close on June 1, the price had reached $460.52, marking a cumulative gain of over 11% in just three days. This price action exhibited one clear characteristic:May 28 saw a breakout on high volume, and on May 29, the stock gapped up at the open and rallied further, with strong alignment between price and volume—indicating a very clear bullish momentum and forming a classic bottom reversal continuation pattern.From a moving average perspective, the 20-day moving average currently sits at $419, while the 50-day moving average is at $403. Both lines are sloping upward, with the shorter-term average above the longer-term one—a configuration that indicatesa consistently bullish short-to-medium-term trend (bull-dominated).The current share price of $460 is $30–$40 above both moving averages,reflecting an overall strong structure.
However, it’s worth noting that on June 1, Microsoft’s stock hit an intraday high of $466.32 but ultimately closed at $460.52. The message is straightforward: as the price approached around $466,selling pressure began to intensify.After three consecutive days of sharp gains, this signal does not necessarily mean the rally is ending immediately, but it serves as a reminder that the current price is already near a short-term peak,with resistance ahead.
Key Technical Indicators Interpretation
Moving Average (MA):The 20-day moving average ($419.32) is above the 50-day moving average ($403.51), indicating a bullish alignment. The current share price is significantly above both moving averages, with both slopes expanding upward, suggesting near-term upside pressure and potential mean-reversion risk.
RSI:The current reading is 73.32, placing it in overbought territory (>70), though no clear bullish divergence signal is evident yet; continued monitoring of subsequent price action is advised.
MACD:The MACD line (8.62) is above the Signal line (5.14), maintaining a golden cross with strengthening momentum, and no clear bullish divergence is currently visible.
Bollinger Bands:The current share price ($460.52) has clearly moved beyond the upper Bollinger Band ($445.88). The Bollinger Bands are in an expansion phase, and the price is trading outside the upper band—a hallmark of a strong trending move.
Technical Comprehensive Analysis
Key levels to watch in the near term:the first strong support level at $450.24 (the high-volume breakout closing price on May 29)and whether it holds effectively; if broken, monitorwhether buying interest emerges at the second support level of $426.99.
Key resistance lies at USD 466.32 (the intraday high on June 1). Watch closely whether the stock can break above this level convincingly on increased volume; otherwise, there is short-term risk of a pullback.
Palantir (PLTR)

Palantir has posted gains for three consecutive trading sessions. Its current share price of $160.65 has risen well above both the 20-day moving average ($138.64) and the 50-day moving average ($141.89). The bullish engulfing pattern formed on May 28 marked the start of this rally—opening at $133.16, reaching an intraday high of $145, exhibiting extremely high volatility for the day, accompanied by a gap up,signaling strong bullish momentum.On May 29, the stock gapped up again at the open ($147.825) and surged further, fitting the pattern of 'consecutive strong bullish breakouts.' On June 1—the third bullish candle in this move—the gain narrowed compared to the prior two sessions and an upper shadow appeared, indicating pressure near the short-term high, yet the candle remained bullish,suggesting bulls have not yet lost control.
Key Technical Indicators Interpretation
Moving Average (MA):MA20 = USD 138.64, MA50 = USD 141.89. The MA20 has crossed above the MA50, maintaining a golden cross and forming a bullish alignment.
RSI:The current RSI stands at 69.97, extremely close to the overbought threshold of 70, but no clear bearish divergence has emerged yet. Monitor whether upward momentum can be sustained in the coming sessions.
MACD:The MACD line (2.1) is above the Signal line (-0.71), forming a golden cross with significantly strengthened momentum. No divergence signals are present at this time.
Bollinger Bands:The current share price of USD 160.65 has broken above the upper Bollinger Band (USD 153.59), exceeding it by approximately USD 7.06. Volatility is expanding, and the price is trading outside the upper band, reflecting a state of strong short-term upward momentum.
Technical Comprehensive Analysis
Key levels to watch in the near termThe support level at the $155.88 mark is critical; a break below could trigger a retest of the upper Bollinger Band area ($153.59), highlighting short-term pullback risks.
On the upside, monitor the stock pricefor a potential breakout above the recent high of $163.70 accompanied by sustained volume expansion. A breakout on declining volume warrants caution due to the risk of a false breakout.

Risk Disclaimer: The above content only represents the author's view. It does not represent any position or investment advice of Futu. Futu makes no representation or warranty.Read more


Comments (4)
to post a comment
39
73