
Hong Kong Market Barometer: CPO, PCB, and memory stocks rally in rotation! Are you on the right trai
Ping An Short-Term Analysis: Frequent signals indicate undervaluation; price consolidating near key levels awaiting directional confirmation
On May 22, Ping An (02318.HK) closed at HK$60.70, with its short-term price action in a phase of low-level consolidation. From the moving average perspective, the current share price is below the 10-day MA (HK$62.66), 20-day MA (HK$62.54), and 60-day MA (HK$62.74). All three key short-term moving averages are above the share price, indicating that the short-term trend remains weak and under pressure from major moving averages. Regarding Bollinger Bands, the middle band is around HK$62.54, the upper band near HK$65, and the lower band at approximately HK$57.60. The price of HK$60.75 sits in the lower-middle portion of the band but has moved off recent lows, suggesting the stock is attempting to stabilize gradually from its bottom. The Relative Strength Index (RSI) stands at 42, within a neutral yet slightly weak zone—neither overbought nor oversold. The five-day price amplitude is about 2.9%, reflecting moderate-to-narrow volatility and indicating short-term capital is adopting a wait-and-see stance. The five-day upside probability is approximately 46%, signaling unclear short-term direction.
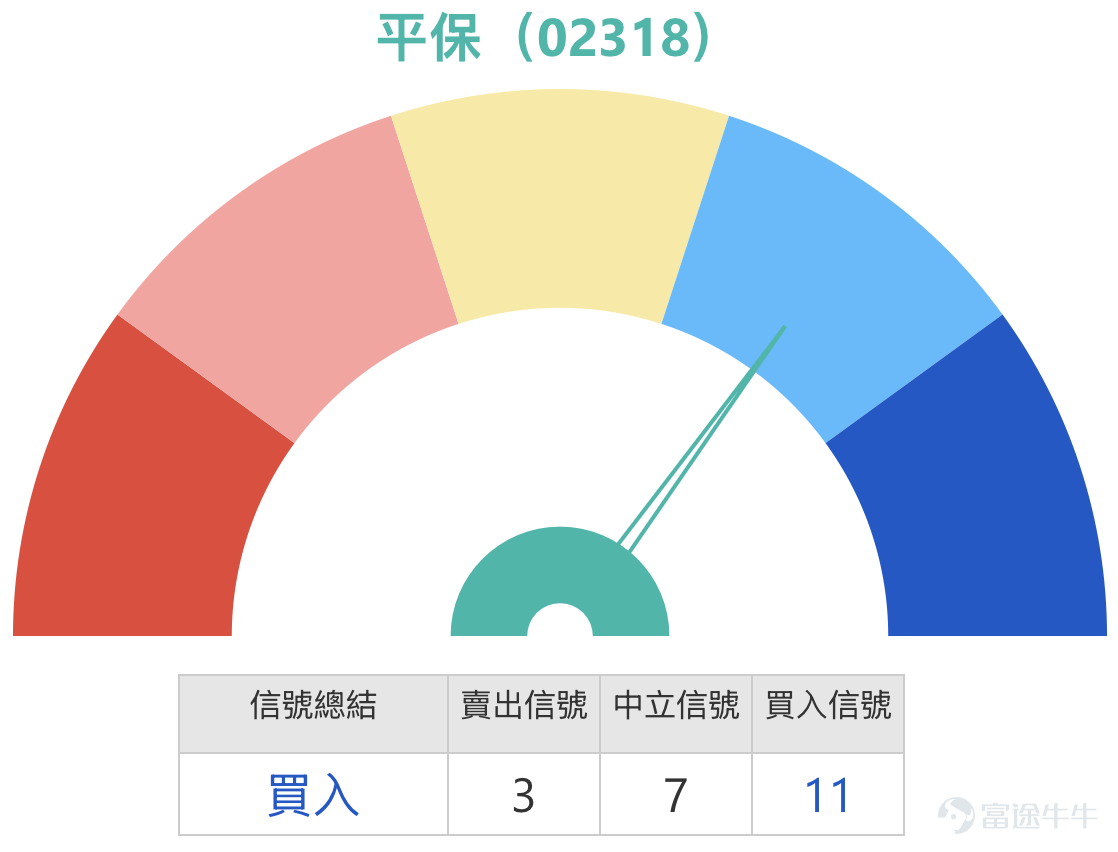
Among multiple oscillators, the Williams %R is in oversold territory and generating a buy signal; the Stochastic Oscillator also issues a buy signal; the CCI indicator is likewise in oversold territory and shows a buy signal. Multiple oscillators consistently point to technical rebound demand following oversold conditions, aligning with the price action that found support near HK$57.60 and began a gradual bounce. However, both the Momentum Oscillator and Rate of Change indicator issue sell signals. The Bulls vs. Bears Power indicator shows a buy signal, while MACD, Ichimoku Cloud, and Bollinger Bands all signal neutrality or sell. The overall technical signal is a buy, with a strength rating of 11, reflecting accumulating rebound momentum on the technical side, though short-term price action still needs to digest moving average resistance.
From a technical pattern perspective, the market displayed a 'Death Cross' chart pattern on May 22, where the 10-day moving average crossed below the 20-day moving average—a bearish signal from a technical analysis standpoint. However, technical analysis should only serve as an auxiliary tool and should not be the sole basis for trading decisions.

Support and Resistance Analysis
On the downside, HK$59.70 represents the first key support level. This level lies between the 60-day MA (HK$62.74) and the Bollinger Band middle band, making it a zone where short-term buying interest is likely to emerge if the price pulls back from current levels. Since May, the stock has repeatedly found support in the HK$59.70–HK$60.00 range, indicating strong market consensus around this area. HK$57.60 serves as the second line of defense, corresponding to the lower Bollinger Band and acting as a critical support zone near historical lows—making it a deeper short-to-medium-term defensive level. Should the price break below HK$59.70, attention will shift to HK$57.60 as the next key observation point.
On the upside, HK$63.50 is the most immediate resistance within the current technical framework. This level sits above both the 10-day MA (HK$62.66) and 20-day MA (HK$62.54). For the stock to transition from weakness to strength, it must first break through and stabilize above this level. HK$65.00 represents the second resistance level and coincides with the upper Bollinger Band, serving as a more aggressive short-term rebound target. In early May, the stock briefly traded above HK$65.00 and touched HK$66.00 before retreating, confirming notable technical resistance around the HK$65.00 area.
Considering the combined support and resistance structure, HK$60.75 sits between the HK$59.70 support and HK$63.50 resistance, indicating a phase of low-level consolidation. The current price remains below both the 10-day and 30-day moving averages, so the short-term structure has not yet turned bullish. However, multiple technical indicators—including Williams %R, Stochastic Oscillator, and CCI—consistently signal a need for a rebound following oversold conditions. Fundamentally, the stock remains solid (Q1 NBV grew by 20.8% and operating profit increased by 7.6%), suggesting limited downside risk. To confirm a short-term bullish reversal, the price needs to stabilize above HK$63.50.
Warrant Product Recommendations
On the call warrant side, BOCOM Call Warrant (24478) has a strike price of HK$72.93, leverage of 7.5x, and relatively low premium—suitable for investors who expect the underlying stock to consolidate within the HK$59.7–HK$63.5 range before gradually recovering and further testing the HK$65 level or higher. HSBC Call Warrant (25151) also carries a strike price of HK$72.93 but offers slightly higher leverage of 8.1x, with the lowest premium and implied volatility among comparable products—making it suitable for more aggressive positioning by investors anticipating a breakout above the HK$63.5 resistance and a continuation of the rebound.
On the put warrant side, BNP Paribas Put Warrant (24209) has a strike price of HK$55 and high leverage of 20.7x, offering the lowest premium. Its strike price is set below the second support level at HK$57.6, making it a deeply out-of-the-money put warrant—ideal for investors expecting the stock price to stall near the HK$63.5 resistance and retreat. The high leverage provides pronounced sensitivity to even modest declines in the underlying stock. $BIPINAN@EC2612A.C (24478.HK)$$BPPINAN@EP2607A.P (24209.HK)$$HSPINAN@EC2612A.C (25151.HK)$

Regarding bull certificates, Société Générale Bull Certificate (66165) $SG#PINANRC2810C.C (66165.HK)$ has a call price of HK$56, leverage of 14.6x, high effective leverage, and low premium. The call price is set below the second support level at HK$57.6, providing a reasonable safety margin—suited for investors expecting the stock price to hold steady within the support zone between HK$59.7 and HK$57.6 and gradually rebound. HSBC Bull Certificate (56559) has a call price of HK$57, leverage of 19.2x, and the lowest premium among comparable products, delivering higher effective leverage and stronger gearing—ideal for investors with strong confidence in Ping An’s short-term rebound who also wish to retain greater operational flexibility.
On the bear certificate side, UBS Group Bear Certificate (55083) $UB#PINANRP2804E.P (55083.HK)$ has a call price of HK$70, leverage of 5.8x, the lowest premium, and relatively high effective leverage. The call price is set above the second resistance level at HK$65, offering a buffer zone. Should Ping An’s share price rebound to the HK$63.5–HK$65 range and then retreat, this bear certificate would effectively reflect downward pressure on the underlying stock, serving as a short-term tactical tool for scenarios involving rejection at resistance levels. HSBC Bear Certificate (56116) has a call price of HK$71, leverage of 5x—the highest effective leverage among peers—and a relatively low premium, offering investors alternative choices in terms of leverage and call price levels.
Overall, Ping An currently exhibits a technical structure characterized by 'low valuation, multiple-bottom signals, and moving average suppression.' The stock trades below both the 10-day and 30-day moving averages, indicating short-term technical weakness; however, multiple oversold indicators consistently point to an imminent rebound. Solid Q1 earnings—with new business value growing by 20.8%—provide a fundamental basis for medium- to long-term performance. Management explicitly stated at the annual general meeting that the current share price is undervalued, and major brokerages have largely maintained positive ratings with target prices significantly above the current level, offering solid fundamental support. In terms of short-term strategy, range-bound trading remains the primary approach: holding above the HK$59.7 support opens the possibility of a rebound toward the HK$63.5 resistance; a decisive breakout and close above HK$63.5 would create conditions for a further test of HK$65; conversely, a break below HK$59.7 would shift focus to the next support at HK$57.6.
Friendly reminder: This article does not constitute any investment advice. It is for reference only and does not constitute any form of investment recommendation. The market data, opinions, and analysis contained herein may change at any time without prior notice. We assume no responsibility for any loss or damage caused by reliance on the information in this article. Technical analysis only shows whether certain technical conditions are met; a comprehensive evaluation of asset performance should be conducted using additional data. Trading decisions should not be made solely based on this article. Please note that past performance is not indicative of future results. Follow Jenny's Warrants HKEX column for more professional insights.
Risk Disclaimer: The above content only represents the author's view. It does not represent any position or investment advice of Futu. Futu makes no representation or warranty.Read more

Comments
to post a comment
1