
The US-Iran peace talks present conflicting narratives! What’s next for oil prices?
CNOOC has retreated to the support zone, with a clear defense level but no signs of regaining strength yet
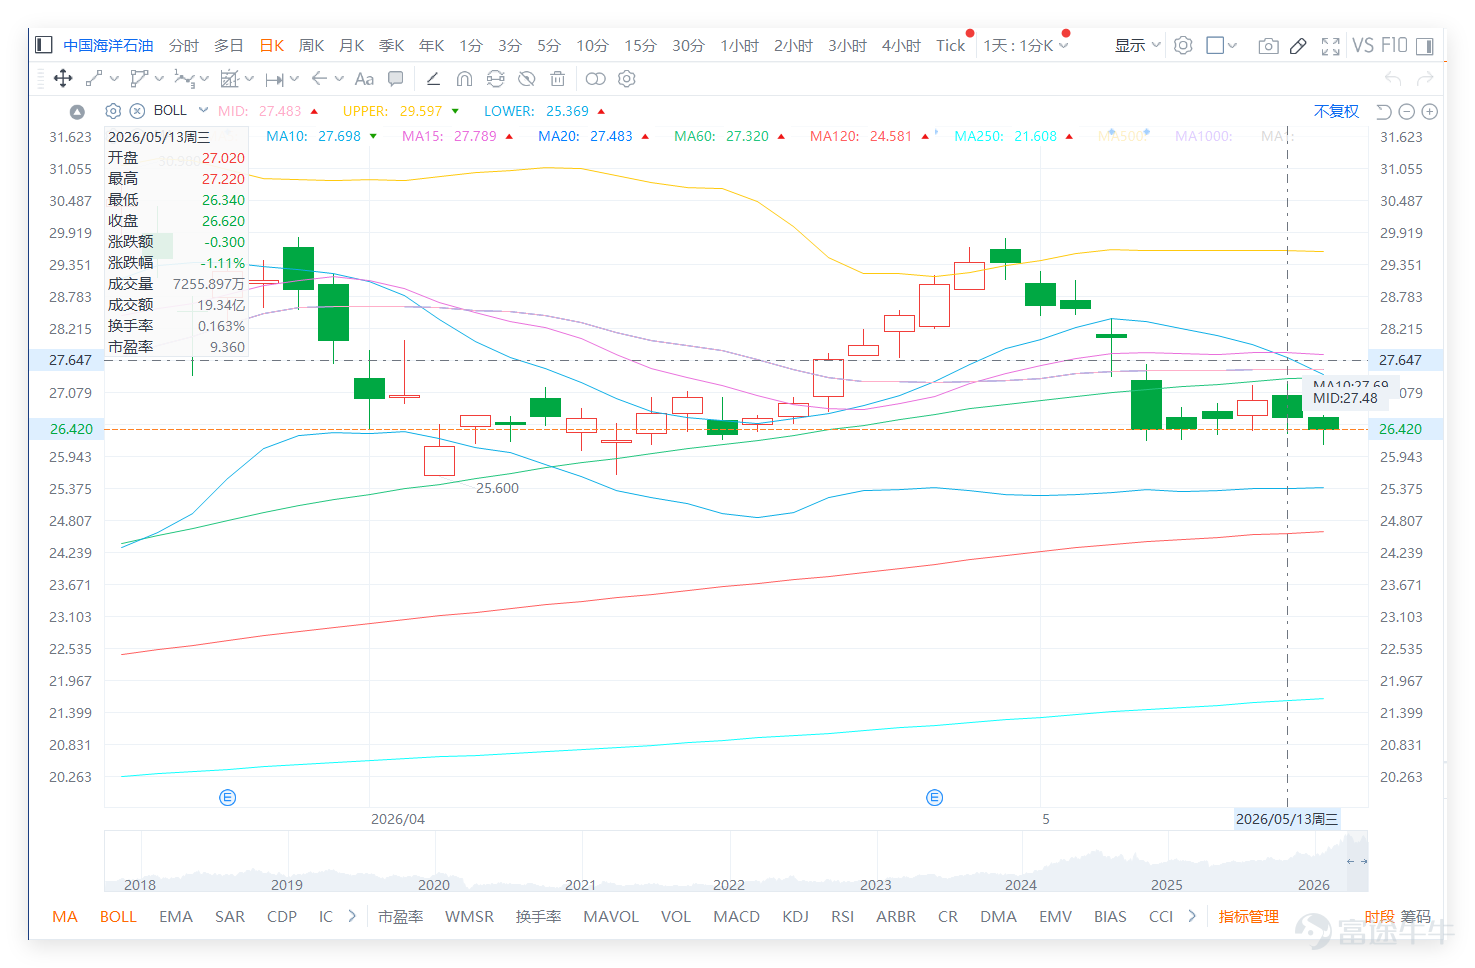
$CNOOC (00883.HK)$ The closing price on the previous day (13th) was 26.620, representing a single-day drop of 1.11%, and the short-term trend remains weak. The stock price had risen from around 20.540 to 30.980 earlier, showing significant gains at its peak, before retreating to the current range near 26. From the daily chart structure, CNOOC has transitioned from an uptrend earlier to a pullback consolidation phase. The current price is close to the recent support zone, and the most important factor in the short term will be whether the 26.42 to 26.62 range can hold.

CNOOC's technical signal is 'neutral', with an RSI of approximately 44, which is within a moderately low neutral range. In comparison with the other 'three oil giants' in the industry, $PETROCHINA (00857.HK)$ Closed at 11.06, with an RSI of approximately 54, and the technical signal is 'neutral'; $SINOPEC CORP (00386.HK)$ Closed at 4.65, with an RSI of approximately 50, and the technical signal is also 'neutral'. This indicates that the entire oil and gas sector is currently in a synchronized pullback with a 'neutral' technical outlook. CNOOC is not weakening alone but rather entering a consolidation period following profit-taking at higher levels, together with PetroChina and Sinopec. For the sector to regain strength, it will be crucial to observe whether PetroChina can defend the 10.8 to 11 yuan support zone and whether Sinopec can stabilize above the 4.6 yuan level.

Technically, yesterday's closing price of 26.620 was below the 10-day moving average of 27.698, the 20-day moving average of 27.483, and the 30-day moving average of 27.405, indicating that the stock has broken through key short-term moving averages and the short-term structure has clearly weakened. In this situation, even if the stock rebounds near 26 yuan, it should only be considered as a post-decline recovery for now, rather than a sign of renewed strength. To improve the trend, the stock would first need to break back above the cluster of moving averages around 27.4 to 27.7 before confirming a sustained rebound.
Regarding the Bollinger Bands, the middle band is at 27.483, the upper band is at 29.597, and the lower band is at 25.369. The current price is below the middle band but still above the lower band, reflecting that the stock has not reached extreme oversold conditions, though it has entered a weaker range. If the support near 26.42 fails, the next key support to watch will be at 25.369. If the price can hold near 26 and gradually recover, initial resistance would be seen at 27.483 to 27.698.
The Relative Strength Index (RSI) is around 44, placing it in a weaker zone, close to oversold levels but without clear signs of a rebound. This suggests short-term selling pressure remains, though downward momentum is approaching levels that may require a correction. For short-term trading, these levels aren't completely off-limits for buying, but one must wait for signs of stabilization and not rush into heavy positions just because the stock is near a support level.
In terms of trading volume, there has been no strong rebound recently, reflecting that funds are still relatively cautious for now. For the stock price to turn bullish again, we need to see a simultaneous increase in trading volume during the rebound. If it's just a low-volume bounce, the stock may face pressure again near 27.4 to 27.7.
Regarding investor sentiment, among bullish comments, there are extremely aggressive ones like 'all-in with margin financing,' while others are more moderate, such as 'starting to accumulate a little around 26' and 'buying 883 is not wrong.' This reflects that the market still has confidence in CNOOC, especially after the stock price retreated to around 26, where some investors started to view it as a good buying opportunity. However, whether it’s really worth accumulating near 26 depends on whether 26.42 can hold, and whether the stock price can rise back above 27.4.
Bearish comments focus more on risk control, such as stopping losses if it breaks below 26.42, or the possibility of a sharp drop after a large previous rise. Technically speaking, 26.42 is close to a short-term support level, and if it falls below and fails to recover quickly, there could be a retest of the 25.369 level. As for whether it will 'crash,' there aren’t enough signals yet, but a pullback after a rise has already occurred, and the risk of a weakening trend cannot be ignored.
Observational comments reflect market confusion over the pullback in oil stocks, with some asking whether they should enter now or wait for volatility before opening positions. This sentiment shows that the market is still seeking a new equilibrium at this stage. Unlike fast-rising tech stocks driven by sentiment, CNOOC depends more on oil prices, dividends, defensiveness, and capital allocation. In the short term, technical levels remain the most direct basis for judgment.
In terms of short-term attractiveness, CNOOC’s current price falls into a neutral-to-low observation zone, but it’s not suitable for heavy positions or leveraging. The reason is that the stock price has broken below multiple moving averages, and the rebound confirmation is insufficient; however, it’s also not far from the lower band at 25.369. If it can hold above 26.42 and rebound, there is indeed room for a corrective rally. A more prudent approach would be to observe with small positions, or wait for confirmation after breaking back above 27.483. If it breaks below 26.42, optimism should be reduced.
Overall, China National Offshore Oil Corporation (CNOOC) is currently in a support testing phase following a pullback. The range between 26.42 and 26.62 serves as the first line of short-term defense, while 25.369 is a key support level below. The range between 27.4 and 27.7 represents resistance that must be overcome before considering a renewed uptrend. Before rising back above 27.7, it shouldn’t be considered a renewed uptrend; similarly, before falling below 25.369, excessive pessimism should be avoided. At this stage, the most reasonable strategy is to wait for confirmation of support rather than rushing to build heavy positions.
Latest update (May 14 morning):
CNOOC's latest price is 26.4 yuan, down approximately 0.83%. This indicates the stock is still struggling near the support zone between 26.42 and 26.62, showing no significant rebound momentum. In the short term, it’s important to closely monitor whether it can stabilize around 26.4 yuan to avoid further testing of the 25.369 support.
Reply to some investors' views:
@@日日輸爆廠All-in with margin financing.
The current price is close to the support zone, but the stock remains below several moving averages, making it unsuitable for going all-in or using margin for heavy positions. If it breaks below 26.42, risks will increase significantly.
@@大口仔必勝Around 26, consider accumulating small amounts gradually.
Near 26 yuan, it might be worth observing for potential accumulation, but it’s better to wait until 26.42 holds firm or see rebounding volume. Gradual position building is more prudent than a large single investment.
@小毒物167If it breaks below 26.42, cut losses and exit.
26.42 is a practical short-term defensive level. If it breaks below and fails to recover, the next support to watch is 25.369; this stop-loss strategy is reasonable.
Based on the above analysis, the strategies for deployment can be divided into the following main approaches:


For more market analysis, stay tuned to Jenny's daily updates on 'Hong Kong Stock Warrants'!
Reminder: This article does not constitute any investment advice.
This article is for reference only and does not constitute any investment advice. Market data, opinions, and analysis contained herein may change at any time without prior notice. We are not responsible for any loss or damage caused by reliance on the information in this article. Technical analysis only shows whether certain technical conditions are met; asset performance should be comprehensively evaluated using other sources of information, and trading decisions should not be made solely based on this article. Please note that past performance is not indicative of future results.
#Hong Kong Stocks #CNOOC #Real-time Analysis #Warrants Selection #Warrants Strategy #Derivatives Hedging #HK Stock Warrants by Jenny #Blue Chip Stocks #Technical Analysis
Risk Disclaimer: The above content only represents the author's view. It does not represent any position or investment advice of Futu. Futu makes no representation or warranty.Read more

Comments
to post a comment
1