
PDD Holdings reported Q1 revenue of RMB 106.2 billion—has its share price already hit bottom?
After Tencent's earnings, its stock rose over 2%. Should we continue to focus on defense in the short term?
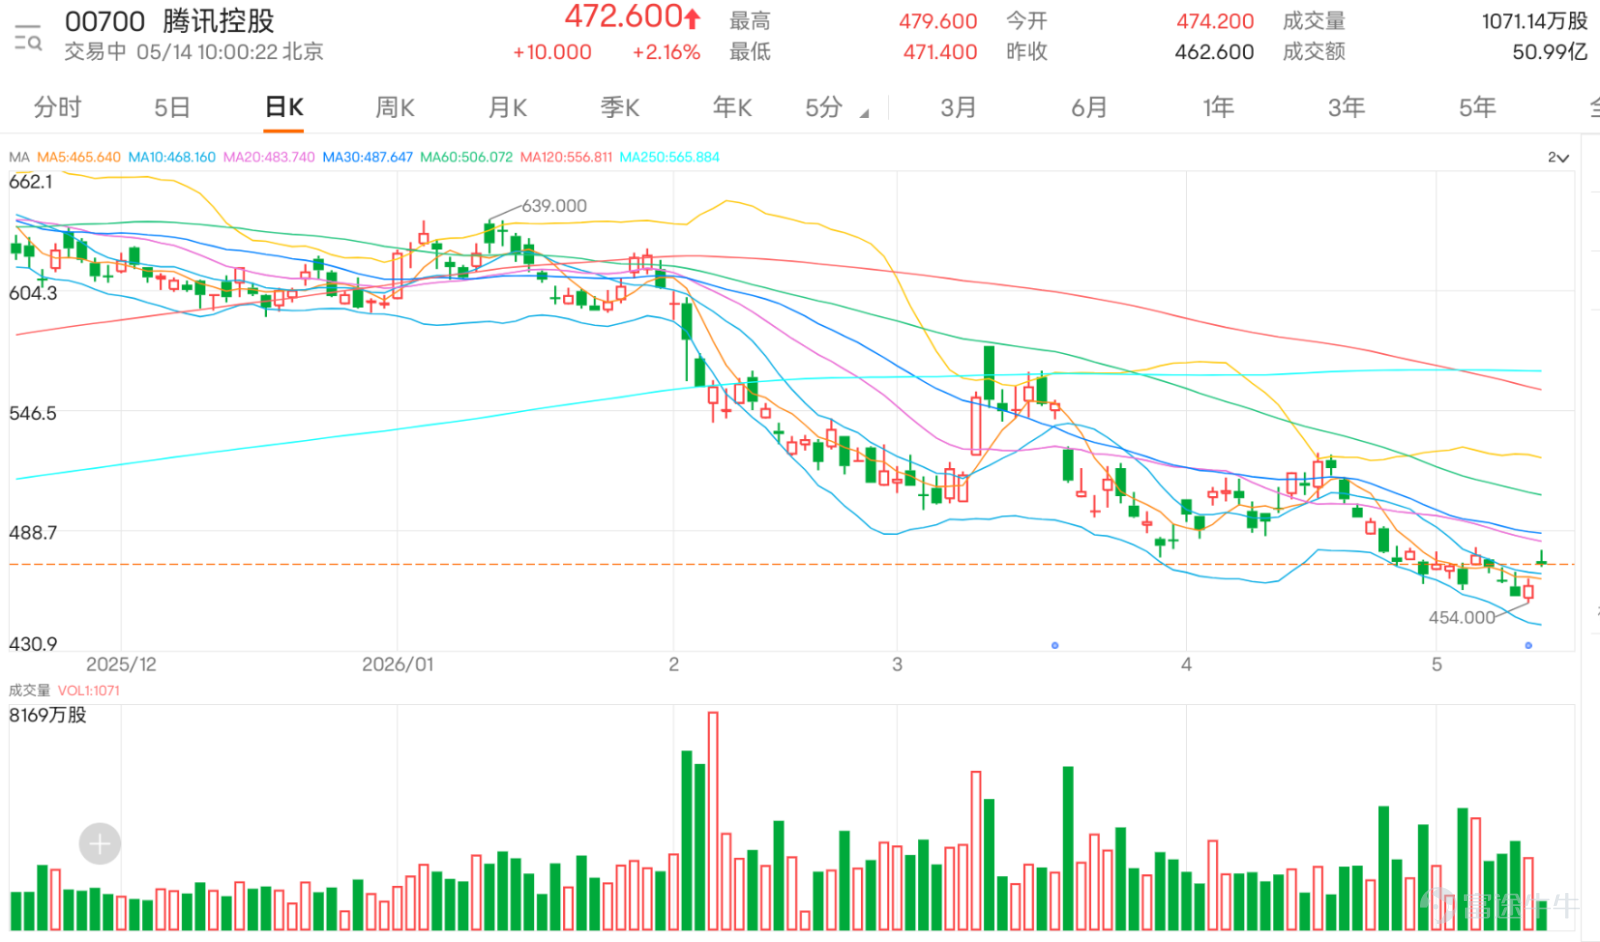
$TENCENT (00700.HK)$ The current price is HK$472.6, and the overall trend is still in a downtrend. Observing from the daily chart structure, the stock price has been continuously retreating from a high of around HK$639. Although there have been rebounds, it has consistently failed to return above key moving averages, reflecting a weak medium-term trend. The recent movement has gradually approached previous lows, with no clear signs of strengthening in the short-term structure.
In terms of Bollinger Bands, the middle band is around 485.060, the upper band at 525.551, and the lower band at 444.569. The current price has fallen below the middle band and is gradually approaching the lower band, suggesting that the market remains in a weak range. Unless the stock price can rise back above and stabilize at 485.060 (the middle band), the overall pattern will remain one of weak rebounds followed by declines, rather than a genuine trend reversal.
Regarding the moving average structure, the 10-day line is around 468.820, the 20-day line around 485.060, and the 30-day line around 488.340. The current price is below all these short- to medium-term moving averages, and the moving averages are arranged in a downward order, which represents a typical weak structure. This arrangement implies that even if there are rebounds, most are likely to be technical corrections that fail to change the overall downward trend.
The Relative Strength Index (RSI) is around 38 to 39, situated in a relatively weak zone but not yet in an extremely oversold condition. This indicates that there is still room for further downside in the market, while also implying limited strength in short-term rebounds. Only when the RSI moves back above 50, accompanied by the price returning above the middle band, can it be considered a clear improvement in momentum.
From a technical perspective, the key level at 454 represents a recent low area, which the price has approached multiple times, making it an important short-term support. If 454 is breached, the structure will weaken further, potentially opening up downside space. Above, the 468 to 485 range serves as the primary resistance zone, especially 485, where the midpoint and the 20-day moving average overlap, making it critical for a potential trend reversal.
For short-term strategies, the current risk-reward ratio is relatively low. The reason is that the stock price is in the middle of a weak range, neither reaching an extreme oversold support area nor showing breakout signals. A more reasonable approach would be to wait for two scenarios: first, for the price to fall near 454 with clear signs of stabilization before considering a rebound; second, for the price to break through 485 and stabilize, confirming structural improvement before following the upward trend. Entering now poses unfavorable risk-reward conditions.
In terms of investor sentiment, there is noticeable divergence, but overall, the bias leans towards 'seeking rebounds within weakness.' Some investors still hold aggressive targets, such as 500 or even above 600, which reflect long-term or emotionally driven expectations rather than being based on the current technical structure. Others believe that the price could rebound as long as trading volume supports it, indicating the market is still searching for reasons to rebound.
On the other hand, bearish voices are closer to the realistic trend, pointing out pressure at highs, increased selling pressure towards the close, and the possibility of further downward tests. These views align well with the current technical structure, as the overall trend remains unchanged.
Cautious sentiment is quite evident, such as phased buying, referencing 420 as the next buy point, and concerns about post-earnings performance. This reflects a lack of confidence in the market, with investors generally unwilling to take heavy positions at the current price and instead waiting for clearer direction or lower prices.
Overall, Tencent remains in a weak structure, with rebounds failing to change the trend and capital inflows yet to improve significantly. Until the price moves back above 485, the short-term focus should remain on defense and patience rather than prematurely predicting a trend reversal.

Short-term strategy assessment: The stock remains in a consolidation phase after a rebound, without showing full strength yet. It's suitable for both low-absorption and breakout preparations.
For call warrants, consider paying attention to $DSTENCT@EC2709A.C (28937.HK)$ With a strike price of HK$550, this product offers a leverage of 3.5x, which is the highest among similar products listed in the table. Meanwhile, its premium and implied volatility are at the lowest levels, making it suitable for investors who are optimistic about the market outlook and want to manage risk with relatively lower costs.
For put warrants, there are two products that can serve as references. $HSTENCT@EP2608B.P (27511.HK)$ With a strike price of HK$428.68, the leverage is approximately 9x, and both its premium and implied volatility are the lowest among similar products, indicating a relatively stable structure. $UBTENCT@EP2608B.P (26702.HK)$ The strike price is also HK$428.68, with a leverage of 8.6x, and the implied volatility remains relatively low, making it suitable for bearish market strategies with an emphasis on managing volatility risks.
Among the bull certificate options, $JP#TENCTRC2611D.C (65180.HK)$ And, $SG#TENCTRC2612B.C (58898.HK)$ The recovery prices are both at 445 yuan, with leverage of approximately 22x and 22.6x respectively. Both have the advantage of higher leveraged price positioning, with Societe Generale’s bull certificate offering higher actual leverage and lower premium, making it attractive for investors optimistic about a short-term rebound and willing to bear recovery risks.
As for bear certificates, $BI#TENCTRP2812E.P (56465.HK)$ Recovery price at 532 yuan, leverage around 6.8x; $JP#TENCTRP2810H.P (61823.HK)$ Recovery price at 538 yuan, leverage around 6.7x. Both have relatively high leverage positioning, with J.P. Morgan's bear certificate having the highest actual leverage among similar products and also a lower premium, making it suitable for those with a bearish view who want to hedge risks more efficiently.

Investor Comment Replies
@預測過去: Even if trading volume increases upon returning above 600, it will still need to break through and stabilize above 485; otherwise, the rebound remains weak and insufficient to support significant upward movement.
@33848019: 500 is the upper resistance zone, and the current price remains below multiple moving averages. A short-term breakthrough between 468 and 485 is needed for an upward test.
@沖沖沖: 467 is near the 10-day moving average line. If it fails to stabilize above that level, the structure hasn’t improved yet, indicating the stock has not escaped its weak position.
@艾力克: The 468 to 485 range is the main resistance zone; until broken through, upward movement will likely face resistance.
@My888: 500500 is the key upper resistance zone. It needs to first break through and stabilize above 485 before there can be conditions for further upward testing.
Feel free to share your insights in the comment section. For more market analysis, please continue following ‘Hong Kong Stock Warrants Jenny’ for daily updates!
Reminder: This article does not constitute any investment advice.
This article is for reference only and does not constitute any investment advice. Market data, opinions, and analysis contained herein may change at any time without prior notice. We are not responsible for any loss or damage caused by reliance on the information in this article. Technical analysis only shows whether certain technical conditions are met; asset performance should be comprehensively evaluated using other sources of information, and trading decisions should not be made solely based on this article. Please note that past performance is not indicative of future results.
#HKStocks #Real-TimeAnalysis #WarrantSelection #WarrantGuide #DerivativesHedging #HKWarrantsJenny #Tencent #00700 #Blue-ChipStocks #TechnicalAnalysis$Hang Seng Index (800000.HK)$$Hang Seng TECH Index (800700.HK)$
Risk Disclaimer: The above content only represents the author's view. It does not represent any position or investment advice of Futu. Futu makes no representation or warranty.Read more
Comment (1)
to post a comment