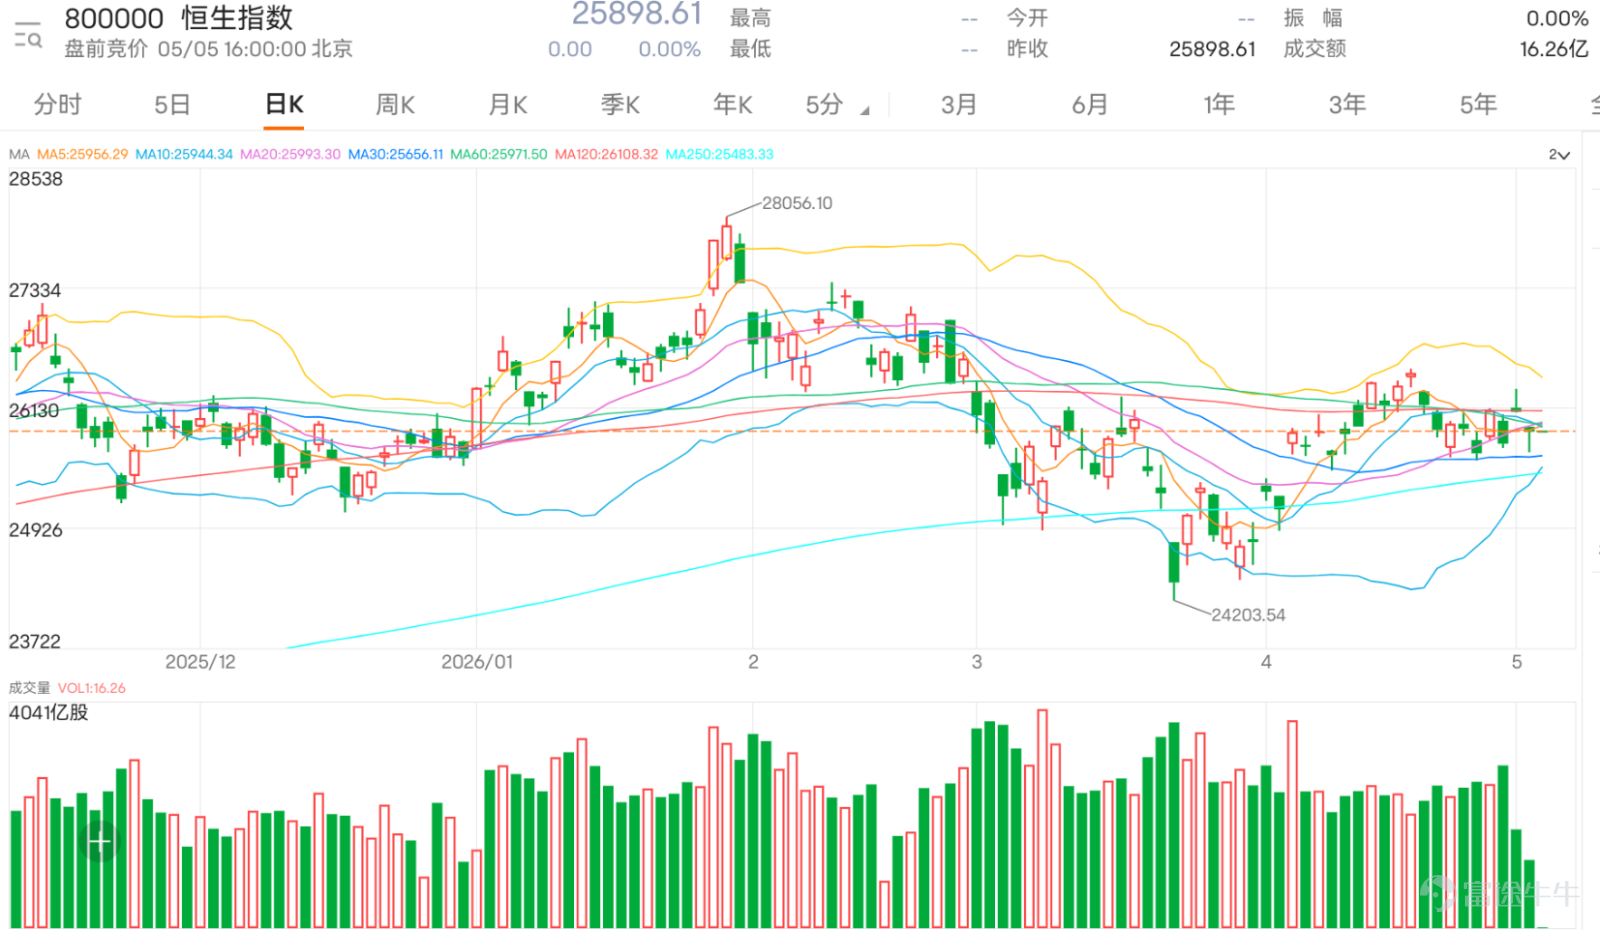

The Hang Seng Index fell below 26,000, but the market focus is not actually on the drop, but rather on 'why it can't rise.'
$Hang Seng Index (800000.HK)$ The previous day's close was at 25,898 points, breaking below the 26,000 mark. Market sentiment has clearly weakened. However, from investors’ comments, the core issue is not the single-day decline but disappointment and distrust towards the overall structure.
From the concentrated commentary, a highly consistent sentiment can be observed: the market generally believes that Hong Kong stocks 'follow declines but not gains'. Even as external markets like the US, Japan, and South Korea continue to hit new highs, the Hang Seng Index still fails to follow, or even moves in the opposite direction, causing capital flows and market positioning to be questioned anew.
This sentiment extends into two directions.
First, there is a rejection of the fundamental structure. Many investors directly point out that the index lacks core companies with profitability or growth potential. Even if individual stocks are hyped up, it is difficult to sustain an overall upward trend for the index. This view reflects that the market has gradually shifted from short-term trading to questioning the 'investability' rather than simply attributing it to technical adjustments.
Second, there is a conspiratorial interpretation of market mechanisms. For example, phrases such as 'suppressing the market to prevent rises', 'waiting for southbound capital to return before moving', and 'too many bull contracts so it won’t rise' have appeared frequently, indicating that retail investors interpret price behavior as being manipulated rather than driven by natural supply and demand. Such sentiment typically arises during sideways or weak consolidation periods because prices lack direction, which amplifies uncertainty.
However, a small number of voices suggest that the short-term trend is merely a timing issue, such as waiting for southbound capital to return or for night futures to stabilize before rebounding. Some even expect sudden sharp rises or falls at any moment, indicating that the market isn’t unilaterally bearish but rather highly divided.
When comparing this sentiment structure with the technical position, you will find that the two are highly consistent.
At the current price of 25,898, the market is exactly below the Bollinger Bands midline at 25,954 and lower than the 10-day moving average of 26,003, indicating that the market is indeed in a weak consolidation phase rather than a trending upward movement. Meanwhile, the Relative Strength Index (RSI) is approximately 47, failing to rise above 50, further confirming insufficient momentum, fully aligning with the market’s perception of 'unable to rise.'
More crucially, it’s the structure of trading. Recent trading volumes have contracted, with neither declines nor rebounds showing much follow-through. This is the essence of what investors describe as 'choppy ups and downs' — not simply due to downward pressure from certain players but rather because overall capital lacks direction, and the market has entered a wait-and-see state.
Therefore, the real contradiction in the current market phase is not about bullish or bearish views, but rather 'lack of direction.'
Under such circumstances, key technical levels become even more important.
The short-term watershed lies at 25954 (Bollinger Bands midline) and 26003 (10-day moving average). Unless these levels are reclaimed, all rallies should be regarded as consolidations within a weak structure, unlikely to change the bearish trend. Only when the market stabilizes above these levels can it reverse the current perception of being unable to sustain upward momentum and test the resistance zone at 26542.
Conversely, if the support at 25,690 is broken, market sentiment could shift from 'disappointment' to 'confirmed weakness,' at which point 25,365 will become the next testing area. Meanwhile, the significant concentration of capital in bullish warrants will exacerbate volatility.
Overall, the pessimism, skepticism, and divergence reflected in market commentary are not signs of excessive sentiment but rather highly synchronized with the current technical structure.
The short-term betting ratio remains neutral to slightly low. Before reclaiming 25954 and 26003, the market will likely remain in a tug-of-war pattern with an unclear direction. The strategy should focus on waiting for a breakout rather than prematurely betting on a one-sided move within the range.

Key deployment: Holding above 25690.36 may offer a chance for a rebound; breaking back above 25954.20 and 26003.23 would signal strength. If 25690.36 is breached, downside risk extends to test 25365.94.
Strategy One | Hold above 25690.36 for a rebound
$UB#HSI RC2812P.C (56728.HK)$ | Recovery price 25600 | 76.2x leverage | Close to support level, high flexibility, suitable for short-term rebound bets after confirmation of stability $BP#HSI RC2811O.C (57029.HK)$ | Recovery price 25600 | 80.9x leverage | Higher leverage, suitable for aggressive capture of early rebound gains $DS#HSI RC2811N.C (57544.HK)$ | Recovery price 25600 | 76.2x leverage | Also a highly flexible option, suitable for quick in-and-out short-term trades, not advisable for prolonged holding
Strategy Two | Reclaim 26003.23 to chase strength
$UB#HSI RC2810E.C (56201.HK)$ | Recovery price 25500 | 60.2x leverage | Slightly lower recovery point, suitable for chasing momentum after a breakout while maintaining some defensive distance $BP#HSI RC2811F.C (57229.HK)$ | Recovery price 25,500 | 61.7x leverage | Balanced leverage and distance, suitable for following up after breaking through the watershed $DS#HSI RC2810B.C (56453.HK)$ | Recovery price 25,500 | 60.2x leverage | Moderate-high flexibility, suitable for short-term trend-following deployment after breakout confirmation
Strategy Three | Aiming for downside test at 25,365.94 upon loss of 25,690.36
$UB#HSI RP2804H.P (67143.HK)$ | Recovery price 26,650 | 27.8x leverage | Recovery point further above, suitable for relatively safe short positioning after support breaks $HS#HSI RP28047.P (67031.HK)$ | Recovery price 26,650 | 27.8x leverage | Leverage not extreme, suitable for bearish deployment without being too close to the price $GJ#HSI RP2803X.P (57371.HK)$ | Recovery price 26,650 | 27.8x leverage | Adequate defensive distance, suitable for capturing extended downside after a breakdown
Feel free to share your insights in the comment section. For more market analysis, please continue following ‘Hong Kong Stock Warrants Jenny’ for daily updates!
Reminder: This article does not constitute any investment advice.
This article is for reference only and does not constitute any investment advice. Market data, opinions, and analysis contained herein may change at any time without prior notice. We are not responsible for any loss or damage caused by reliance on the information in this article. Technical analysis only shows whether certain technical conditions are met; asset performance should be comprehensively evaluated using other sources of information, and trading decisions should not be made solely based on this article. Please note that past performance is not indicative of future results.
#HongKongStocks #RealTimeAnalysis #WarrantSelection #WarrantGuide #DerivativesHedging #HongKongWarrantsJenny #HangSengIndex #HangSengTechIndex #BlueChipStocks #TechnicalAnalysis
Risk Disclaimer: The above content only represents the author's view. It does not represent any position or investment advice of Futu. Futu makes no representation or warranty.Read more

Comments
to post a comment
2
1