
English
Back
Open Account
港股窩輪Jenny
wrote a post · Apr 30 10:41

HSBC Holdings remains stable during consolidation at higher levels, with 141.66 being the key for a short-term breakthrough.

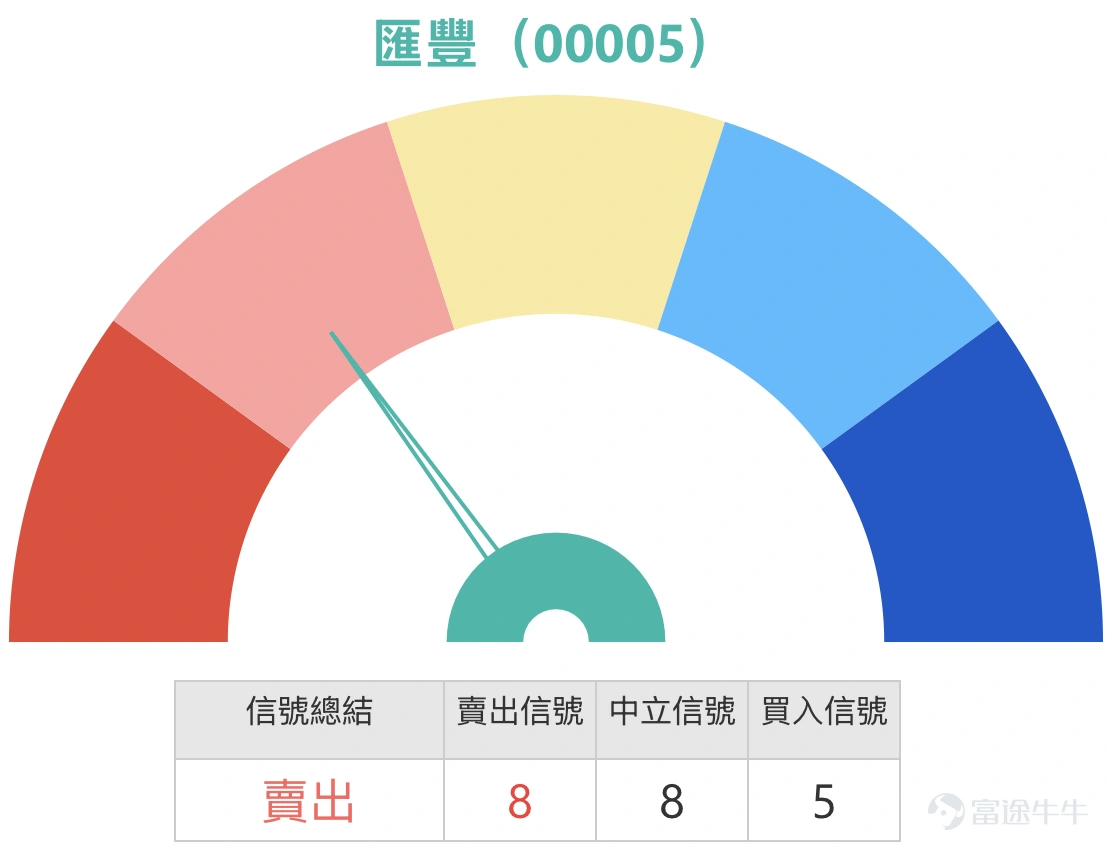
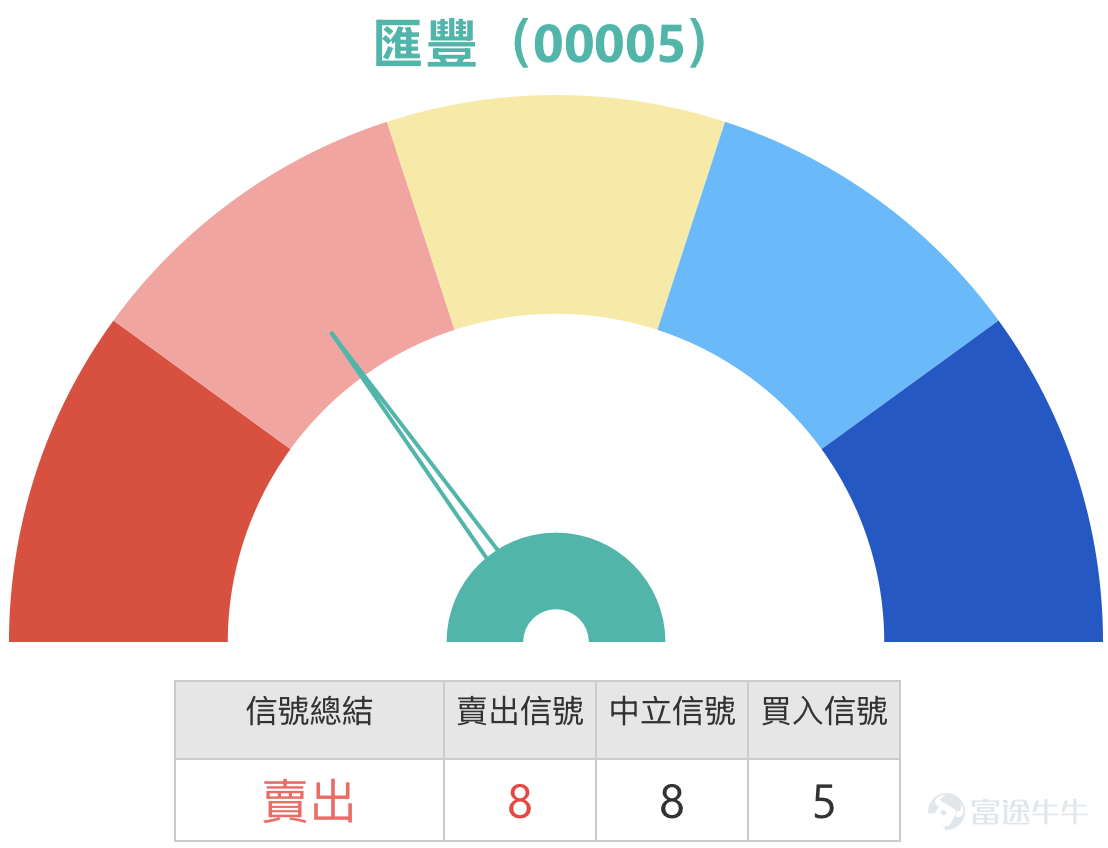
HSBC Holdings is currently trading at 140.1, still above the 5-day, 20-day, 30-day, 60-day, 120-day, and 250-day moving averages, showing an overall stable structure without any obvious signs of weakening. The current price is above the Bollinger Bands middle axis at 138.235, reflecting continued support for the medium- to short-term upward trend. However, it is slightly below the 10-day moving average at 141.660, indicating that the stock is still in a phase of consolidation at higher levels in the short term.
Sentiment in the comments leans positive but is starting to show some divergence. Some investors value high dividends, dividend collection, buybacks, and dividend payouts, believing HSBC Holdings is suitable for steady holding. Others mention the strong price performance, maintaining a bullish view, and are committed to holding until 155. On the other hand, some investors feel that while the Hang Seng Index has risen, HSBC has not risen much, expressing concerns about its inability to rise further, with even some preparing to short the stock, reflecting inconsistent confidence in entering at current high levels.
Common questions mainly focus on three points: First, whether dividends and buybacks can drive the stock price higher; second, whether the price around 141 has already hit a ceiling; third, whether the stock will break out or pull back after consolidation at higher levels. Technically, 140.580 is short-term support, and as long as this level holds, the trend remains stable. If it breaks above 141.660, there may be a short-term opportunity to test 149.678. Conversely, if it falls below 140.580, one should watch for a retest of 138.235.
For short-term strategies, HSBC Holdings is currently in a phase of consolidation at higher levels, and it is not advisable to chase highs solely based on dividend expectations. A more prudent approach is to observe whether 140.580 can hold and whether 141.660 can be broken. If it holds steady and then breaks through, the uptrend may continue; if it falls below 140.580, there may be a short-term pullback for consolidation.
HSBC Holdings (00005) key strategy: Hold above 140.580 and break through 141.660 for a short-term target at 149.678; if it falls below 140.580, watch for a retest of 138.235.
HSBC Holdings is currently trading at 140.1, still above the 5-day, 20-day, 30-day, 60-day, 120-day, and 250-day moving averages, showing an overall stable structure without any obvious signs of weakening. The current price is above the Bollinger Bands middle axis at 138.235, reflecting continued support for the medium- to short-term upward trend. However, it is slightly below the 10-day moving average at 141.660, indicating that the stock is still in a phase of consolidation at higher levels in the short term.   Sentiment in the comments leans positive but is starting to show some divergence. Some investors value high dividends, dividend collection, buybacks, and dividend payouts, believing HSBC Holdings is suitable for steady holding. Others mention the strong price performance, maintaining a bullish view, and are committed to holding until 155. On the other hand, some investors feel that while the Hang Seng Index has risen, HSBC has not risen much, expressing concerns about its inability to rise further, with even some preparing to short the stock, reflecting inconsistent confidence in entering at current high levels.   Common questions mainly focus on three points: First, whether dividends and buybacks can drive the stock price higher; second, whether the price around 141 has already hit a ceiling; third, whether the stock will break out or pull back after consolidation at higher levels. Technically, 140.580 is short-term support, and as long as this level holds, the trend remains stable. If it breaks above 141.660, there may be a short-term opportunity to test 149.678. Conversely, if it falls below 140.580, one should watch for a retest of 138.235.   For short-term strategies, HSBC Holdings is currently in a phase of consolidation at higher levels, and it is not advisable to chase highs solely based on dividend expectations. A more prudent approach is to observe whether 140.580 can hold and whether 141.660 can be broken. If it holds steady and then breaks through, the uptrend may continue; if it falls below 140.580, there may be a short-term pullback for consolidation.
Strategy One | Rebound after holding 140.580
26077 | Strike price 143.88 | Actual leverage 7.9x | Close to current price, suitable for capturing initial rebound after holding support
25899 | Strike price 142.88 | Actual leverage 7.5x | Stable leverage, suitable for phased deployment during volatility
26531 | Strike price 146.09 | Actual leverage 9.0x | Higher leverage, suitable for amplifying returns as rebound accelerates
Strategy Two | Chase the rebound after breaking through 141.660
26847 | Strike price 148.98 | Actual leverage 9.4x | Suitable for capturing upward momentum toward 149.678 after breakout
26078 | Strike price 153.88 | Actual leverage 7.1x | Out-of-money position, suitable for targeting extended upside
25119 | Strike price 168.10 | Actual leverage 14.8x | High-leverage aggressive option, suitable for amplifying gains in case of a strong breakout
Strategy Three | Deployment in case of weakness after falling below 140.580
25460 | Strike price 126.56 | Actual leverage 10.8x | Close to weakening zone, suitable for capturing downward momentum after breaking support
28117 | Strike price 122.78 | Actual leverage 7.5x | Leverage relatively stable, suitable for watching a retest near 138
24062 | Strike price 111.98 | Actual leverage 7.8x | Far out-of-the-money, suitable for expecting deeper pullback potential
Reminder: This article does not constitute any investment advice.
This article is for reference only and does not constitute any investment advice. Market data, opinions, and analyses contained herein may change at any time without prior notice. We are not responsible for any losses or damages caused by reliance on the information in this article. Technical analysis only indicates whether certain technical conditions are met and should be used alongside other data for a comprehensive assessment of asset performance; trading decisions should not be made solely based on this article. Note that past performance is not indicative of future results. Follow Jenny’s HK warrants for more professional insights. $Hang Seng Index (800000.HK)$
Risk Disclaimer: The above content only represents the author's view. It does not represent any position or investment advice of Futu. Futu makes no representation or warranty.Read more
Fist
1
Thumbs Up
2
100K Views
Report
Comments (2)
Write a Comment...
2
3