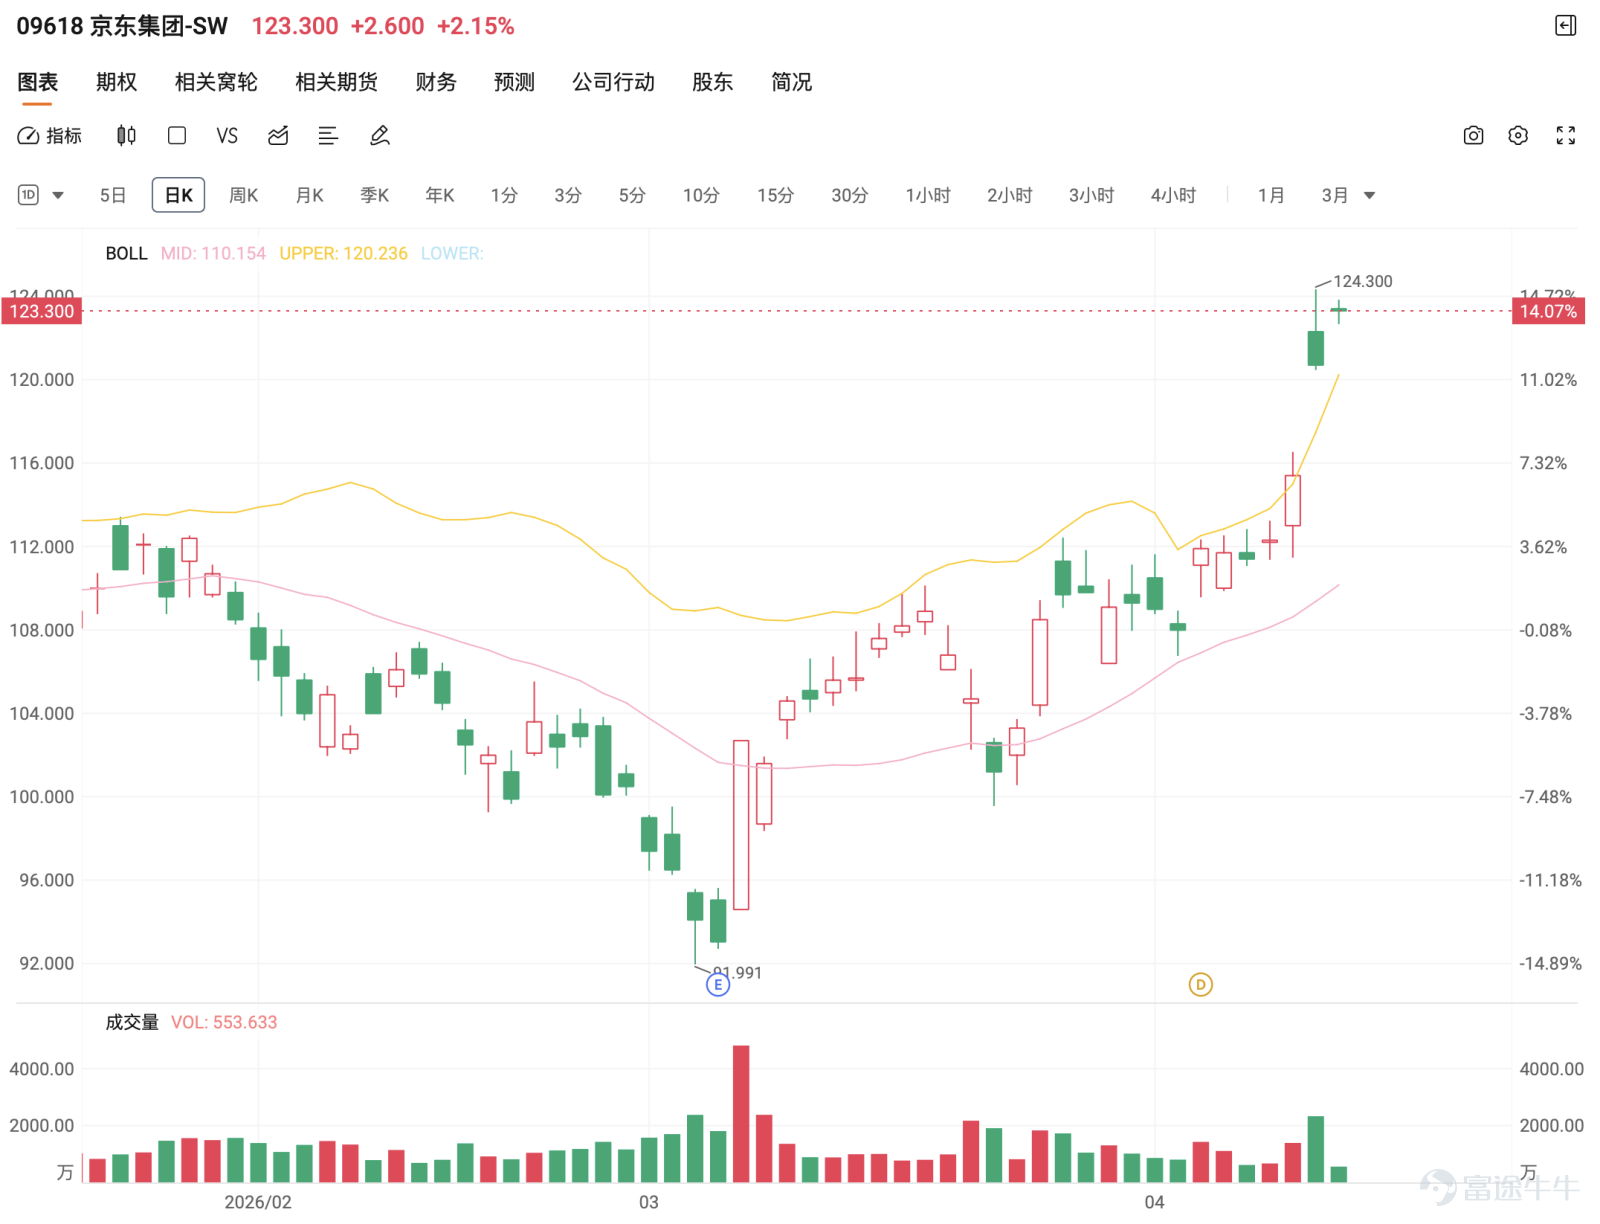

After JD.com's breakout, it entered the acceleration phase; above 120 yuan, it is not advisable to chase higher prices. Waiting for a pullback or another breakout is more critical.
JD.com-SW at 123.4 HKD, the stock price accelerated upward after breaking through the 120 HKD level. Yesterday (the 15th), it reached as high as 124.3 HKD. The trend has officially upgraded from an earlier rebound to a strong phase following the breakout. However, at this stage, it is also approaching short-term high levels, with a relatively high Relative Strength Index (RSI) and nearing the upper Bollinger Band, indicating that the short-term market has become overheated. While there may still be room for upward movement, downside pressure is also increasing.
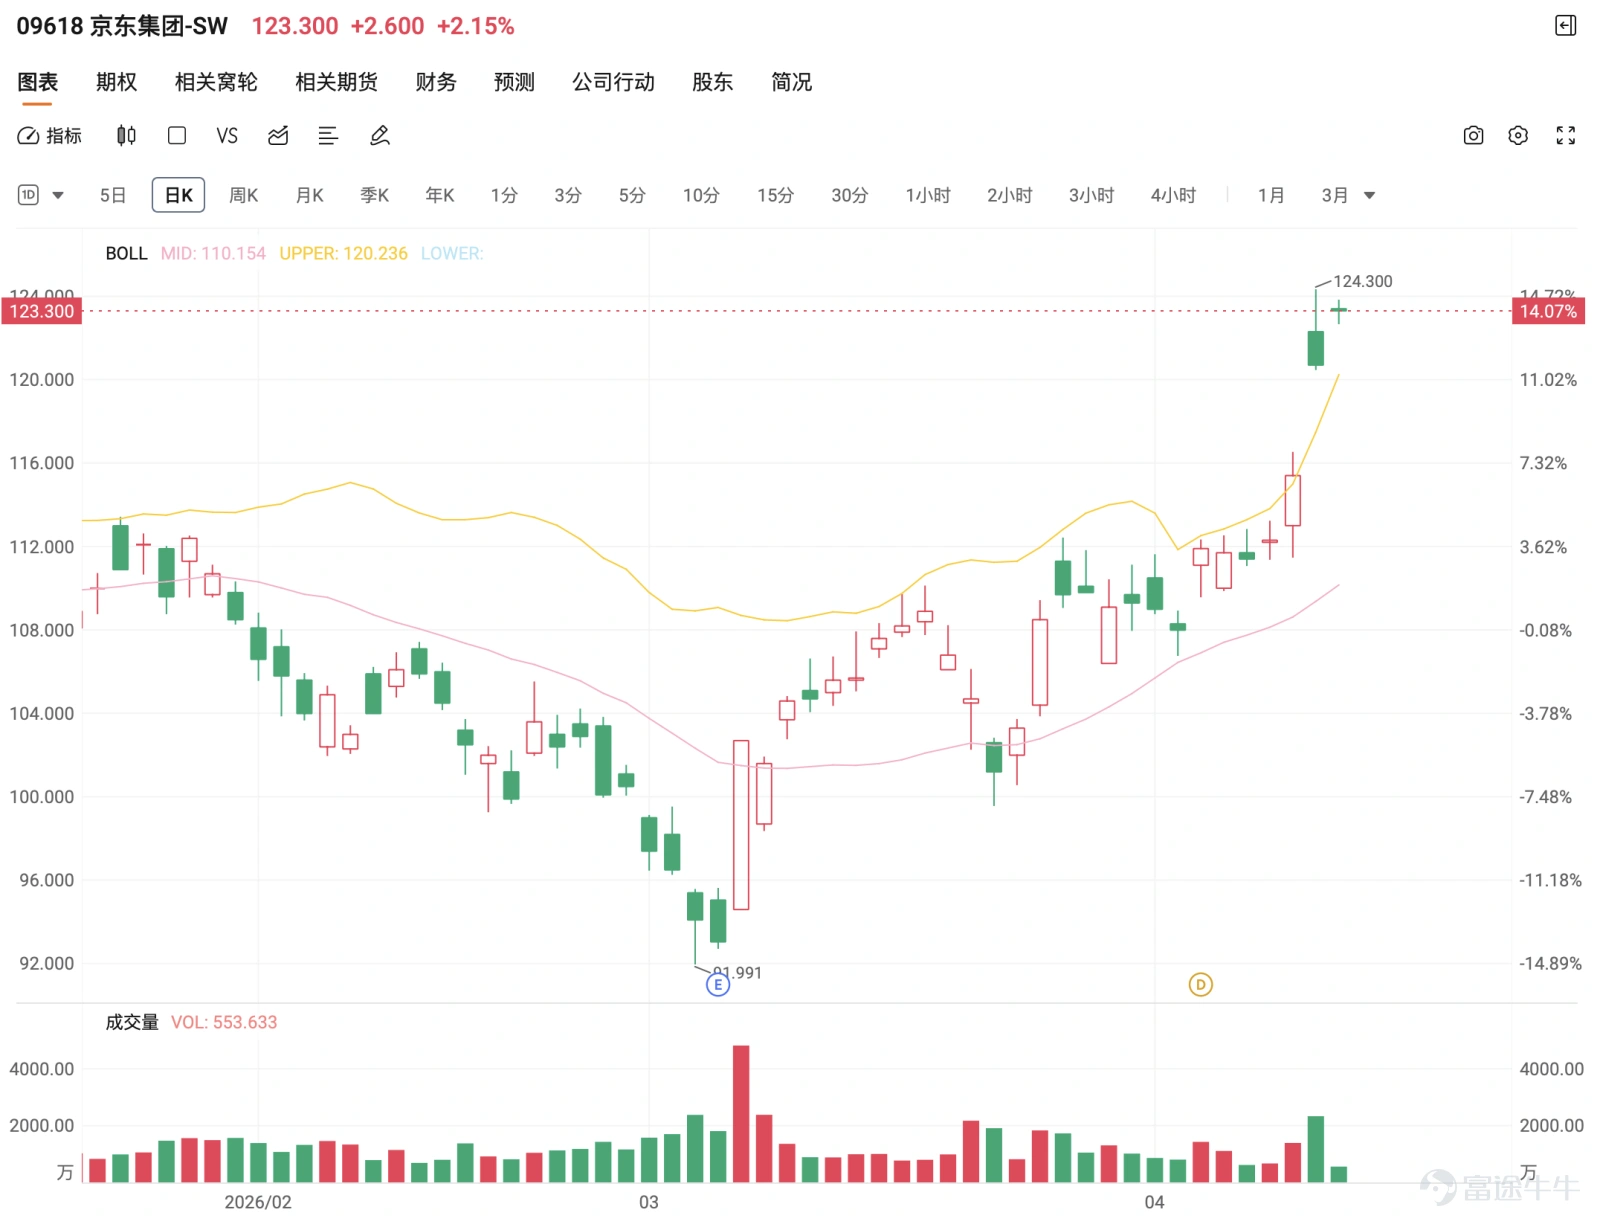
As for whether profits should be taken now and then re-enter at a lower position, as asked by @跨越陰陽行@跨越陰陽行、@oƋŹðś炪, at this point, it’s reasonable to consider locking in profits incrementally. This is because the stock price is entering the late stage of acceleration. If it fails to break through 124.30 HKD immediately, there’s a higher likelihood of consolidation or even a pullback to the 116.50 HKD area in the short term. Re-entering at that point would offer better odds.
Some investors are concerned about whether entering the market today was a mistake, such as @Glowing, shimmering, torch-like glow, glowing, glowing.. In fact, the current price is on the higher side, and short-term volatility will increase, though it won’t necessarily reverse yet. As long as the stock price doesn’t fall below 116.50 HKD, the overall uptrend remains intact. However, if it falls below that level, it would mean the upward structure has been disrupted, and a defensive stance should be adopted in the short term.
Regarding the structure of the trend, such as @Shine brightly and dazzle the eyes.Regarding whether it belongs to a head-and-shoulders bottom breakout, it currently does exhibit characteristics similar to a bottom rebound followed by a neckline breakout. However, the focus is not on the name of the pattern but on whether the momentum of the breakout can be sustained, which depends on whether it can break through 124.30 yuan again and stabilize.
Many investors have asked why the trend remains relatively strong, such as @Radiant, dazzling, and brilliant., @Zachary the Joyful@歡喜的聖扎迦利. The main reason lies in the re-inflow of capital, coupled with the stock price having recovered multiple medium- and short-term moving averages, forming trend-buying pressure. However, at the same time, it should be noted that when the market begins to unanimously turn optimistic, short-term volatility can easily occur.
As for whether the upward movement has already completed, such as @Lucky Day by Day,@幸運的一天天there are currently no signs of a top formation, but it’s also not yet an ideal position to chase in. The real opportunities lie in two scenarios: one is breaking through 124.30 yuan to confirm the continuation of the upward trend, and the other is a pullback stabilizing at 116.50 yuan before moving higher.
Concerning the risk of a top after a high opening, such as @Farewell, Sun WukongA high opening itself does not indicate a peak, but if the market cannot sustain after a high opening and falls back, vigilance is required. The focus at this stage remains on observing whether it can stabilize above 116.50 yuan.
As for long-term investors who have not yet recouped their investments, such as @HDž爌炤炤炣炦HLT torch, @Cute Koala@可愛的樹熊、@Dh(ðǚDžħƖŃǾƖǚCautious and cautious, the current trend is in a recovery phase, but there is still some distance from the peak levels. The strategy could involve reducing positions gradually rather than exiting completely at a single price point.
Lastly, regarding whether it's institution-led, such as @Old Li who got reaped like韭菜 (young leeks), the current situation indeed shows characteristics of trend-driven capital, but that doesn't mean prices can rise indefinitely; instead, risk control becomes more crucial during acceleration phases.
Overall, JD.com is currently in an accelerated upward movement after breaking out, but the short-term outlook appears overextended, lowering its attractiveness for betting. It’s advisable not to chase highs; instead, use pullbacks or breakout confirmations as the primary basis for strategic positioning.
Warrant product recommendation:
The key to whether the uptrend can continue is at 116.50 yuan; in the short term, it’s advisable to wait for a pullback and stabilization or confirmation of a breakout before deploying. If this level is lost, a defensive stance should be adopted.
Strategy One | Breakthrough Momentum (Aggressive)
22826 | Strike price 122.1 yuan | Actual leverage 7.8x | Close to the breakout level, suitable for following up after breaking through 124.30 yuan
22618 | Strike price 122.0 yuan | Actual leverage 7.4x | Balanced terms, suitable for deployment after confirming a breakout
22903 | Strike price 118.98 yuan | Actual leverage 6.9x | Higher proximity to price, suitable for deployment during an extended breakout phase
Strategy Two | Retracement for Long (Optimal)
22948 | Strike price 118.98 yuan | Actual leverage 7.9x | Suitable for accumulating at a low when prices stabilize near 116.50 yuan after a pullback
22775 | Strike price 118.98 yuan | Actual leverage 7.3x | Stable terms, suitable for deploying with a low absorption strategy
22903 | Strike price 118.98 yuan | Actual leverage 6.9x | More conservative setup, suitable for betting on a rebound toward 124 yuan
Strategy Three | Defensive Pivot on Weakness
21647 | Strike price 122.4 yuan | Actual leverage 6.4x | Suitable for defensive deployment after dropping below 116.50 yuan
21128 | Strike price 122.4 yuan | Actual leverage 6.2 times | Balanced terms, suitable for following weakened segments
25275 | Strike price 106.08 yuan | Actual leverage 8.1 times | Higher leverage, suitable for aggressive deployment during continued weakness
Reminder: This article does not constitute any investment advice.
This article is for reference only and does not constitute any investment advice. Market data, opinions, and analyses contained herein may change at any time without prior notice. We are not responsible for any losses or damages caused by reliance on the information in this article. Technical analysis only indicates whether certain technical conditions are met and should be used alongside other data for a comprehensive assessment of asset performance; trading decisions should not be made solely based on this article. Note that past performance is not indicative of future results. Follow Jenny’s HK warrants for more professional insights. $Hang Seng Index (800000.HK)$$Hang Seng TECH Index (800700.HK)$$Hang Seng China Enterprises Index (800100.HK)$
Risk Disclaimer: The above content only represents the author's view. It does not represent any position or investment advice of Futu. Futu makes no representation or warranty.Read more
Comments
to post a comment