US Stock Market Talk | The Fed Resumes Rate Hikes After a Three-Year Pause! Is a New Shift Ahead for

8/28 US Stock Pre-Market Analysis: NVIDIA Single-Handedly Props Up Nasdaq as Investors Crowd into AI Theme
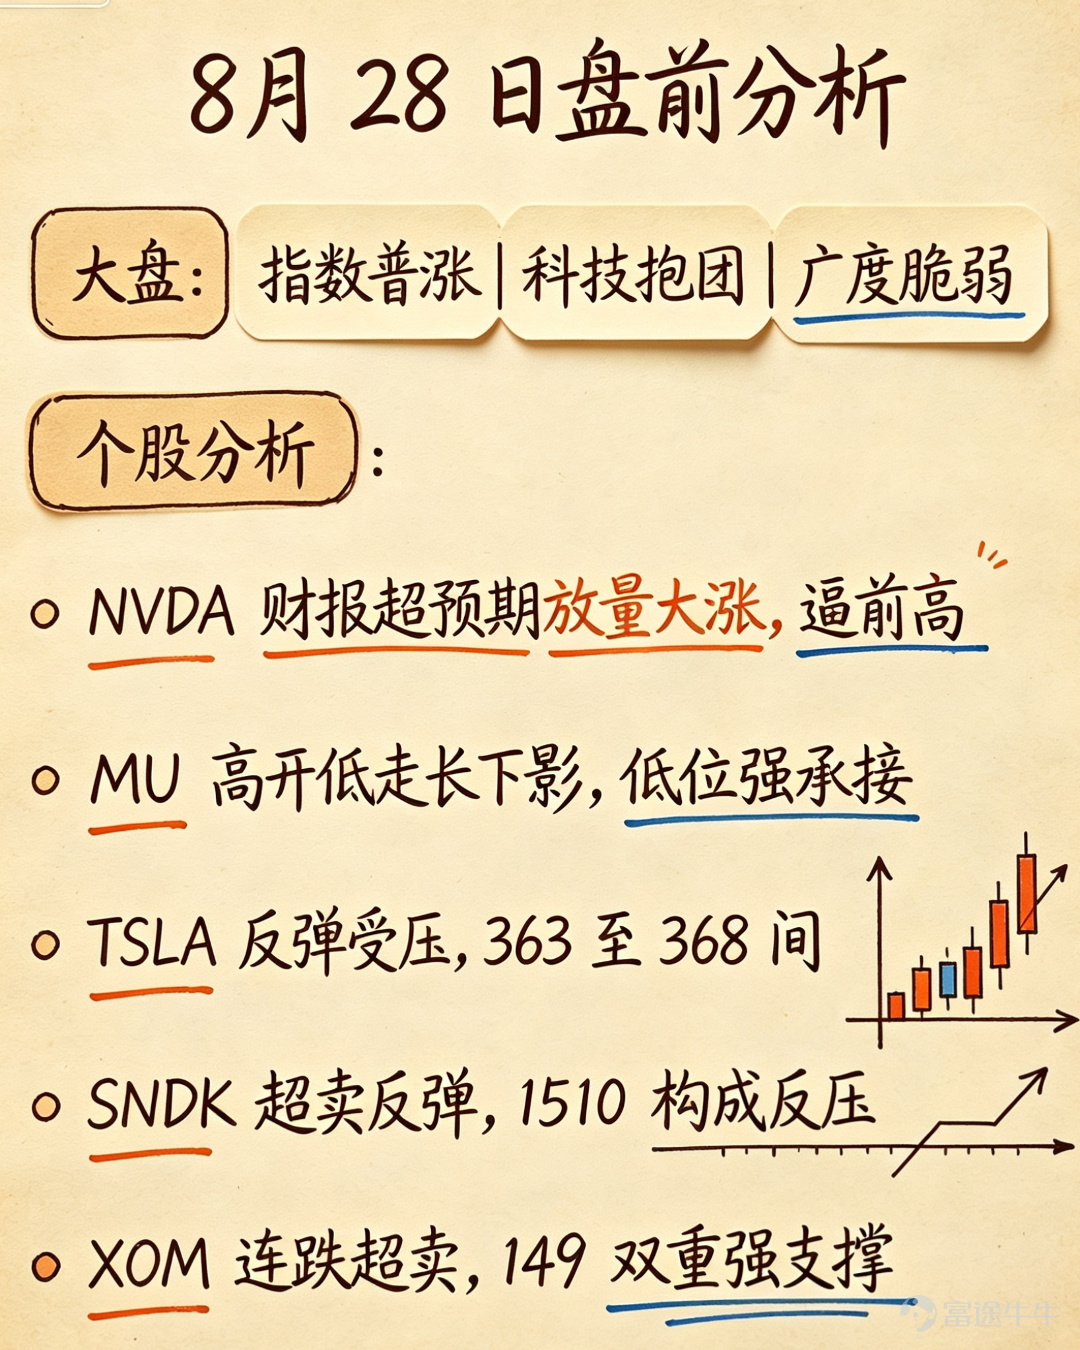
Yesterday, US stock indices generally rose but showed significant internal divergence, $Dow Jones Industrial Average (.DJI.US)$ the Dow Jones Industrial Average rose 0.20%, $S&P 500 Index (.SPX.US)$ the S&P 500 rose 0.72%, $Nasdaq Composite Index (.IXIC.US)$ the Nasdaq Composite rose 1.57%, $PHLX Semiconductor Index (.SOX.US)$ and the Philadelphia Semiconductor Index rose 2.33%. The core driver was NVIDIA's blockbuster earnings report, with revenue reaching $96.1 billion (+106%). The stock surged 8.74% in a single day to 227.98, increasing its market capitalization by $442 billion to $5.49 trillion, with this single stock contributing the vast majority of the Nasdaq's gains. However, only the technology sector closed higher, representing a typical "tech heavyweight-driven rally, while other sectors weakened""Market Structure,This structure, where a few heavyweight stocks drive the index higher, is prone to profit-taking the next day. Be wary of divergence at high levels.
NVIDIA (NVDA)
Market Review: Closed at 209.66 (-1.59%) on 8/26, with the market remaining cautious ahead of the earnings report. After-hours earnings on 8/27 comprehensively exceeded expectations, leading to a gap-up open and a surge of +8.74% to 227.98 on heavy volume. This move accounted for nearly all the gains in the Nasdaq and the PHLX Semiconductor Index that day.
Technical Analysis:The current price of 227.98 has risen above the MA5 (214.78) and MA20 (217.21), with short-term moving averages beginning to align bullishly, indicating dominance by short-term capital. The MACD histogram remains negative at -0.96 but has been converging continuously and is approaching a bullish crossover, suggesting waning downward momentum and accumulating upward momentum. The KDJ J-value is 61.5, in a neutral-to-strong range, neither overbought nor oversold, leaving room for further upside. The RSI(6) is 68.7, approaching the 70 overbought threshold, signaling significant short-term profit-taking pressure. The upper Bollinger Band stands at 231.21, serving as the most immediate resistance level. Volume expanded over the two days, but the surge on 8/27 reflects a "sell the news" dynamic; caution is advised regarding stagnation amidst heavy volume at high levels.
Trend Forecast:The positive earnings news was largely priced in during the single-day surge, significantly reducing the cost-effectiveness of chasing the rally in the short term. Over the next 1–2 days, the stock is likely to consolidate at high levels within the 222–232 range: the upper Bollinger Band at 231.21 is the first hurdle; a breakout on heavy volume could open the path to 240. Below, 214.78 serves as the bull-bear dividing line; holding this level maintains the intact trend, while a breakdown would signal weakness, potentially leading to a retest of the 210 gap zone.
Risk:Valuation already implies extremely high and sustained growth assumptions. If future guidance shows any marginal weakening, the pullback under such high expectations could be severe. Additionally, if AI capital expenditure slows due to macroeconomic factors or customer concentration risks (with Microsoft, Google, Amazon, and Meta accounting for the bulk), it will directly impact the core investment thesis.
Micron Technology MU
Market Review: Closed at 938.40 (+0.58%) on 8/26. On the morning of 8/27, driven by NVIDIA's earnings report, the price surged to a high of 968.71 but failed to hold, falling back to close at 935.39 (-0.32%). The stock oscillated in a wide range of 906.89–968.71 throughout the day, with trading volume significantly increasing to 28.84 million shares, indicating heavy profit-taking pressure above 968.
Technical Analysis:Moving averages show a pattern of "short-term strength, long-term pressure"—MA5 (936.79) almost coincides with the current price (the short-term balance point between bulls and bears), MA20 (915.38) provides support below, and MA60 (960.98) forms resistance above (current price is below MA60, indicating the medium-term trend remains weak). The MACD red histogram stands at 5.75, suggesting bullish momentum has not faded but is limited in height. The KDJ J-value is only 20.03, indicating it is in low territory; this means there is still room for recovery after previous oversold conditions, and it is not yet overbought. The sharp intraday drop to around 906 was pulled back by strong buying power, indicating strong support and accumulation in the 906–915 low range; however, the closing price remained below the opening price, showing overall weakness for the day and no effective breakout.
Trend Forecast:High probability of range-bound oscillation around MA5 (937) for the next 1–2 days, with a core range of 906–960. The 960–969 level is a strong resistance zone; breaking through requires sustained high volume. The 906–915 level is strong support; stabilization on shrinking volume can be considered a buy signal.
Tesla TSLA
Market Review: Closed at 345.82 (-1.26%) on 8/26. On 8/27, it rebounded +2.60% to 354.81, following the warming sentiment in the broader tech sector.
Technical analysis: MA5 (352.54) provides short-term support below the current price; MA60 (368.55) forms medium-term resistance above, indicating the medium-term trend remains bearish and the current move is merely a short-term rebound. The MACD histogram is positive at 8.43, suggesting continued bullish momentum, but the moderate height indicates limited rebound strength. The upper Bollinger Band at 363.13 is an immediate resistance level, forming a "double resistance zone" of 363–368 together with MA60 (368.55). RSI and KDJ have not entered extreme zones, showing no signs of overheating in the rebound, but upside potential is constrained by the resistance zone.
Trend Forecast: The core range for the next 1–2 days is 352–365. Given the dense resistance formed by 363 (upper Bollinger Band) and 368 (60-day Moving Average), a direct breakout is difficult; consolidation is more likely. If volume increases and the price holds above 363, the upside target is 368–375. If it falls back below 352 (5-day MA), the rebound will end, returning to the weak zone of 340–352.
SanDisk SNDK
Market Review: Closed at 1,499.37 (+1.26%) on Aug 26, and at 1,484.95 (-0.96%) on Aug 27, with an intraday range of 1,456–1,557.89. Weakness emerged in late trading, followed by a further post-market decline of -1.38% to 1,464.42, indicating sustained selling pressure after the close.
Technical Analysis (Detailed): Moving averages show "short-term resistance and long-term resistance"—the 5-day MA (1,510.86) acts as overhead resistance, while the 20-day MA (1,445.53) provides support below. The 60-day MA (1,645.82) is far above, indicating a clearly weak medium-term trend. The KDJ J-value is only 2.94, in an extreme oversold zone, representing the strongest short-term rebound signal: downward momentum is nearly exhausted, and a technical repair could occur at any time. However, the bearish close on Aug 27 plus continued weakness after hours suggests further downside before a rebound. Key focus is on whether support at the 20-day MA (1,445) holds.
Trend Forecast (Detailed): The core range for the next 1–2 days is 1,445–1,510. The extremely low KDJ level (J=2.94) signals a high probability of an oversold rebound, but upside potential is limited due to clear resistance from the 5-day MA (1,510), the distant 60-day MA (1,645), and post-market weakness.
Exxon Mobil XOM
Market Review: Closed at 158.19 (-1.53%) on Aug 26, and continued to fall -1.11% to 156.44 on Aug 27. Two consecutive days of weakness against the trend (while tech stocks surged) reflect capital rotating from defensive/cyclical sectors into the main AI theme.
Technical Analysis (Detailed): Moving Averages show "short-term resistance, long-term support"—the MA20 (158.67) is acting as overhead resistance (current price has already broken below it), while the MA60 (149.09) provides key support below. The MACD histogram stands at -1.611; bearish momentum remains dominant, but the bars are not accelerating in expansion. The KDJ's J-value is -16.73, indicating extreme oversold conditions (well below 0), which is a strong signal for a short-term rebound; the RSI6 at 30.44 has also touched the oversold threshold. The lower Bollinger Band at 149.38 nearly coincides with the MA60 (149.09), forming a "double support zone" around 149, showing clear technical resonance.
Trend Forecast (Detailed): Over the next 1–2 days, extreme oversold conditions combined with double support at 149 are highly likely to trigger a technical rebound. However, the rebound strength may be limited due to weakening oil prices and the prevailing downtrend. The core trading range is 149–158. If 149 holds, the price may recover to 158; if 149 breaks, it could decline further to test 145.
Disclaimer:The above content is based on public data and quantitative analysis and is for reference only; it does not constitute investment advice. The market involves risks, so invest with caution. Any investment decision should be made independently based on personal risk tolerance, financial status, and investment objectives, consulting licensed professional institutions when necessary. Past performance does not indicate future returns.

Content Disclosure: Personal opinion
Risk Disclaimer: The above content only represents the author's view. It does not represent any position or investment advice of Futu. Futu makes no representation or warranty.Read more

Comments
to post a comment
3
1