NVIDIA's revenue doubles, beating expectations; is the AI trade narrative making a comeback?

ETF Battle | Want to bet on NVIDIA after its earnings? How to choose among so many linked ETFs?
$NVIDIA (NVDA.US)$ The latest earnings report once again delivered impressive results: quarterly revenue reached $96.2 billion, a 106% year-over-year increase, with data center revenue hitting $89 billion. The company also raised its next-quarter revenue guidance to approximately $108 billion and projected a 70% revenue growth rate for the next fiscal year.
However, strong earnings do not guarantee that the stock price will only rise. After the earnings announcement, NVDA's share price initially fell, then turned higher during the conference call, with after-hours gains approaching 5% at one point. This reflects continued market optimism about AI demand, but also highlights significant short-term divergence amidst high expectations.
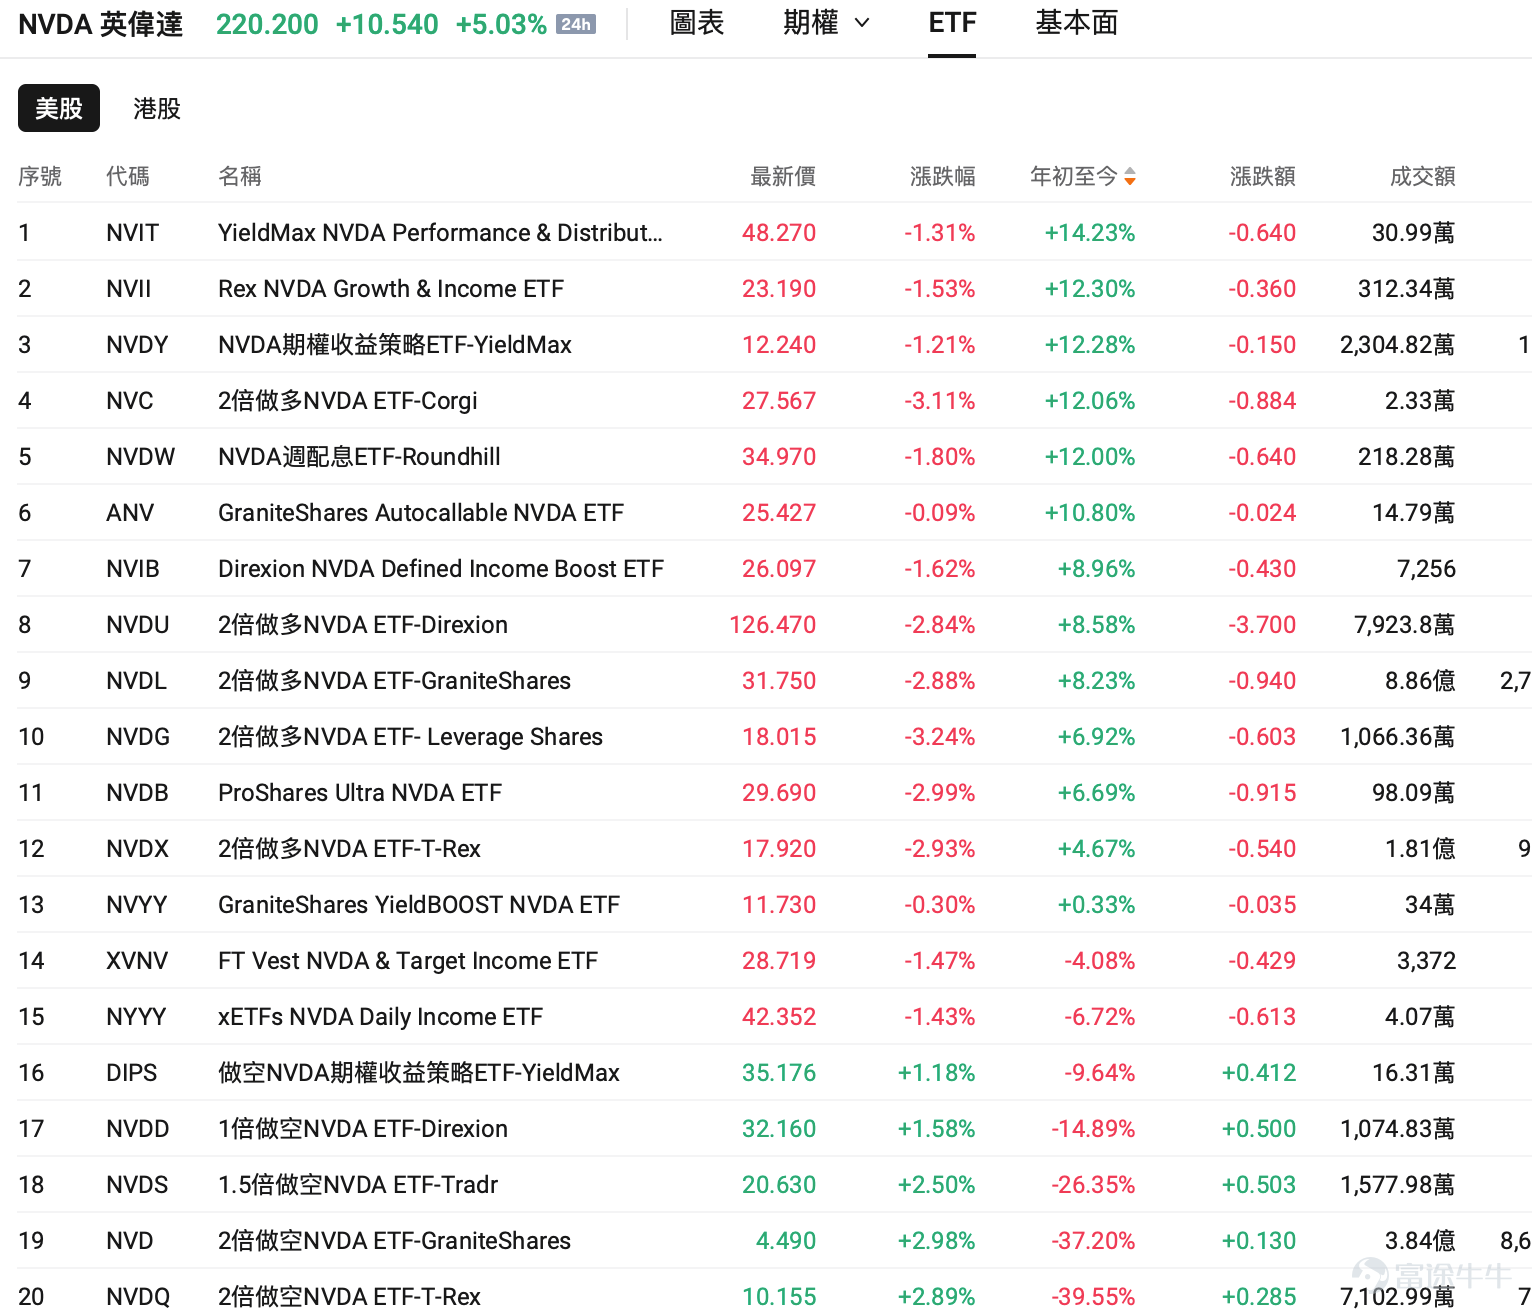
For investors looking to bet on NVIDIA, buying NVDA directly is no longer the only option. The market now offers various leveraged, inverse, and income-generating ETFs linked to NVDA.
The question is:Even though they are all linked to NVIDIA, different ETFs can have completely different trading strategies.
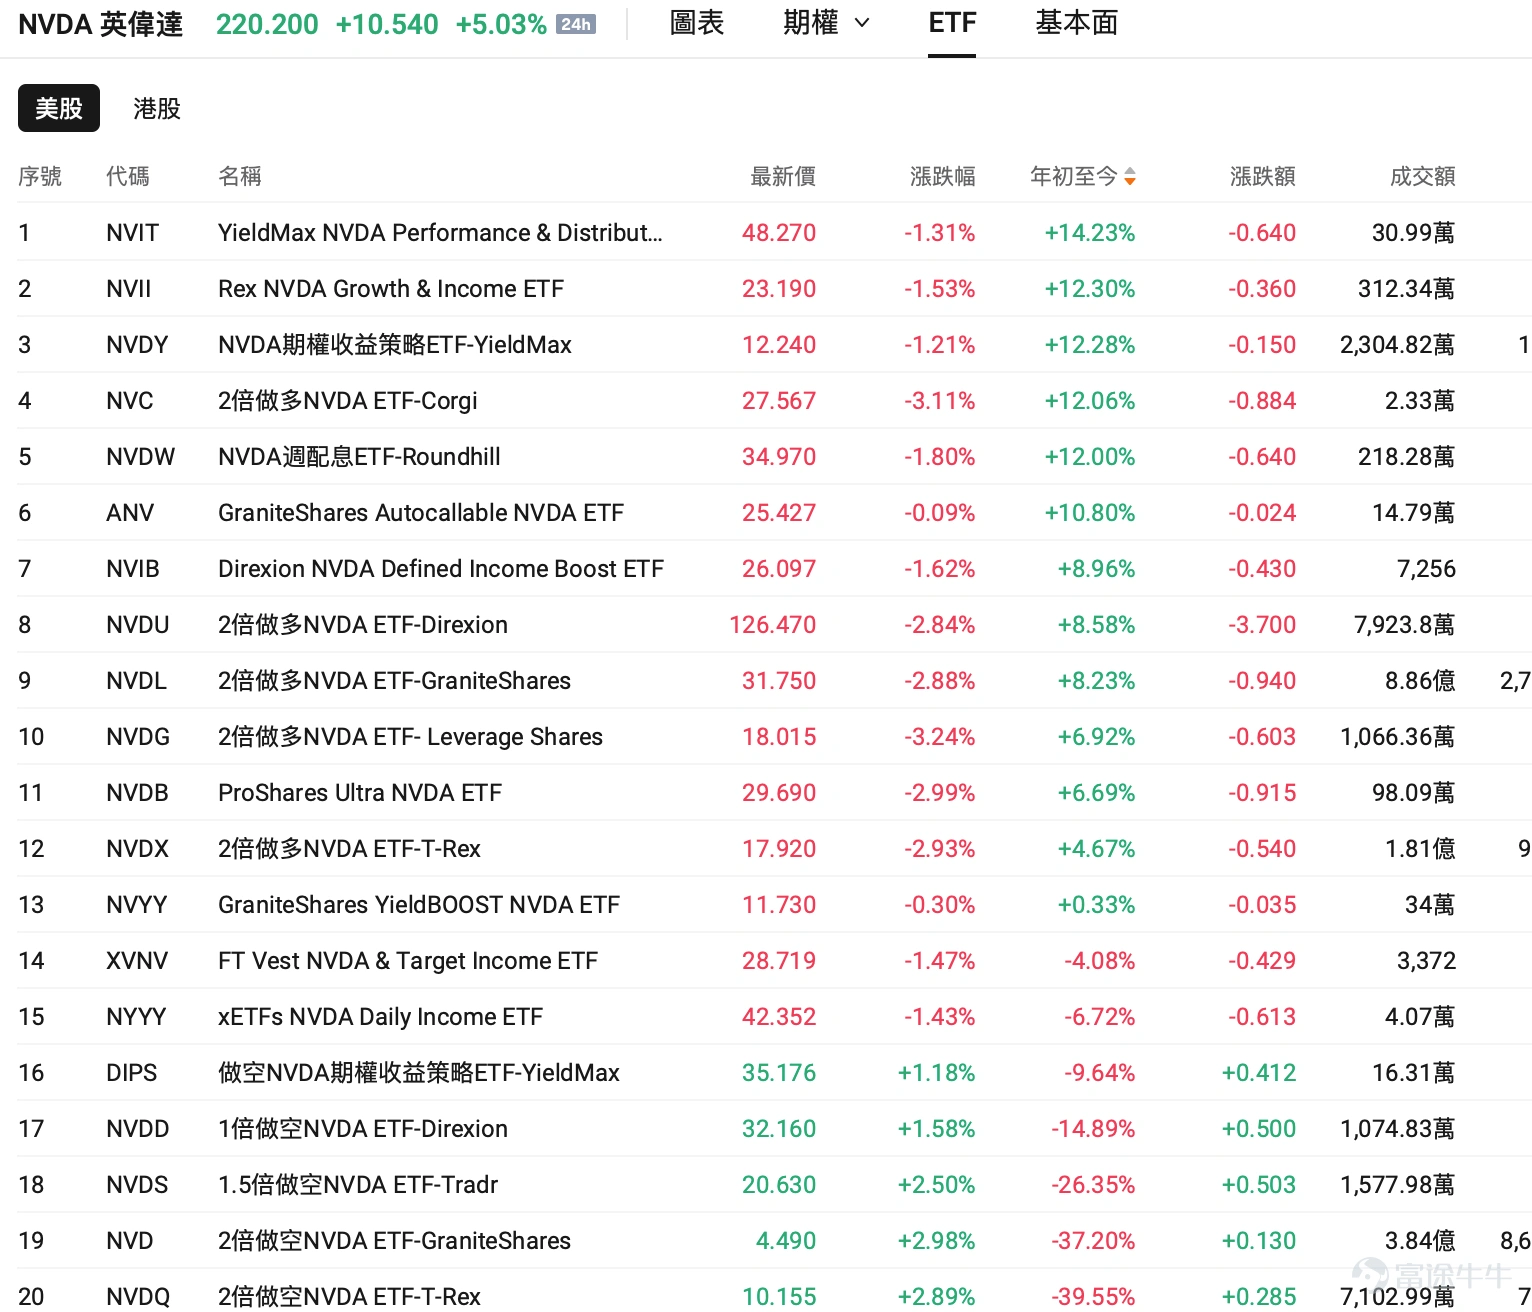
What are the main options for ETFs linked to NVIDIA?
The first category consists of the more familiarleveraged long ETFs。
For example, $GraniteShares 2x Long NVDA Daily ETF (NVDL.US)$、 $Direxion Daily NVDA Bull 2X Shares (NVDU.US)$ and $T-Rex 2X Long Nvidia Daily Target ETF (NVDX.US)$ , the goal is to deliver approximately twice the performance of NVDA.daily. Simply put, if NVIDIA rises by 5% on a given day, these ETFs target a return of around 10%; conversely, if NVIDIA falls by 5%, the loss is amplified accordingly.
The second category includesinverse ETF。
For example, $Direxion Daily NVDA Bear 1X Shares (NVDD.US)$ , which seek daily returns of approximately -1x NVIDIA's performance, while $T-Rex 2X Inverse NVDA Daily Target ETF (NVDQ.US)$ 、 $GraniteShares 2x Short NVDA Daily ETF (NVD.US)$ falls under inverse products with approximately -2x daily leverage. When NVIDIA declines, these ETFs may generate positive returns, making them commonly used for short-term bearish bets or hedging.
The third category consists ofOptions Income ETFs。
For example, $YieldMax NVDA Option Income Strategy ETF (NVDY.US)$ the goal is not simply to chase NVDA's price gains, but to collect option premiums through NVDA-related options strategies, aiming for cash distributions while participating in part of the stock's upside.
All three types of products are linked to NVIDIA, but they are suitable for different market conditions.
Scenario 1: Strongly bullish, with a short-term upward trend
If your view is that NVDA still has a clear short-term upward trend, a 2x leveraged long ETF is the most direct tool.
For instance, when earnings and guidance exceed expectations, the stock price breaks through key levels, and the market continues to raise profit forecasts,with a clearer direction and stronger trend,such market conditions are generally more favorable for leveraged ETFs.
However, note that "2x" refers to thedaily return target。
Products such as NVDL, NVDU, and NVDX rebalance their positions daily. Over longer holding periods, actual returns are affected by daily compounding and market volatility, meaning it is not the case that "if NVDA rises 20% in a month, the ETF will necessarily rise 40%." The issuers also explicitly warn that the longer the holding period and the greater the volatility of NVDA, the more pronounced the impact of compounding on returns becomes.
So, you can simply remember:Leveraged ETFs are better suited for scenarios with "strong directional momentum over a short timeframe," while choppy, range-bound markets require extra caution.
Scenario 2: Still bullish, but expecting short-term consolidation at high levels
Another situation is where you remain bullish on NVIDIA, but after a rally, you believe it may not continue to surge sharply in the short term, instead entering a phase of high-level consolidation.
At this point, $YieldMax NVDA Option Income Strategy ETF (NVDY.US)$ option-income ETFs offer an alternative approach.
These products generate option income by leveraging NVDA's volatility while retaining some participation in upside price movement. Therefore, the focus is not on capturing every bit of NVDA's gains, but on striving for cash distributions during the holding period.
The trade-off is straightforward.
If NVDA suddenly surges significantly, the option strategy may cap some of the upside. Consequently, income-focused ETFs may significantly underperform direct holdings of NVDA, and even underperform 2x leveraged ETFs.
However, amid NVIDIA's persistent volatility year-to-date, NVDY has indeed outperformed the underlying stock in range-bound trading, highlighting the strategy's advantage in choppy markets:
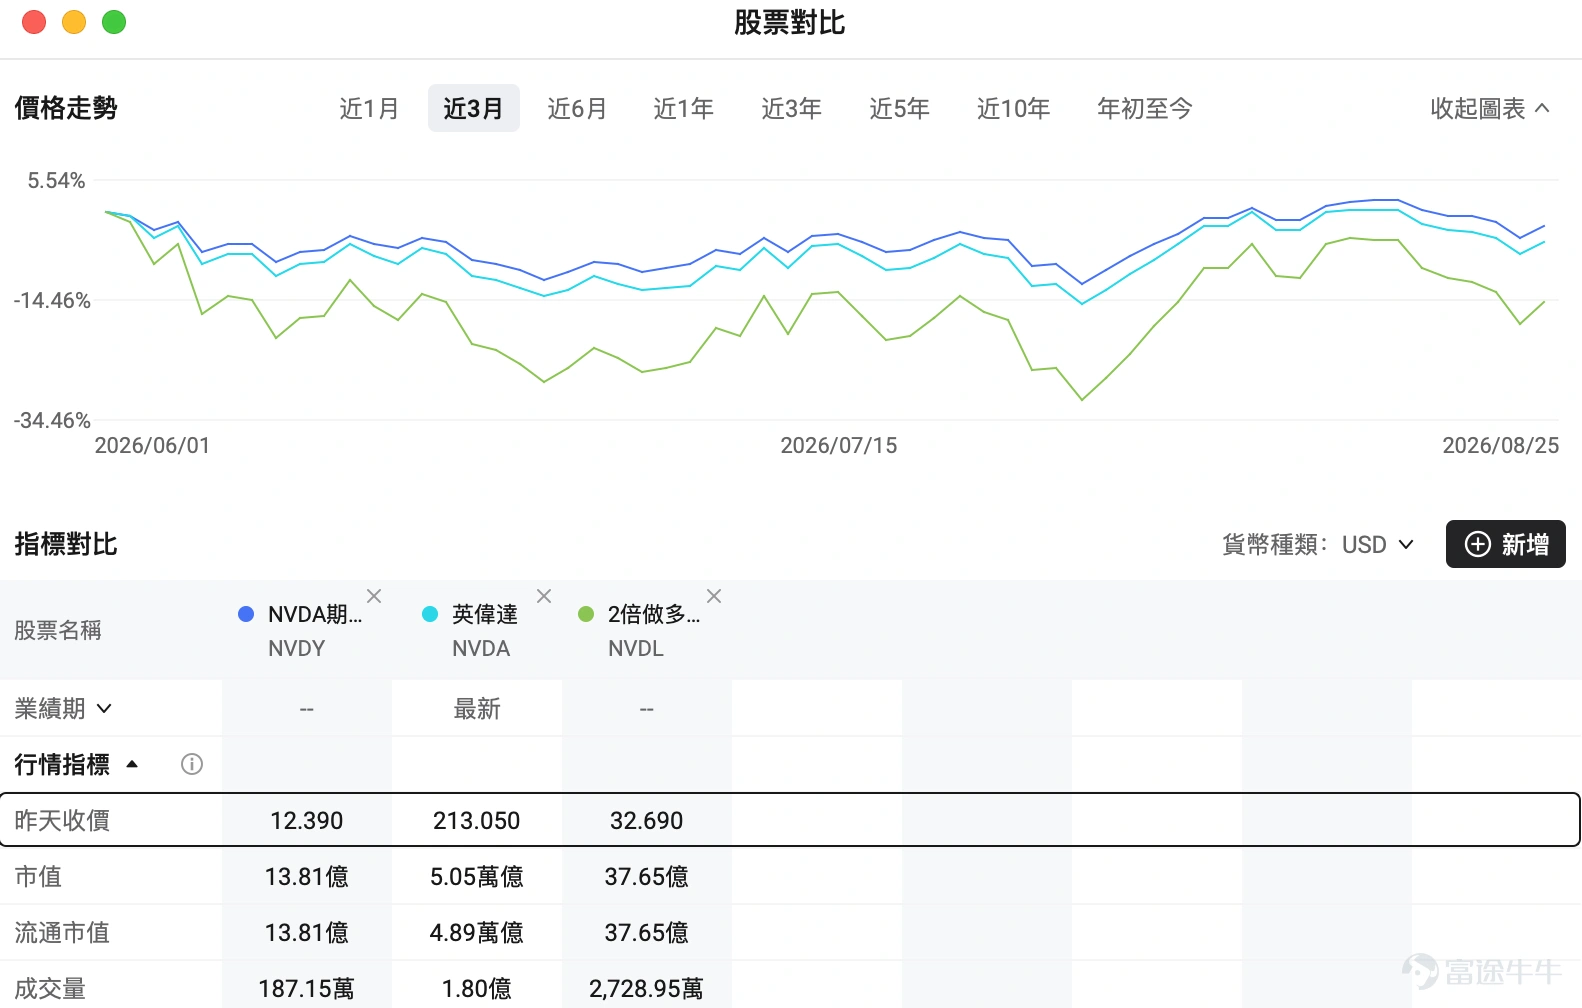
Therefore, before choosing such products, the first question shouldn't be "How high is the dividend yield?", but rather:Do I want greater price elasticity, or higher cash distributions?
It is also important to note thata high distribution rate does not equal high total return,as you must ultimately calculate total return by combining received distributions with changes in the ETF's price or net asset value (NAV).
Scenario 3: Concerned about a short-term drop in NVDA
If your outlook turns bearish, there are inverse ETFs with varying degrees of leverage available in the market.
For example, NVDD seeks approximately -1x daily performance, offering a relatively moderate approach; while NVDQ and NVD seek approximately -2x daily inverse performance, making them more sensitive to declines in NVDA.
However, the higher the leverage, the higher the risk.
Inverse ETFs also reset daily, so they are more likeshort-term trading or hedging tools,and should not be simplistically understood as: "I think NVDA will fall in six months, so I'll buy a -2x ETF and hold it for six months."
If NVDA experiences significant volatility during this period, even if your directional view is ultimately correct, the actual return may deviate significantly from the simple calculation of -2 times.
Two other distinctive products
In addition to typical option income ETFs like NVDY, there are also products on the market that combine leverage with income strategies.
$GraniteShares YieldBOOST NVDA ETF (NVYY.US)$ The more aggressive option aims to provide nearly 2x daily price exposure to NVDA while generating income through option strategies such as selling puts, with weekly distributions. In other words, it is not merely an "income ETF"; it also carries higher directional and leverage risks related to NVDA. It is suitable for investors who are bullish on NVDA and seek enhanced cash distributions, but it comes with higher volatility and net asset value (NAV) drawdown risks.
$Rex NVDA Growth & Income ETF (NVII.US)$ The more balanced option aims to deliver approximately 1.05x to 1.5x of NVDA's daily performance, while collecting option premiums through covered call strategies, with a primary focus on weekly distributions. It sits between traditional 2x long ETFs and covered call ETFs, aiming to retain greater participation in NVDA's upside while increasing option income. However, it still carries risks associated with leverage, daily resets, and capped upside due to options.
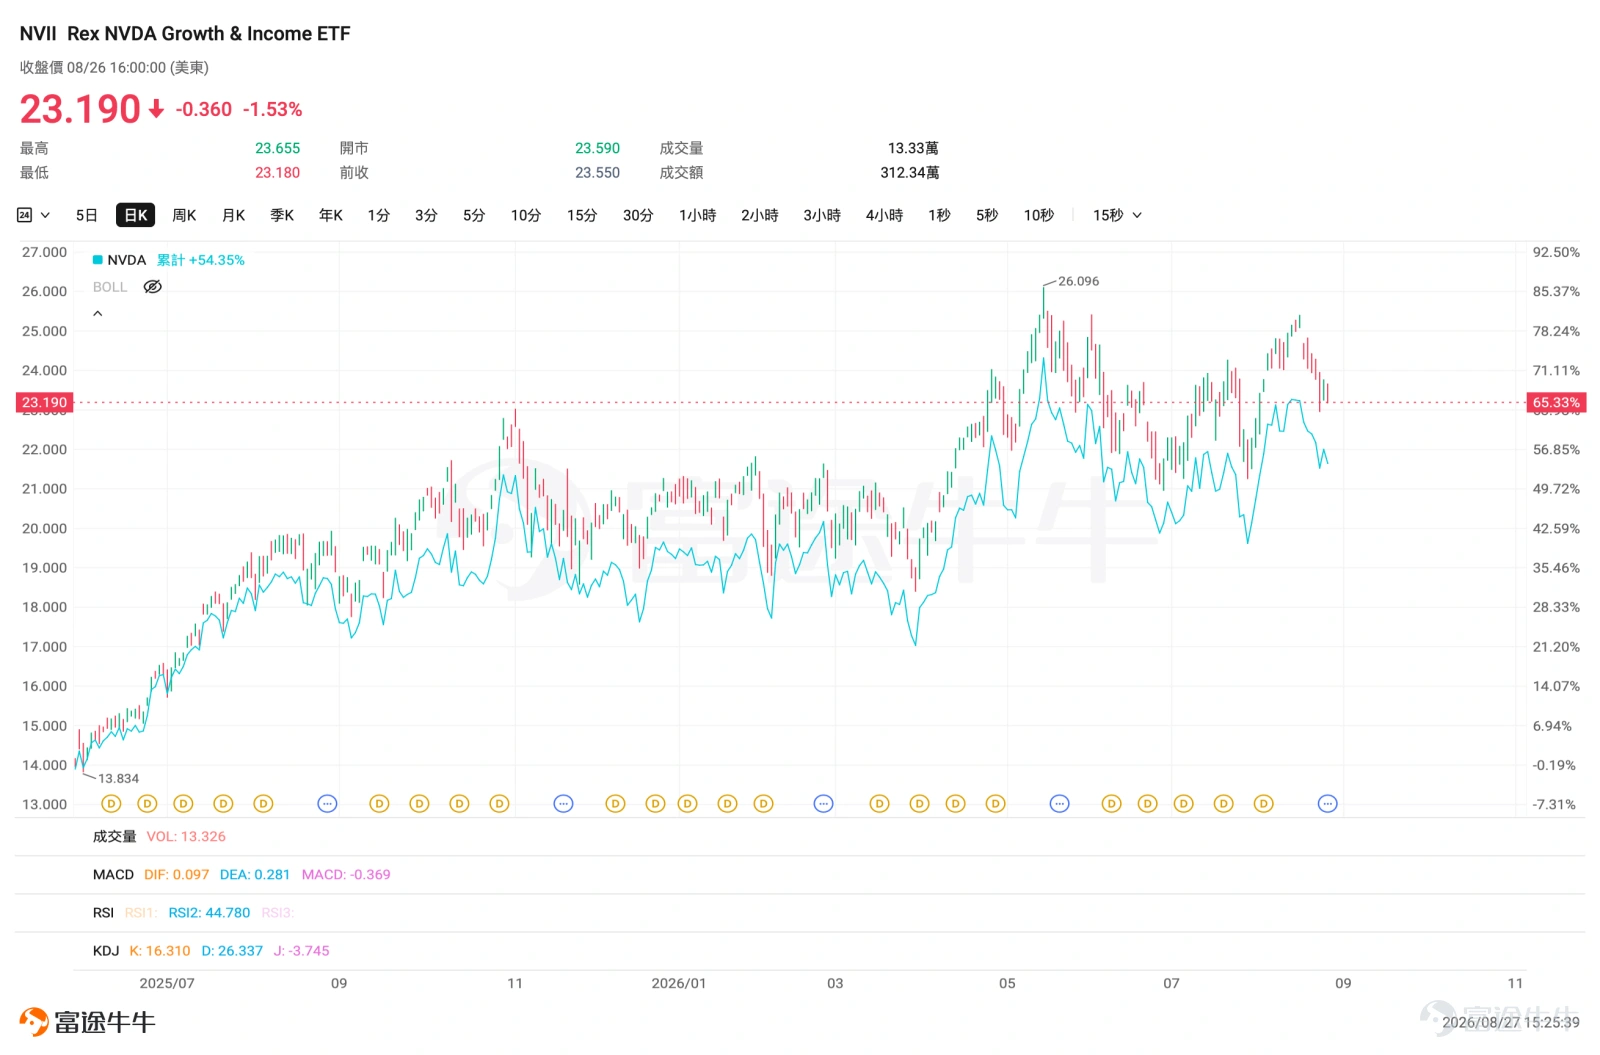
Both are 2x long ETFs, so how should you choose?
Once you have decided to use a 2x long ETF, the next step is to compare specific products such as NVDL, NVDU, and NVDX.
For average investors, there is no need to compare too many complex indicators; focusing on a few key factors is sufficient.
First is trading volume and liquidity. Short-term products require frequent buying and selling, so active trading volume is crucial.
Second is the bid-ask spread. The wider the ETF's bid-ask spread, the higher the actual transaction costs for buying and selling.
Third is assets under management (AUM). Products with excessively small AUM may suffer from poor liquidity and carry the risk of future mergers or liquidation.
Compare expense ratios last. If you only hold positions for a few days, the impact of bid-ask spreads and liquidity can be more direct and significant than a difference of a few basis points in annual management fees.
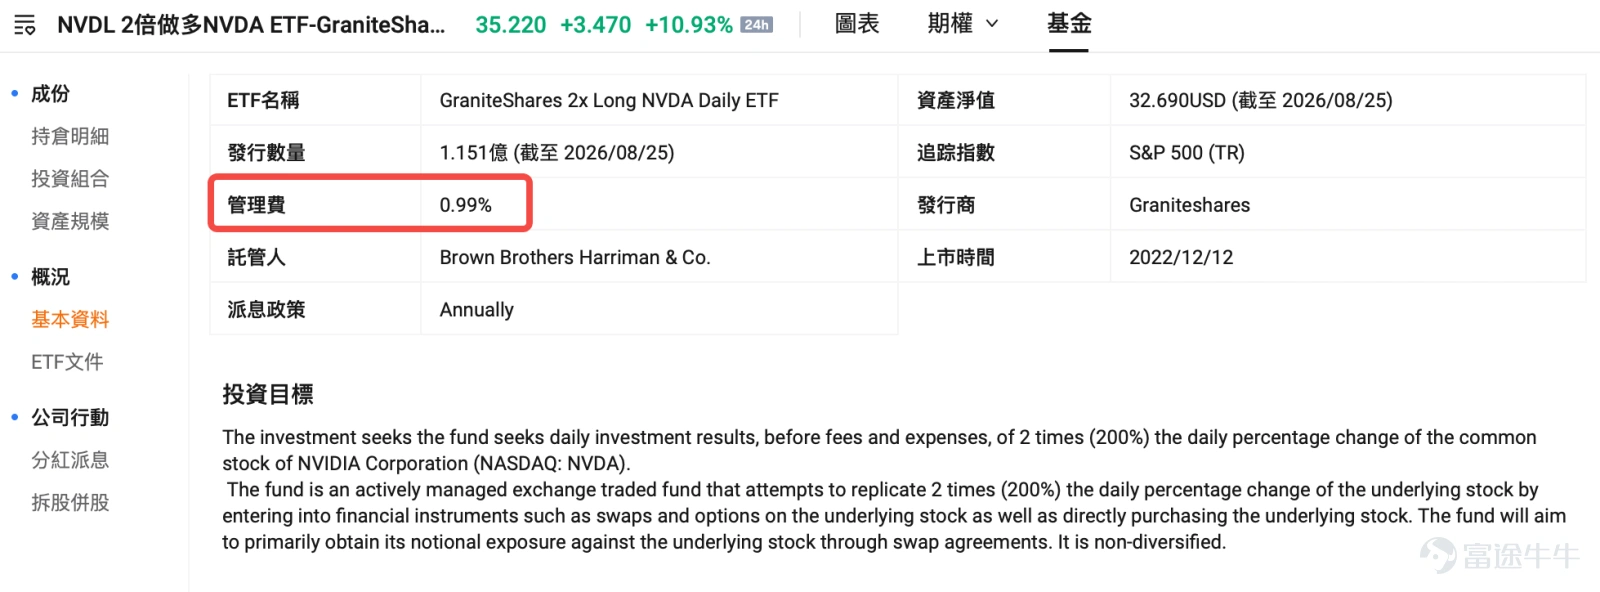
Therefore, for short-term leveraged ETFs, it can be simply understood as:First, look at liquidity and bid-ask spreads, then consider size and expense ratios.
When selecting single-stock ETFs, ask yourself these four questions first.
Faced with an increasing number of products, you can start by asking yourself four questions.
First, am I bullish, bearish, or expecting sideways movement?
This determines whether you should first research leveraged, inverse, or income-focused ETFs.
Second, how long do I plan to hold the position?
The suitable instruments differ for day trading or holding for a few days versus holding for several months. In particular, with daily leveraged and inverse products, pay close attention to the daily reset mechanism.
Third, am I seeking price elasticity (capital appreciation) or cash distributions?
2x Long ETFs and option-income ETFs address two completely different needs.
Fourth, among similar products, which one is easier to trade?
Then compare trading volume, bid-ask spreads, fund size, and expense ratios.
In short, the order should be:First assess market conditions, then choose the ETF structure, and finally compare specific products.
This approach is not only applicable to NVIDIA
NVIDIA is simply the most typical example at present.
As single-stock ETFs become increasingly popular, various leveraged, inverse, or income-generating ETFs have also emerged for hot stocks like SpaceX, Tesla, Google, and Microsoft.
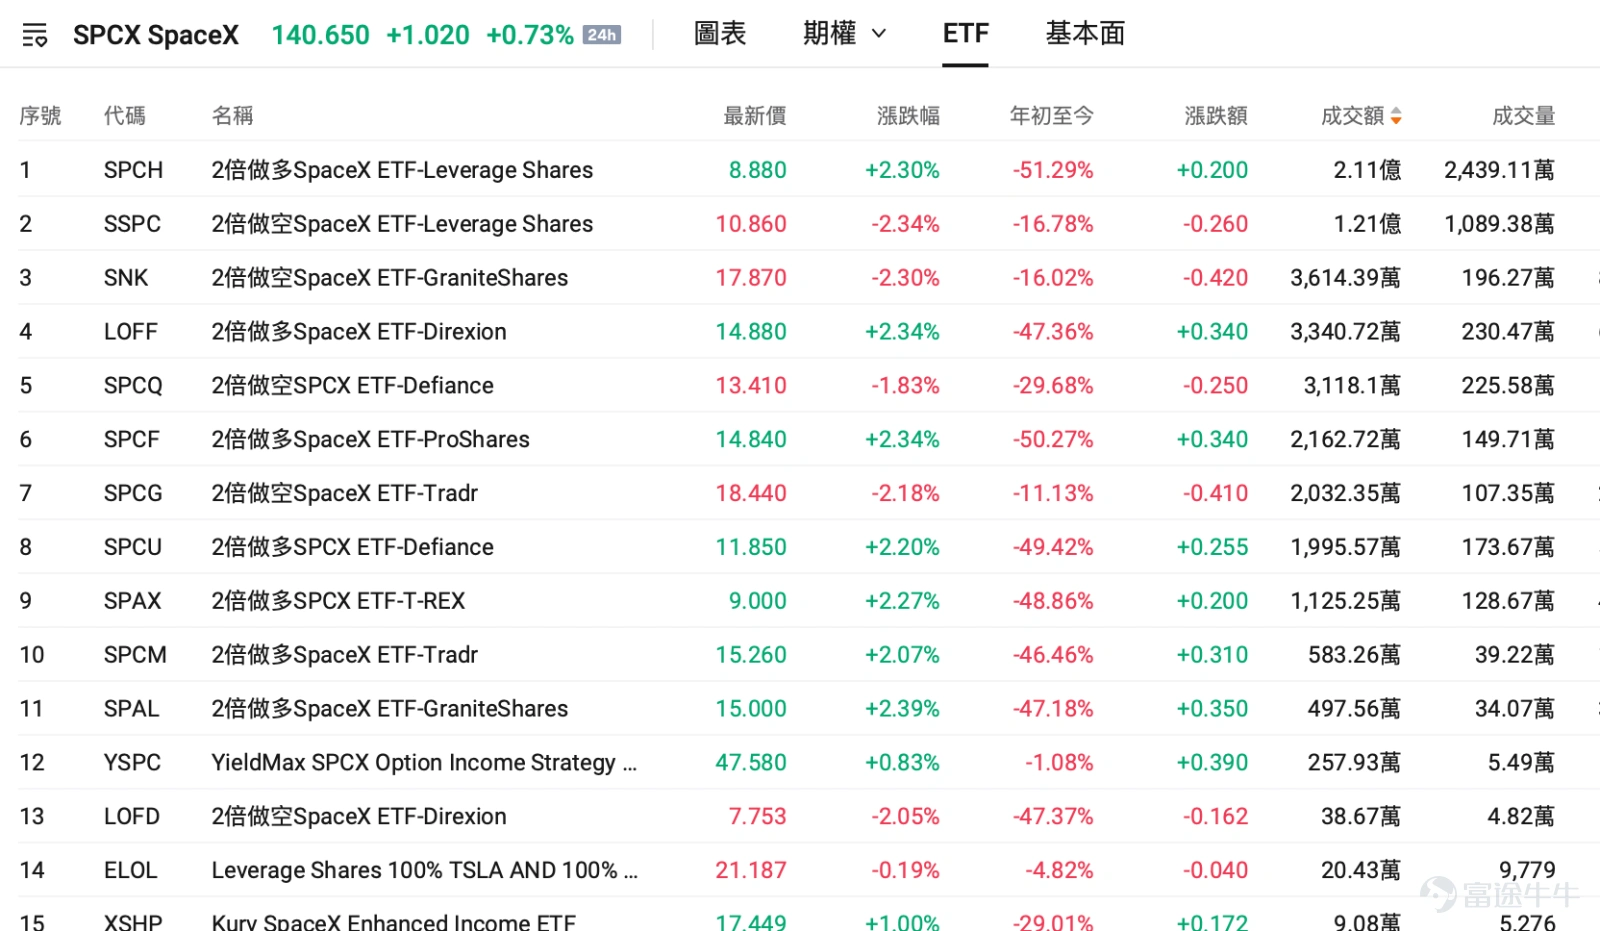
So while we use NVDA as an example this time, investors can apply the same method when encountering other popular single-stock ETFs in the future:First clarify your view on the underlying stock, then examine the ETF's strategy, and finally compare the product's liquidity, costs, and risks.
Product names will keep changing, and more ETFs will continue to launch. But the selection logic is not that complicated—First clarify what position you want to take, then choose the tool.
Leveraged, inverse, and single-stock ETFs carry higher risks. Actual returns may deviate significantly from the cumulative performance of the underlying stocks over longer periods. Investors should fully understand the product objectives, daily reset mechanism, derivatives, and concentration risks before investing.
🎁 The August ETF Challenge is in full swing!Whether you're a novice investor just starting out or a seasoned pro with battle-tested experience, join the ETF Trading Challenge now! Share your ETF trading stories and stand a chance to win points, vouchers, Bullboxer merchandise, and other exciting prizes!Click to join now >>

Risk Disclaimer: The above content only represents the author's view. It does not represent any position or investment advice of Futu. Futu makes no representation or warranty.Read more


Comments
to post a comment
29
28