
Master quantitative trading from scratch! Share your AI + algorithm实战 insights to win prizes

I handed over my position management methodology to Doubao, and it built a market monitoring Skill for me.

After buying a stock,The hard part has only just begun.Watching it rise and fall with the market, you feel elated during sharp rallies but immediately wonder if you should sell; during steep declines, anxiety sets in—should you add to your position, hold on, or cut your losses? Meanwhile, a constant stream of news and opinions fueled by emotion pours in, making the original rationale for buying increasingly blurred amidst the daily fluctuations.
I have faced the same confusion. It was not until this year, when AI office tools became capable of directly reading files, retrieving information, and continuing tasks sequentially, that I had the opportunity to systematize my past habits of monitoring portfolio holdings.
I started with the storage sector stocks I had already purchased. The company profiles, industry data, and observation notes accumulated over the past six months served as the perfect starting point for this experiment. Over the last month or so, I have involved AI in daily tracking. Gradually, it has become clearer which information warrants long-term attention and what changes trigger a re-evaluation of the original investment thesis.
As this system took shape, I began to consider whether I could package my portfolio monitoring methodology and organized storage data into a 'skill.' This would allow others to run it via AI without needing to learn coding or set up a complex environment. Moreover, once users start adopting it, it will compel me to continuously update and optimize the system.
I named it 'flatline.' It is available on both GitHub and Gitee; simply search for 'flatline Tangping Index' to find it.
Essentially, it is a market monitoring system that codifies rules regarding why an investor bought a specific stock, what developments might undermine that judgment, and at what threshold alerts should be triggered.When new information emerges, the AI updates the daily report based on these criteria, highlighting what has fundamentally changed, what is merely price movement, and where more evidence is needed, thereby assisting human decision-making.
During the actual development of this system, I chose Doubao Task Workflows because it can read and process local files on a computer and continue long-running tasks. Even when away from the computer, I can monitor and manage the same task via my mobile phone. The rationale for this choice is practical: as of June 2026, Doubao ranks first in user base among domestic AI-native apps according to QuestMobile statistics. Since many people are already using it, there is no need to switch to a high-barrier tool just to use flatline.
I provided Doubao with my portfolio monitoring methodology and previously accumulated storage data. Doubao then structured this content into specific companies, long-term observation metrics, and ten alert conditions, generating updatable daily reports and dashboards. Thus, the first version of flatline was built.
01 Incorporate the methodology for reviewing portfolio holdings into your investment rules.
When reviewing my portfolio, I repeatedly ask myself five questions: Who is paying? Are the profits sufficient? Where is the capital for expansion coming from? What external conditions could disrupt the underlying thesis? Finally, is market liquidity overly concentrated, and could leveraged buying amplify price volatility?
The first two questions assess business sustainability; the third evaluates whether the company has the capital to scale; the fourth examines external risks; and the fifth considers whether market trading dynamics could adversely impact the position.Each of these five factors can influence portfolio holdings. If any one of them changes significantly, I reassess whether the stock still meets the original criteria for holding.
Applying these five questions to the memory storage supply chain, the first step is to clarify exactly which segment of the business drives profitability for each company.
For instance, while server memory prices are rising, the analysis differs by company: For Montage Technology, which produces interface chips, focus on chip shipments and revenue. For Longsys, which manufactures memory modules and SSDs, assess whether price increases cover procurement costs and how inventory levels and gross margins change. For equipment manufacturers like Naura Technology, actual capacity expansion by memory fabs is required before it translates into equipment orders.
I tasked Doubao with mapping out 15 companies in the supply chain that require monitoring, selecting key long-term metrics based on each company's revenue drivers. The initial data serves as a baseline for future comparison, while also determining update frequencies and identifying any current data gaps.
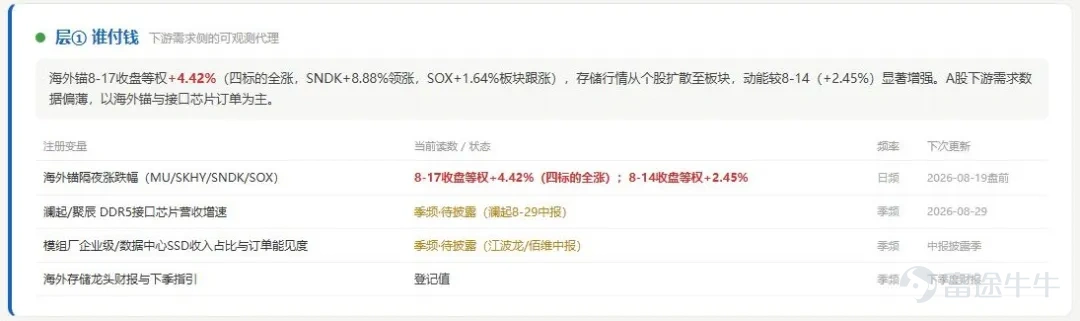
Once the companies and metrics are defined, establish the evaluation criteria before the daily market data is released.I clearly define in advance which indicators, and to what extent they must change, to trigger a re-evaluation of the position.After stock prices have already risen or fallen, investors are prone to emotional bias, often retrofitting explanations for the same developments.The discipline required for investing can be effectively maintained by having AI repeatedly check against established standards.
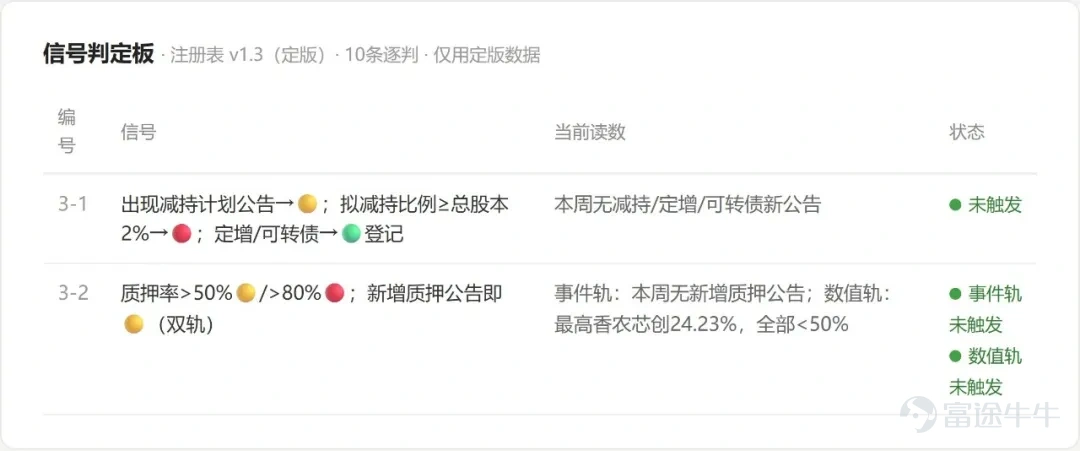
Doubao consolidated the previously selected monitoring items into nine proposals, clearly specifying what to monitor, what conditions trigger alerts, and providing corresponding handling recommendations. I then reviewed each item individually to decide on adoption. One such item is the shareholder pledge ratio, which tracks the proportion of shares major shareholders have pledged as collateral for loans. An excessively high ratio increases the risk of forced liquidation if the stock price falls, thereby adding extra risk to my portfolio even if the company's fundamentals remain unchanged.
Doubao handled the shareholder pledge ratio rule quite conservatively. It initially suggested issuing an alert when the ratio exceeds 50% and classifying it as high risk when it exceeds 70%, while noting that the 70% threshold lacks robust empirical support and thus should not be formalized as a strict rule immediately. After reviewing the conditions item by item, I set the alert threshold at 50% and the high-risk threshold at 80%. With this adjustment, both figures were incorporated into the formal rules, ensuring that future reports will continuously monitor the additional risks arising from equity pledges.
The same methodology applies to corporate operations and product pricing. For Montage Technology, a year-on-year decline in interconnect chip revenue signals a contraction in its core business. If the monthly increase in server memory prices falls below 5% for two consecutive months, or if NAND wafer quotes drop for two consecutive weeks, it indicates that the previous upward price momentum needs re-evaluation. When these scenarios occur, Doubao flags the relevant companies in the report according to the rules encoded in Flatline, prompting me to further verify orders, revenue, and profits.
Beyond operational performance, capital allocation and external events can independently alter portfolio risk. I must re-evaluate holding conditions if major shareholders reduce their stakes by a pre-set percentage, or if reliable information confirms new export restrictions or customer order cancellations. Private placements and convertible bonds represent new fundraising arrangements; these are recorded first and monitored further only when actual financing and changes in share capital occur.
Since the memory market is global, developments in overseas markets influence my assessment of A-share holdings the following day. An average decline of 3% across four overseas benchmark stocks, or an 8% drop in any single one, indicates significant overnight market pressure. In the A-share market, if the stock pool suffers a sharp single-day decline and underperforms the semiconductor index, it suggests weaker performance relative to the industry. Additionally, three consecutive days of net outflows from main capital funds indicate sustained selling pressure.
I later added a rule for market overheating. When this group of stocks outperforms the predefined semiconductor index for five consecutive trading days, accumulating a 10 percentage point excess return, Doubao highlights this status in the report. I then assess whether the surge is broad-based across most companies or driven by capital concentrating on a few leading stocks.
To analyze memory supply and demand, beyond product quotes, we can identify higher-frequency data by looking at the usage end of AI servers. AI servers require not only GPUs but also server memory and enterprise storage. The public rental market aggregates fragmented computing power demand, reacting more quickly to supply-demand shifts. Consequently, Doubao has incorporated hourly GPU rental rates into every Flatline update, monitoring them alongside server memory and NAND quotes.
By monitoring memory product prices on one side and the tightness of the downstream computing power market on the other, we obtain a more complete picture of memory supply and demand when both move in the same direction. If trends diverge, we continue to verify orders and revenue to determine where the change originates.Doubao continues to record these data points in each update, allowing for direct comparison with previous changes when new product quotes and corporate operational data become available.
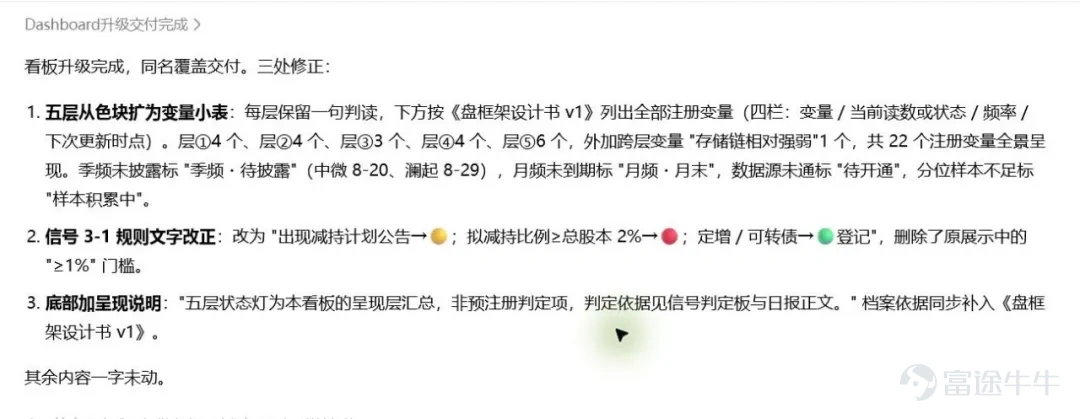
Upon completing the entire project, what satisfied me most about Doubao's task handling was its ability to manage a lengthy process involving repeated file reading, rule modifications, and result updates.The work on 15 companies, 10 alert conditions, daily reports, and dashboards was progressively completed using the same set of materials. When new requirements emerged mid-process, I could directly continue editing within the original task, and it would proceed based on the completed content without needing me to re-explain the entire context each time.
02 How to clearly identify changes in portfolio holdings from a report
The final page generated by Doubao organized different information very clearly. Opening the market watch report for August 20, the top section displayed price changes for several observation days, followed by product quotes and corporate disclosures, and finally, the current results for 10 rules. By scrolling through the page, I could trace the logic from "how the market is trading" to "whether the observed changes impact the previously agreed-upon holding conditions."
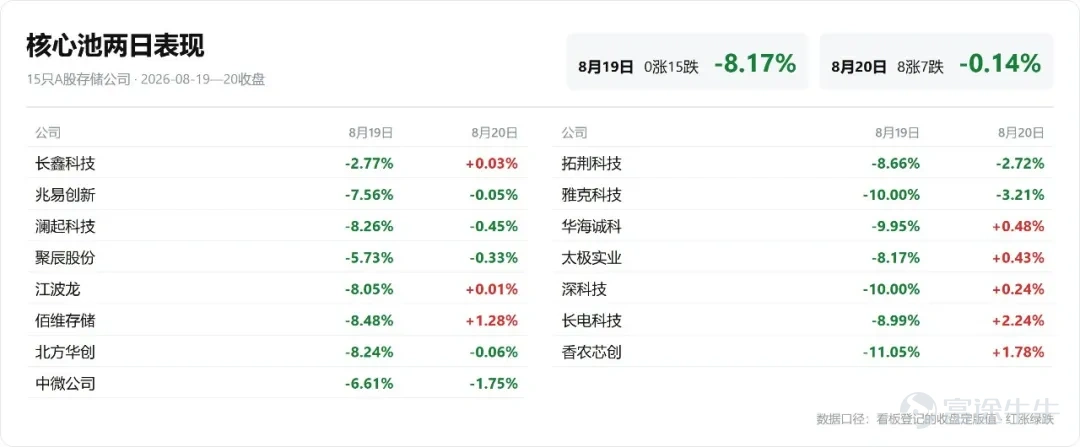
On August 17, all 15 memory stocks rose, with an average gain of approximately 5.5%. The semiconductor sector, used as a benchmark that day, also rose by about 5.2%. The performance of the two groups was very similar; at least from a price perspective, this broad rally appeared to be a sector-wide heating up of the entire semiconductor industry. However, by August 19, all 15 stocks fell again, with an average decline of about 8.2%. For the portfolio, the rise on the 17th did not provide new evidence supporting the original holding rationale, while the sharp drop on the 19th pushed market risk to a level requiring further verification.
Memory is a global business, and shifts in overseas markets overnight can affect my decisions the next day. I had pre-set rules: if the average decline of four fixed overseas targets reaches 3%, or if any single one drops by 8%, I would be alerted to review overnight risk. Before the market open on August 20, the four targets had an average decline of about 1.4%, with the largest drop being approximately 3.5%. Although overseas equity markets weakened, they did not trigger either of these alert thresholds.
At the close on August 20, the 15 core A-share stocks split into 8 gainers and 7 losers, with a slight average decline of 0.14%. Trading volume decreased by approximately 36% compared to the previous day. The broad-based decline seen previously did not continue.The previous day required checking the market pressure borne collectively by the 15 stocks. By the 20th, the performance of these 15 stocks had diverged. Going forward, we need to analyze each company individually to determine which are merely fluctuating with the sector and which are establishing independent trends.

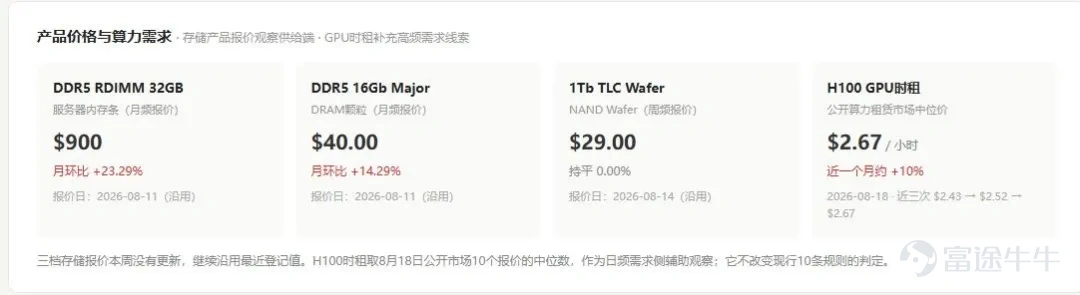
After reviewing market prices, it is necessary to confirm the supply and demand situation for memory products. There were no new quotes on August 20, so the report retained the industry news registered on August 11: server memory modules rose approximately 23% month-over-month, DDR5 chips rose about 14% month-over-month, and NAND wafers remained flat week-over-week. Among the last available quotes, the most significant increases were seen in server memory and DDR5 chips. This step narrows the industry clues down to these two product categories, and the next step is to examine whether there have been corresponding changes in the downstream computing power market.
On August 18, the median hourly rental rate among 10 H100 quotes in the public computing power leasing market was approximately $2.67 per hour. The last three records showed an increase from $2.43 and $2.52 to $2.67, representing a monthly rise of about 10%. While quotes for server memory and DDR5 remained strong, H100 rental rates were also trending upward. We can continue to verify whether these changes are being transmitted to the orders and revenue of relevant companies.
On the same day, if a company releases new financial results, they are incorporated into that company's record. In AMEC's interim report, the most striking figure is a net profit increase of approximately 300%; however, about RMB 1.982 billion of this stems from changes in the valuation of held assets. The report isolates this component. Looking at core operations alone, revenue grew by approximately 35%, and net profit excluding non-recurring items rose by about 108%. These two metrics are more suitable for tracking operational changes in the equipment business and will serve as the baseline for comparison in the next earnings report.
Beyond corporate operations, capital allocation also impacts holding conditions. GigaDevice approved a share buyback and cancellation plan worth RMB 1 billion to 2 billion, which the report categorizes under capital arrangements. The key factors to monitor going forward are the actual amount repurchased and the number of shares cancelled. With each update, Doubao will continue to verify progress on these two items.
At the end of the report, Doubao consolidates ten alert conditions, allowing for an immediate overview of current progress. None of the conditions with available data have been triggered in the current period. However, revenue data for Montage Technology must await the interim report, main force capital flows require complete data sets, and signs of market overheating need to accumulate over several more trading sessions.In summary, the data obtained as of August 20 has not altered the original holding conditions, and areas still awaiting evidence have been clearly identified.Next time, regardless of whether price, supply and demand, corporate operations, capital flows, or external constraints trigger a threshold first, I will re-examine the situation from the corresponding perspective.
03 Conclusion
If you simply want to see how it works, you can start by reading the usage instructions on the project homepage and the A-share storage sector sample. To continue running this sample, download the complete project folder and provide it to an AI assistant capable of reading/writing files and executing tasks. To apply this to your own portfolio, begin by replacing the stock pool and inputting your existing data.
Moving forward, I will continue using this version for my storage sector holdings. As new market trends, industry data, and corporate disclosures are continuously integrated into the same record, it will gradually become clear which indicators are truly helpful and which rules require adjustment. Once this version runs more stably for the storage sector, I will extend this framework to industries such as pharmaceuticals and software, selecting data and judgment criteria tailored to each company's business model, and incrementally adding new samples.
I named it 'flatline,' borrowing from the concept of 'lying flat' (tang ping). The market will continue to fluctuate, and holdings will still cause sleepless nights; but next time such situations arise, I hope to first open this dashboard to clearly identify which specific condition has changed.Delegating long-term monitoring tasks to AI allows me to reserve my energy for moments that truly require judgment. This is the essence of the 'lying flat' approach I aspire to. $Shenzhen Longsys Electronics (301308.SZ)$$SK hynix (SKHY.US)$$CXMT Corporation (688825.SH)$$MONTAGE TECH (06809.HK)$
Disclaimer: This article is for educational and discussion purposes only and does not constitute investment advice.
Risk Disclaimer: The above content only represents the author's view. It does not represent any position or investment advice of Futu. Futu makes no representation or warranty.Read more


Comment (1)
to post a comment
2
5