Optical communication stocks lead the rebound; will the AI optical cycle continue?

Pre-market Analysis: SanDisk (SNDK) & Applied Optoelectronics (AAOI)
Disclaimer:The above content is based on public data and quantitative analysis and is for reference only; it does not constitute investment advice. The market involves risks, so invest with caution. Any investment decision should be made independently based on personal risk tolerance, financial status, and investment objectives, consulting licensed professional institutions when necessary. Past performance does not indicate future returns.
SanDisk SNDK
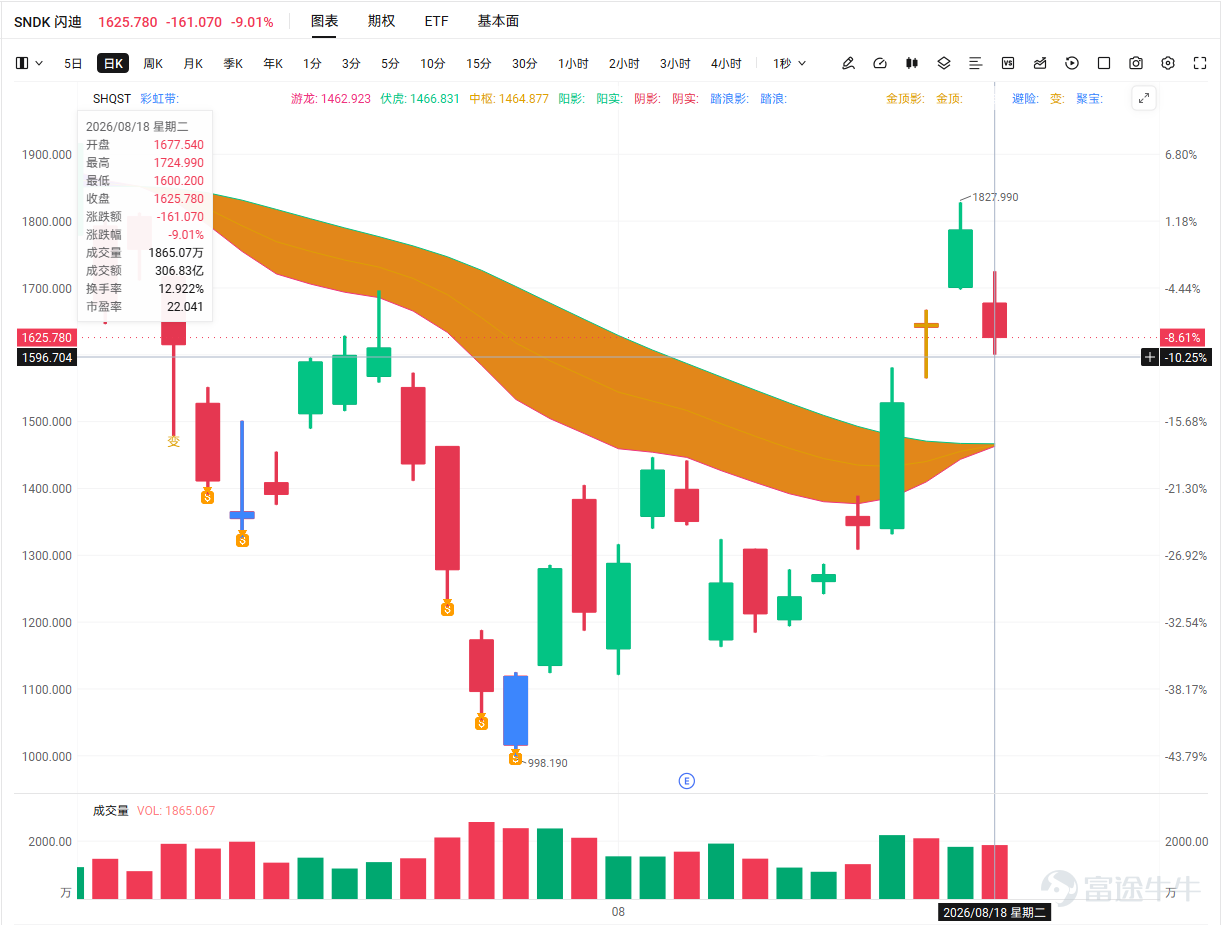
Market Recap: $SanDisk (SNDK.US)$ SanDisk has exhibited a typical "surge-and-plunge"" pattern of extreme volatility over the past two days. On August 17, driven by a triple boost from Morgan Stanley's rating upgrade, the White House's stance on domestic storage, and the market digesting a $93.9 billion backlog of orders, the stock surged 8.88%, briefly hitting a high of $1,828. However, on August 18, it plunged 9.01%, with a long bearish candle engulfing all prior gains, closing at $1,625.78. It continued to fall to $1,586 in after-hours trading, and pre-market trading today saw declines exceeding 10%. Notably,the sharp drop on August 18 was not due to company-specific negative news, but rather a release of systemic risk,as the 30-year U.S. Treasury yield hit a new high since 2007, the Philadelphia Semiconductor Index fell 4.98%, and the memory sector collapsed across the board (Micron -7%, SK Hynix -9%, Kioxia ADR -13%).
Fundamentals: The company's super-cycle logic for AI storage remains intact. Demand for enterprise SSDs is strong, with a record-high order backlog of $93.9 billion. The NAND supply-demand balance remains tight, supporting solid medium- to long-term fundamentals.Short-term volatility stems from high valuations' extreme sensitivity to interest rates.
Technical Analysis:The current price is above the 5-day MA but below the 60-day MA. The short- to medium-term moving averages remain in a bullish arrangement, but from August 17 to August 18, a "two-day reversal pattern formed, where a large bullish candle was completely engulfed by a large bearish candle", with increased trading volume and the J-value pulling back from overbought territory, indicating weakening short-term momentum. Continued declines in pre-market trading on August 19 suggest that 1,600 is today's critical support level.If held, the stock will likely consolidate within the 1,600–1,700 range; if broken, it could quickly retest 1,528, or in extreme cases, reach the mid-band at 1,375.
Applied Optoelectronics (AAOI)
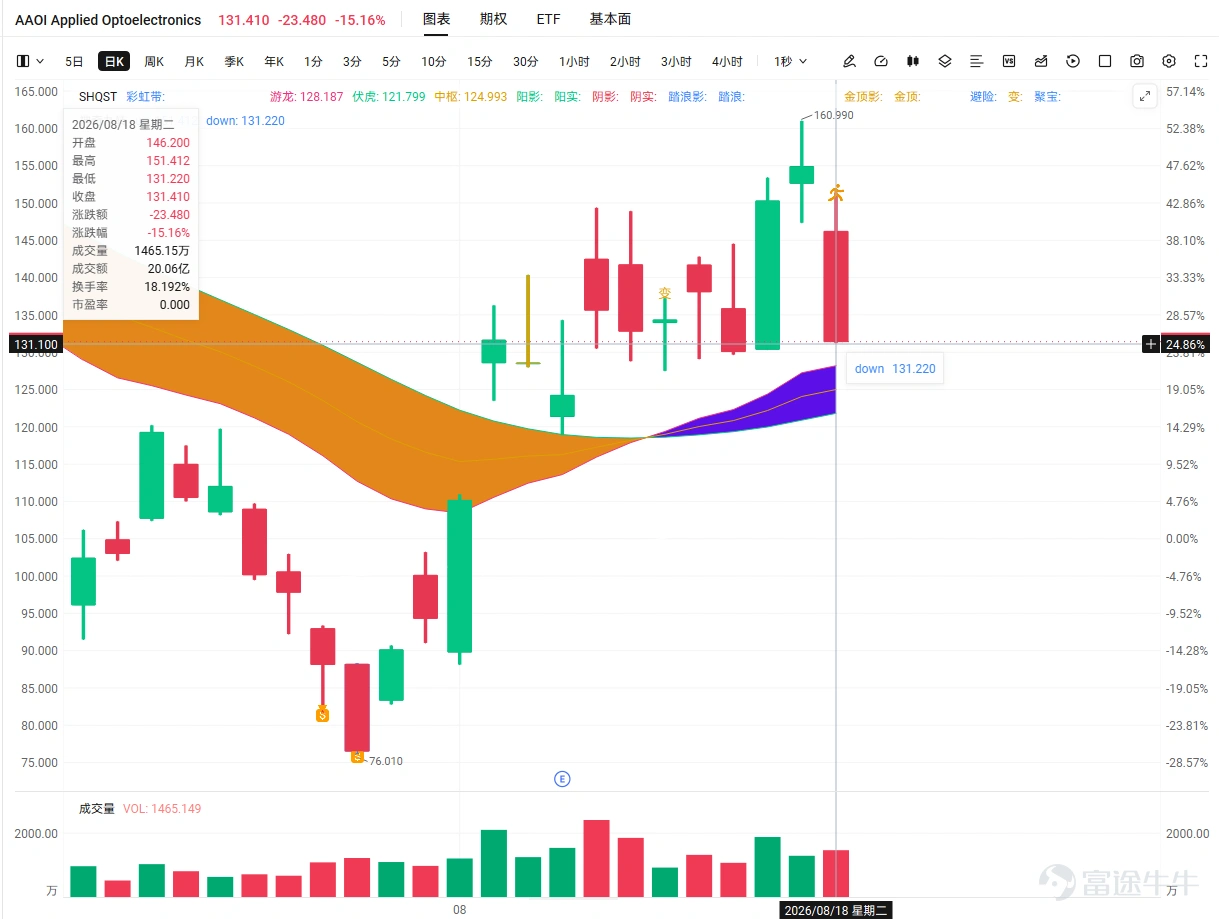
Market Recap: $Applied Optoelectronics (AAOI.US)$ Applied Optoelectronics rose initially over the past two days before crashing. On August 17, it gained 3.07%, briefly hitting a high of $161 before pulling back; on August 18, it plummeted 15.16% to $131.41 on heavy volume, with a turnover rate as high as 17.3%, indicating significant selling pressure. The sharp drop was driven by the confluence of three negative factors: first,a reversal in CPO expectationsNVIDIA explicitly stated that CPO volume will ramp up in the second half of this year, directly disproving the previous market bullish thesis that "CPO adoption would be delayed until 2028." Expectations for an accelerated benefit timeline for the company have failed to materialize.Second, the optical communication sector experienced a broad sell-off, with significant declines in stocks such as Coherent.;Third, excessive gains in the earlier period led to concentrated profit-taking, triggering a stampede effect.。
Fundamentals: The company is a supplier of optical communication and data center optical components. The construction of AI data centers provides long-term support for demand for its 800G/1.6T optical modules. However, the accelerated penetration of CPO (Co-Packaged Optics) technology poses a structural threat to traditional pluggable optical modules, creating pressure for a reassessment of valuation and investment logic. The company has a small profit base and a high debt ratio; while its earnings exhibit high elasticity, its risk resistance is weak.
Technicals:On August 18, heavy trading volume accompanied a long bearish candle that engulfed the gains from August 14 and August 17. The price fell below the MA5, MA10, and MA60, with only the MA20 (118.6) providing support below. A turnover rate of 17.3% indicates intense chip exchange, shifting the short-term trend from bullish to volatile with a bearish bias. The RSI is neutral, and while the MACD histogram remains positive, it is converging rapidly.131 is the first line of defense today, while 118–120 represents a stronger medium-term support zone.Resistance levels for any rebound are dense (136–141), with significant trapped positions overhead.
Content Disclosure: Personal opinion
Risk Disclaimer: The above content only represents the author's view. It does not represent any position or investment advice of Futu. Futu makes no representation or warranty.Read more

Comments
to post a comment
2
1