HBM shortages drive up chip prices: Is the memory supercycle continuing?

Tech Intelligence | SanDisk Soars Over 13% on Investor Day! Does It Dispel "Overcapacity" Concerns?
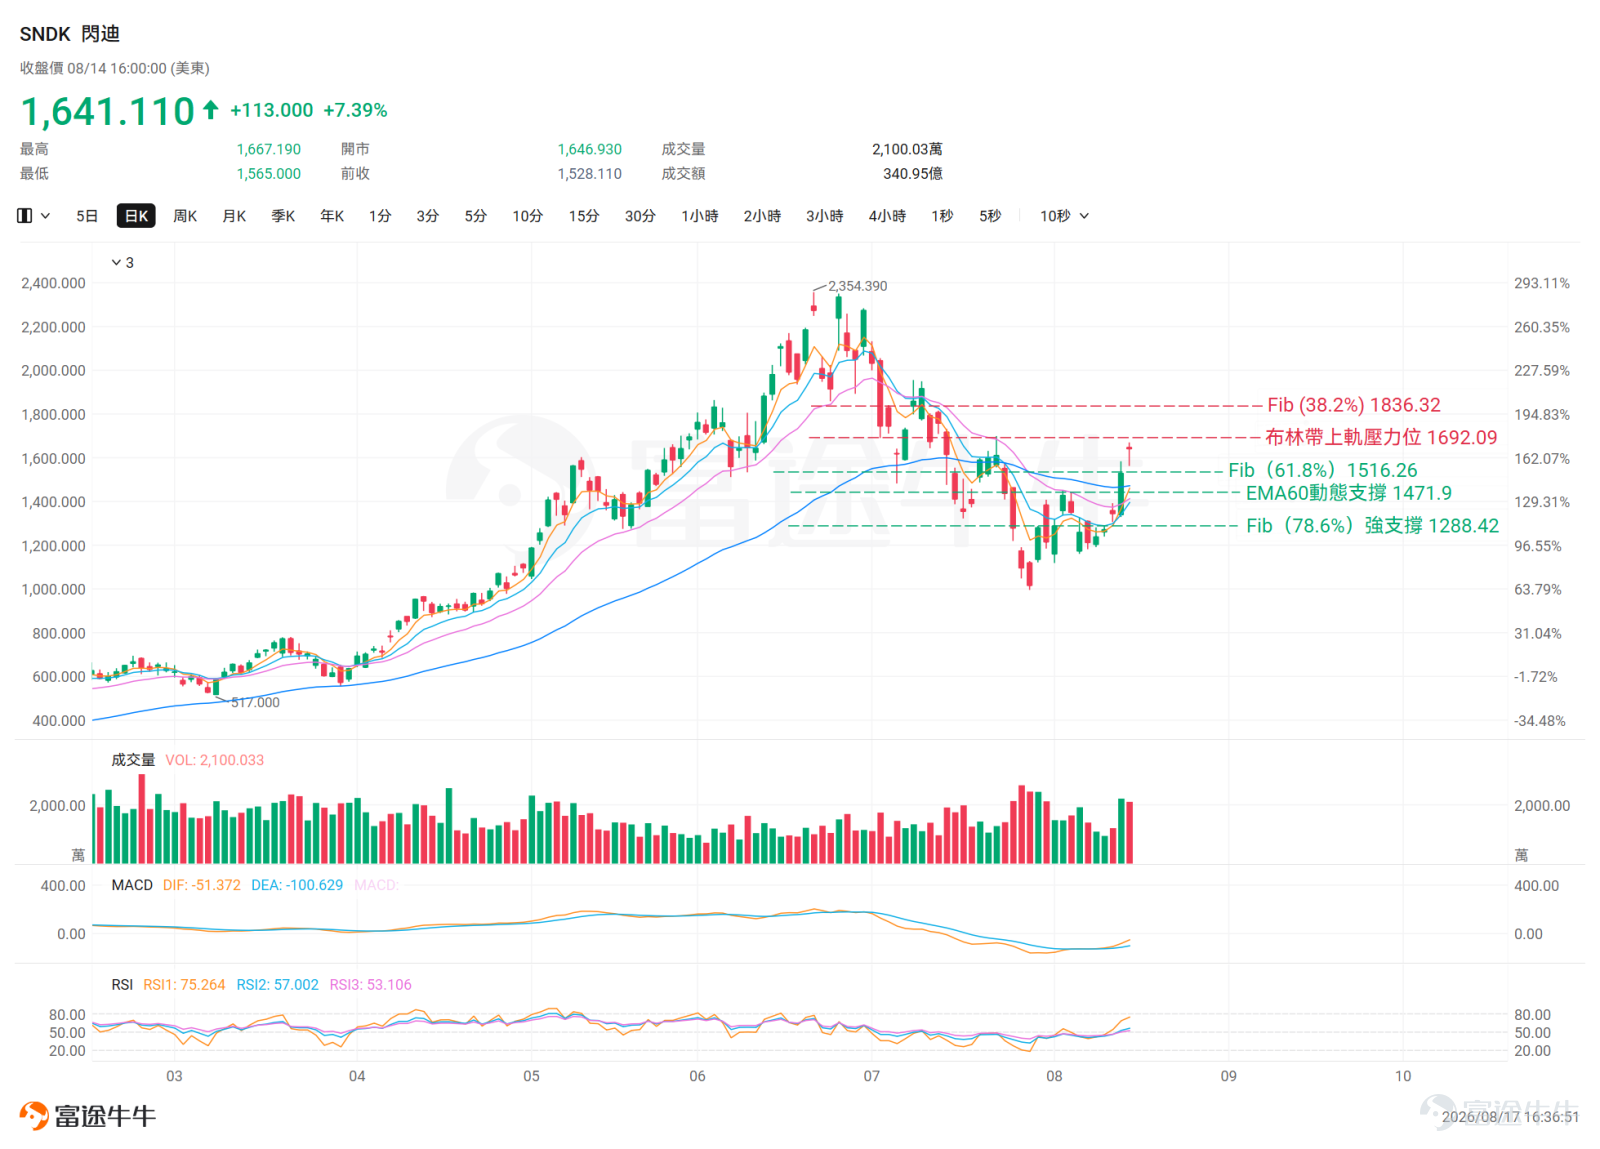
$SanDisk (SNDK.US)$ Held an Investor Day last Wednesday,with the stock price surging approximately 14% on that day.The primary reason was that management providedlong-term financial targets of "80% non-GAAP gross margin and 75% operating margin for FY2028–2030."The message is clear: currently,storage demand is structural, and we are not at the cyclical peak.On August 14, SanDisk closed at $1,641.11, holding firmly above the 61.8% Fibonacci retracement level of $1,516.26, with significant bullish signals in its technical pattern. However, capital flows did not confirm the breakout momentum (with a net outflow of $123 million for the day), reflecting that institutional investors remain cautious about the current stock price level. Below, we analyze SanDisk's current trend structure and key levels from a technical perspective.
Recent stock price movement

SanDisk's short-term trend has shifted from weak to strong,with the stock price now trading above the 60-day EMA ($1,471.90). Technically,it has crossed the medium-term bull-bear dividing line, indicating a bullish short-term direction.However, the 10-day EMA ($1,395.20) remains below the 20-day EMA ($1,412.55), meaning the medium-term moving averages have not yet formed a standard bullish alignment, and the trend confirmation is incomplete.Overall, the pattern shows short-term bullishness but medium-term weakness.The 5-day EMA ($1,460.32) has crossed above the 20-day EMA ($1,412.55), reflectinga genuine recovery in short-term momentum.
Key Technical Indicator Analysis
EMA Moving Averages:EMA5 = $1,460.32, EMA10 = $1,395.20, EMA20 = $1,412.55, EMA60 = $1,471.90; EMA5 > EMA20 > EMA10. Although the stock price has successfully risen above the EMA60, the moving averages have not yet formed a bullish alignment, so confirmation is still needed.
RSI:At 57, it is in a neutral-to-bullish range (50–70), with no obvious top/bottom divergence, leaving room for further upside.
MACD:The MACD line (-51.37) is above the Signal line (-100.63), confirming a golden cross. Although below the zero line, the histogram continues to expand, indicating momentum shifting from bearish to bullish; no divergence signals are present.
Bollinger Bands:The closing price on August 14 was $1,641.11, located between the middle band ($1,353.55) and the upper band ($1,692.09), with the stock price approaching the upper band.
Fibonacci:The closing price on August 14 ($1,641.11) is between the 61.8% Fibonacci level ($1,516.26) and the 50% Fibonacci level ($1,676.29); near-term support is at $1,516.26, and near-term resistance is at $1,676.29. A breakout would target the 38.2% Fibonacci retracement level at $1,836.32.
* Fibonacci retracement levels are automatically calculated based on the highest and lowest prices over the past 60 trading days, not manually selected swing points. Actual support/resistance effectiveness should be confirmed by market price action
Comprehensive assessment
Based on the closing price of August 14, SanDiskThe nearest support level lies at the 61.8% Fibonacci retracement level of $1,516.26,Once this level is broken, the short-term bullish structure will be shaken; below it,the EMA60 ($1,471.90) serves as a key dividing line for the medium-term trend;if this line is lost, it implies that the trend may turn weak again; further down,The area around $1,353.55, where the middle Bollinger Band and the 20-day MA converge, can be viewed as a more significant medium-term support buffer.
In terms of resistance zones,the nearest overhead resistance is concentrated in the dense zone between $1,655 and $1,692 (as of press time, SanDisk has already broken through this level in pre-market trading); further up corresponds to the 38.2% Fibonacci retracement level at $1,836.32,the probability of the stock price encountering resistance within this range should not be overlooked.

Risk Disclaimer: The above content only represents the author's view. It does not represent any position or investment advice of Futu. Futu makes no representation or warranty.Read more


Comments (11)
to post a comment
32
49