SpaceX's second wave of lock-up expirations is here; how should investors position themselves in spa

Options Sir Breaks Down the Hot Topic | Did SpaceX Bottom Out After Lock-Up Expiration?
$SpaceX (SPCX.US)$ Last week saw extremely volatile trading.
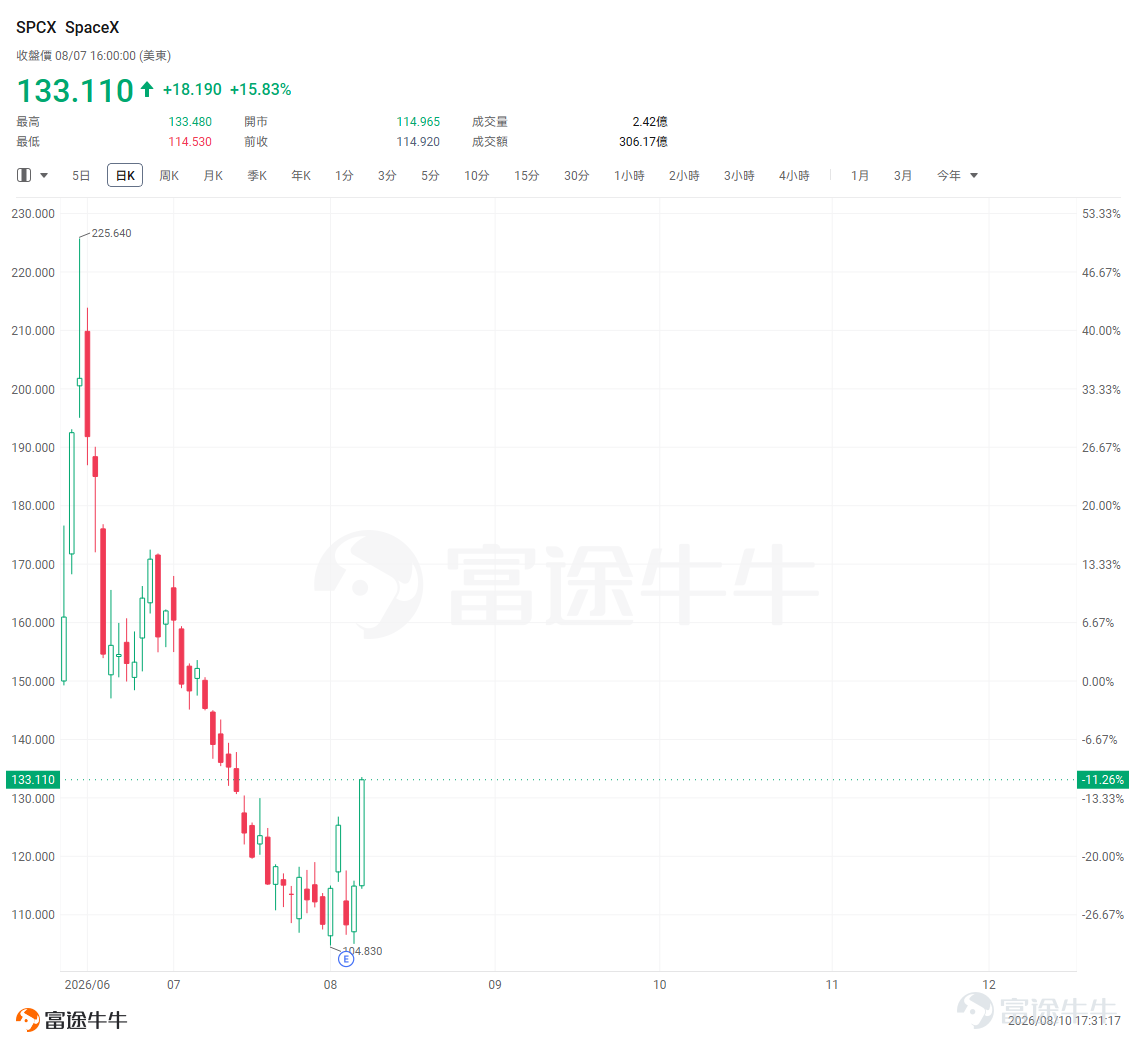
On August 5, after the company released its first earnings report, SPCX plunged 13.6% in a single day, closing at $108.27—the lowest level since its IPO. Market concerns at the time centered on two issues: quarterly capital expenditures as high as $18.4 billion and the imminent first major lock-up expiration on August 6.
The trend then reversed. On August 6, approximately 911.5 million restricted shares became eligible for trading—equivalent to roughly 1.4 times the initial IPO float. Contrary to expectations, SPCX rose instead of falling, closing up 6.14%. It surged another 15.83% on August 7, closing at $133.11,marking a cumulative rebound of nearly 23% over two trading days, with Friday’s trading volume reaching 242 million shares.
SPCX closed Friday at $133.11, just near its IPO price, and $135—the IPO offering price—carries significant psychological and technical importance for market positioning.

The three drivers behind this rebound
Overall, Friday's single-day gain of 15.8% resulted from the confluence of three factors: the overhang from share lock-up expirations has been resolved, earnings expectations have improved, and risk appetite for tech growth stocks has broadly recovered.
1. Lock-up expiration risk was already priced in; actual selling pressure was lower than expected
Over the past month or so, SPCX has declined from its post-IPO high of $225.64 to around $108, marking a cumulative drawdown of more than 50%.A significant portion of this decline stemmed from investors front-running the lock-up expiration risk.
On August 6, the first lock-up expiration date, the theoretical tradable supply increased by over 140% compared to the original public float of 639 million shares. The market widely anticipated concentrated selling by employees and early investors, but large-scale sell-offs failed to materialize in actual trading.
Although the potential supply of shares available for sale was substantial, the number of shares actually offered near $110 was significantly lower than the market’s prior pessimistic expectations.
Notably, both August 6 and 7 saw strong price gains accompanied by high trading volume. For a newly listed stock with a unique float structure, this price-volume pattern suggests that new supply is being effectively absorbed by external capital.
Institutions such as J.P. Morgan also believe that lock-up expiration risks have already been largely reflected in the stock price.Moreover, some early shareholders have strong incentives to hold their positions long-term, further reducing actual selling pressure.
Funds flow data over the past five trading days shows continuous substantial net inflows by institutional investors: over the last three consecutive days, cumulative net inflows exceeded $1.6 billion, indicating strong institutional confidence in the current price level.However, note that net inflows on August 7 have significantly narrowed(declining from $2.17 billion to $816 million). If net outflows follow, caution is warranted regarding the sustainability of the rebound.

II. The market is reassessing earnings reports, leading to a revaluation of AI commercialization progress
On the day of the earnings release, market focus centered on the scale of capital expenditures. In the subsequent trading days, capital flows began reevaluating previously overlooked earnings highlights.
SpaceX reported Q2 revenue of $7.814 billion, up 91.9% year-over-year. Adjusted EBITDA reached $3.538 billion, surging 191% YoY. Connectivity segment revenue totaled $4.291 billion, up 65.8% YoY, with operating profit of $1.656 billion, an increase of 79.4% YoY.
The Starlink business is gradually becoming a stable internal profit driver for the company.Subscriber count grew 101% year-over-year. Although international expansion and lower-priced plans caused ARPU to decline by 22.4%, revenue from government, aviation, maritime, and enterprise customers grew robustly, contributing $939 million in incremental revenue this quarter alone.
AI-related revenue growth was even more remarkable. Q2 AI revenue reached $2.561 billion, soaring 247.5% year-over-year. Of this, approximately $1.6 billion came from AI infrastructure, signaling that the company’s earlier aggressive investments in computing capacity have begun generating commercial returns.
Market perception is shifting. If AI infrastructure can be rapidly monetized through leasing, then the $18.4 billion in capital expenditures should not be viewed merely as a cost burden, but rather as upfront investment driving future revenue growth.This is precisely the logical cornerstone offering the greatest room for imagination in this round of valuation recovery.
3. Improved macro interest rate expectations are restoring the valuation environment for growth stocks
U.S. July employment data came in weaker than expected, reducing market expectations for another rate hike in September, with the Nasdaq rising 1.3% that day. For a long-duration, high-valuation, capital-intensive growth company like SpaceX,declining interest rate expectations will significantly improve the valuation environment.
Key points to watch for subsequent price action
1. Pressure test around the $135 IPO price
SPCX pre-market traded at $137.26, situated in a narrow zone between the upper Bollinger Band at $139.53 and the dense resistance area between $145 and $153. Support below is solid, while resistance intensifies layer by layer above. The short-term technicals appear overbought,whether it can break above $140 on strong volume and close there this week is the key criterion for assessing the nature of the trend.
$140 carries multiple significances—it’s not only a psychological round number but also a pivotal level where scattered trapped positions converge, acting as a battleground between bulls and bears.After the breakout, the stock moved into the $145 range, where the overall筹码 distribution is relatively sparse, with positions at each price level typically ranging from 30,000 to 250,000 shares, suggesting relatively smooth upward price movement.Above $145 lies a concentration zone of trapped positions, where selling pressure from investors seeking to break even will significantly intensify.
The support structure below is equally clear. Currently, 96.43% of holdings are profitable, and the筹码 concentration stands at 80.16%, indicating that the vast majority of holders are in profit with relatively similar cost bases.As a result, the $119–$129 range has formed a solid筹码 stronghold.
If the stock decisively breaks above $140, a rapid rally toward $145 could occur. If it fails to break through, technical overbought conditions combined with resistance from the upper Bollinger Band may prompt a pullback to retest the dense筹码 support zone between $125 and $129. This rebound appears more like an oversold bounce rather than a trend reversal, necessitating adjustments to position sizing and directional bias in options strategies.
II. Ongoing Impact of Staggered Lock-up Expirations
SpaceX employs a relatively uncommon staggered lock-up expiration mechanism.August 6 marks only the first tranche,with additional tranches scheduled for release at specific dates tied to financial reporting windows. By December 8—when the traditional 180-day lock-up period ends—up to approximately 40% of shares could become freely tradable.Elon Musk and certain core shareholders are subject to a longer 366-day lock-up period.
One key metric to monitor closely over the coming months is whether trading volume can remain elevated and share price stable after the expansion of newly added floating shares.
If this condition persists, the market’s discount for lock-up expiration risk will gradually narrow.
3. AI capital expenditure ROI determines the medium-term valuation ceiling
In Q2, SpaceX’s capital expenditures reached $18.369 billion, of which $15.828 billion was allocated to its AI business. During the same period, the AI segment generated $2.561 billion in revenue but still reported an operating loss of $1.257 billion. These figures lie at the heart of current market divergence.AI revenue is growing rapidly, but capital investment is increasing even faster.
Management has set an even more aggressive target,projecting that by the end of 2026, the company could achieve an annualized revenue run-rate of $100 billion.
If this target is progressively validated through signed contracts, cloud computing lease revenue, and Starlink growth, the current valuation will become easier for the market to digest. However, if AI revenue growth significantly lags behind the pace of capital expenditure expansion after Q3, market concerns over the cash-burning nature of the AI business could resurge.
Based on approximately 13.18 billion shares outstanding as of July 28 and a share price of $133.11, SpaceX’s current market cap remains close to $1.75 trillion. Annualizing Q2 revenue yields only about $31.3 billion, implying a simple price-to-sales multiple of over 50x.If management’s year-end target of a $100 billion annualized revenue run-rate is ultimately achieved,The corresponding valuation remains around 17x sales.The company must continue delivering very high growth for the current price to remain fundamentally justified.
Investment strategy assessment at current levels
$SpaceX (SPCX.US)$ IV dropped sharply from 120.87% on August 3 to 89.38%, but the absolute IV level remains close to 90%, indicating that options are still expensively priced. On August 7, call option volume surged to 1.76 million contracts on the day of a sharp rally, and the put/call ratio (PCR) fell from above 1.0 in the prior two days to 0.70, reflecting a rapid shift toward bullish sentiment.
On August 5, options trading volume rose to its highest level since mid-June, with put volume exceeding call volume; the $100/$105 puts were particularly active, reflecting strong demand for downside protection ahead of the lock-up expiration.Since then, the underlying stock has rallied sharply; if this bearish hedging continues to unwind, it could provide additional fuel for a short-term bounce.

Based on the latest 20 unusual activity reports, institutional investors have primarily taken bearish or hedging positions over the medium term (1–5 months), but remain confident in the long-term valuation.Short-term speculative capital shows clear signs of chasing the rally, though mostly through cheap, deep out-of-the-money contracts.
1. Bull Put Spread – moderately bullish but not chasing higher prices
Suitable for investors who believe SPCX has formed a bottom and is likely to hold around $120 over the next month, but are uncertain whether it can quickly break above $150.
The advantage of this strategy lies in capitalizing on SPCX's relatively high implied volatility (IV) to collect time value. It is suitable when one expects the market not to decline, or anticipates a limited upside in the underlying stock price. Essentially, this is a 'low-risk short put strategy' with characteristics of an option seller. At initiation, the premium results in a net cash inflow, leading to a low initial cost.It is best implemented when implied volatility is high. The strategy can generate profits even if the stock price remains range-bound, flat, or volatile, and it features limited profit and loss potential.
This strategy consists of two puts: selling a higher-strike out-of-the-money put (to collect a higher premium) while simultaneously buying a lower-strike put (as protection). Both puts share the same expiration date, strike prices, and contract quantity. Maximum profit—equal to the net premium received at initiation—is achieved when the stock price rises above the higher strike, rendering both options out-of-the-money. If the underlying stock declines, the long lower-strike put caps the maximum loss.
(The chart below illustrates the simulated profit/loss profile of this strategy at expiration. The displayed graphic is for demonstration purposes only and does not constitute investment advice or guarantees; market conditions change rapidly, and the prices shown do not reflect real-time data.)

2. Covered Call – more suitable for those who already hold the underlying stock
Suitable for investors who have already bought SPCX shares near a lower price level and believe thatSPCX has medium-term upside potential, but after a recent rebound of approximately 23%, there is perceived resistance ahead.investors.
If the stock trades sideways or experiences a modest rise, additional premium income can be collected. Even if assignment occurs due to a breakout, it effectively locks in profits at a higher price. The drawback is clear: if SPCX experiences another sharp single-day surge like last Friday’s 15% jump, gains will be capped. Therefore, investors who are strongly bullish and expect a major upward move should avoid the covered call strategy.
(The chart below illustrates the simulated profit/loss profile of this strategy at expiration. The displayed graphic is for demonstration purposes only and does not constitute investment advice or guarantees; market conditions change rapidly, and the prices shown do not reflect real-time data.)

Finally, Options Sir has a small giveaway for fellow investors—feel free to claim it!Options Starter Pack
*This promotion is exclusively available to invited Hong Kong users. Click to learn more.Detailed terms and conditions of the promotion >>
Market conditions are complex and ever-changing,Options strategiesToo many choices and unsure how to proceed? Let Futubull help you build a strategy in three simple stepsOptions strategies, making investing simple and efficient!

Options Risk Disclosure:An option is a contract that grants the holder the right—but not the obligation—to buy or sell an underlying asset at a predetermined price on or before a specified date. Option prices are influenced by multiple factors, including the current price of the underlying asset, the strike price, time to expiration, and implied volatility. Implied volatility reflects the market’s expectation of future price fluctuations over the life of the option; it is derived by reverse-engineering the Black-Scholes pricing model and is commonly viewed as an indicator of market sentiment. When investors anticipate higher volatility, they may be willing to pay more for options to hedge their risk, resulting in higher implied volatility. Traders and investors use implied volatility to assess the attractiveness of option prices, identify potential mispricings, and manage their risk exposure.
Disclaimer:This content does not constitute an offer, solicitation, recommendation, opinion, or any form of guarantee regarding any securities, financial products, or instruments. The risk of loss in trading options can be substantial. In certain circumstances, your losses may exceed the initial margin deposit. Even if you place contingent orders such as 'stop-loss' or 'limit' orders, there is no assurance that losses will be avoided, as market conditions may prevent execution of these orders. You may be required to deposit additional margin on short notice. If you fail to meet such margin calls within the stipulated time, your open positions may be liquidated. You remain fully liable for any resulting deficit in your account. Therefore, prior to trading options, you should thoroughly research and understand how options work and carefully consider whether such trading aligns with your financial situation and investment objectives. If you trade options, you should become familiar with the procedures for exercising options and handling expiration, as well as your rights and obligations upon exercise or expiration. Options trading involves significant risk and is not suitable for all investors. Investors should carefully read"Characteristics and Risks of Standardized Options"。
Risk Disclaimer: The above content only represents the author's view. It does not represent any position or investment advice of Futu. Futu makes no representation or warranty.Read more


Comments (4)
to post a comment
31
58