English
Back
Open Account
Gold prices break above USD 4,400—can the precious metals rally accelerate?

NANHUA FUTURES
joined discussion · Aug 7 17:17

Gold prices have broken above 4,100; central banks continue to accelerate gold purchases—what’s the outlook for gold this year?

This week, gold prices broke above 4,100, marking an upside breakout following a triangle consolidation pattern.
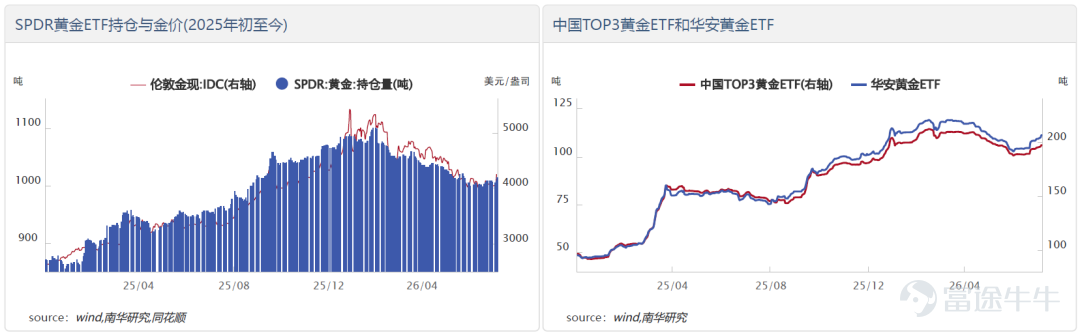
Recently, London spot gold broke out of its $4,000–$4,100 trading range, technically confirming a valid upside breakout from the triangle consolidation pattern that has persisted since July. On the capital flow front, significant inflows into both domestic and international futures positions and gold ETFs further underscore a clear improvement in market sentiment.
The core drivers behind this rally are twofold: First, easing tensions between the U.S. and Iran pushed oil prices lower, and weaker-than-expected U.S. employment data released during the week reduced market expectations for further Fed tightening. Second, U.S. Treasury yields have taken on a 'bull steepener' structure—short-end yields declined, reflecting cooling rate hike expectations, while long-end yields fell more slowly due to fiscal debt repayment pressures. This yield curve configuration itself signals that elevated Treasury yields are exerting significant pressure on U.S. public finances, implicitly constraining the Federal Reserve’s policy maneuverability.
Notably, the Bank of Japan recently intervened in the yen through FIMA repo operations, complemented by a strategy of selling euros to buy yen. The immediate goal was to alleviate additional selling pressure on the U.S. Treasury market and prevent a sharp spike in yields that could result if Japan were to dump Treasuries en masse to defend the yen. However, this also objectively highlights a dilemma facing the Federal Reserve within the current dollar system: it must simultaneously control inflation and ensure sufficient demand in the Treasury market while managing fiscal debt servicing costs. If markets continue to price in this 'one-hand-tied-behind-the-back' policy constraint, medium- to long-term doubts about the credibility of the dollar system will persist, thereby providing sustained medium- to long-term support for central banks and institutional investors allocating to gold.
Recently, the Bank of Korea has also joined the global central bank gold-buying trend, while the People's Bank of China has accelerated its gold purchases since March this year. Tether disclosed that it bought 14 metric tons of gold in Q2, compared to approximately 6 metric tons in Q1, indicating an acceleration in purchases—primarily driven by USDT’s increased allocation to gold. In the first half of the year, Tether accumulated approximately 20 metric tons of gold, making it the fifth-largest official buyer after Poland, Uzbekistan, China, and Kazakhstan.
This week, gold prices broke above 4,100, marking an upside breakout following a triangle consolidation pattern. Recently, London spot gold broke out of its $4,000–$4,100 trading range, technically confirming a valid upside breakout from the triangle consolidation pattern that has persisted since July. On the capital flow front, significant inflows into both domestic and international futures positions and gold ETFs further underscore a clear improvement in market sentiment. The core drivers behind this rally are twofold: First, easing tensions between the U.S. and Iran pushed oil prices lower, and weaker-than-expected U.S. employment data released during the week reduced market expectations for further Fed tightening. Second, U.S. Treasury yields have taken on a 'bull steepener' structure—short-end yields declined, reflecting cooling rate hike expectations, while long-end yields fell more slowly due to fiscal debt repayment pressures. This yield curve configuration itself signals that elevated Treasury yields are exerting significant pressure on U.S. public finances, implicitly constraining the Federal Reserve’s policy maneuverability. Notably, the Bank of Japan recently intervened in the yen through FIMA repo operations, complemented by a strategy of selling euros to buy yen. The immediate goal was to alleviate additional selling pressure on the U.S. Treasury market and prevent a sharp spike in yields that could result if Japan were to dump Treasuries en masse to defend the yen. However, this also objectively highlights a dilemma facing the Federal Reserve within the current dollar system: it must simultaneously control inflation and ensure sufficient demand in the Treasury market while managing fiscal debt servicing costs. If markets continue to price in this 'one-hand-tied-behind-the-back' policy constraint, medium- to long-term doubts about the credibility of the dollar system...
The People's Bank of China continues to increase its gold reserves
According to the latest official reserve asset data released on the People's Bank of China website, China’s foreign exchange reserves stood at USD 3,418.78 billion in July, with gold reserves reported at 76.08 million troy ounces (approximately 2,366.353 metric tons), up by 640,000 troy ounces (about 19.91 metric tons) from the previous month, signaling further acceleration in central bank gold buying. Since the People's Bank of China resumed gold purchases in November 2024, it has marked its 21st consecutive month of gold accumulation. As of July 2026, the central bank has purchased over 60 metric tons of gold year-to-date.
This week, gold prices broke above 4,100, marking an upside breakout following a triangle consolidation pattern. Recently, London spot gold broke out of its $4,000–$4,100 trading range, technically confirming a valid upside breakout from the triangle consolidation pattern that has persisted since July. On the capital flow front, significant inflows into both domestic and international futures positions and gold ETFs further underscore a clear improvement in market sentiment. The core drivers behind this rally are twofold: First, easing tensions between the U.S. and Iran pushed oil prices lower, and weaker-than-expected U.S. employment data released during the week reduced market expectations for further Fed tightening. Second, U.S. Treasury yields have taken on a 'bull steepener' structure—short-end yields declined, reflecting cooling rate hike expectations, while long-end yields fell more slowly due to fiscal debt repayment pressures. This yield curve configuration itself signals that elevated Treasury yields are exerting significant pressure on U.S. public finances, implicitly constraining the Federal Reserve’s policy maneuverability. Notably, the Bank of Japan recently intervened in the yen through FIMA repo operations, complemented by a strategy of selling euros to buy yen. The immediate goal was to alleviate additional selling pressure on the U.S. Treasury market and prevent a sharp spike in yields that could result if Japan were to dump Treasuries en masse to defend the yen. However, this also objectively highlights a dilemma facing the Federal Reserve within the current dollar system: it must simultaneously control inflation and ensure sufficient demand in the Treasury market while managing fiscal debt servicing costs. If markets continue to price in this 'one-hand-tied-behind-the-back' policy constraint, medium- to long-term doubts about the credibility of the dollar system...
The price range may shift higher this year; short-term focus remains on resistance at 4,300
We believe the current rally in gold prices likely represents a sustained, intermediate rebound rather than the start of a new trend. Our baseline view is that the Federal Reserve has a low probability of actually hiking rates this year, as elevated U.S. Treasury yields and volatility in tech stocks—against the backdrop of approaching U.S. midterm elections—may prompt the Fed to adopt a more cautious stance. The downward revision of rate hike expectations is the primary driver behind gold’s rebound in the second half, suggesting the downtrend since March could reverse. However, the current rally still largely hinges on improved investor sentiment.
We expect London gold prices to rebound toward approximately USD 4,800 per troy ounce in the second half of the year. This target is primarily anchored to the price range observed in early May, when markets priced in no rate hikes or cuts from the Fed for the year. Given that inflation remains significantly above the 2% target, we also see limited likelihood of Fed rate cuts in the second half. Gold prices may therefore exhibit a pattern of 'higher trading range but capped upside' for the remainder of the year.
In the near term, market attention has shifted to Friday evening’s U.S. nonfarm payrolls report and next Wednesday’s CPI data. Investors will use these indicators to assess whether fundamentals support a further weakening of Fed rate hike expectations, which will be critical in determining whether London gold can break above the 4,300 level.
We view gold’s long-term anchor as the credibility of the global monetary system and the trend toward de-dollarization. Sustained large-scale central bank gold buying provides robust systemic floor support for gold prices. Over the medium term, investment demand remains the key driver of price elasticity, with divergent market views on the Fed’s monetary policy directly reflected in volatile flows into and out of ETFs and futures markets.
This week, gold prices broke above 4,100, marking an upside breakout following a triangle consolidation pattern. Recently, London spot gold broke out of its $4,000–$4,100 trading range, technically confirming a valid upside breakout from the triangle consolidation pattern that has persisted since July. On the capital flow front, significant inflows into both domestic and international futures positions and gold ETFs further underscore a clear improvement in market sentiment. The core drivers behind this rally are twofold: First, easing tensions between the U.S. and Iran pushed oil prices lower, and weaker-than-expected U.S. employment data released during the week reduced market expectations for further Fed tightening. Second, U.S. Treasury yields have taken on a 'bull steepener' structure—short-end yields declined, reflecting cooling rate hike expectations, while long-end yields fell more slowly due to fiscal debt repayment pressures. This yield curve configuration itself signals that elevated Treasury yields are exerting significant pressure on U.S. public finances, implicitly constraining the Federal Reserve’s policy maneuverability. Notably, the Bank of Japan recently intervened in the yen through FIMA repo operations, complemented by a strategy of selling euros to buy yen. The immediate goal was to alleviate additional selling pressure on the U.S. Treasury market and prevent a sharp spike in yields that could result if Japan were to dump Treasuries en masse to defend the yen. However, this also objectively highlights a dilemma facing the Federal Reserve within the current dollar system: it must simultaneously control inflation and ensure sufficient demand in the Treasury market while managing fiscal debt servicing costs. If markets continue to price in this 'one-hand-tied-behind-the-back' policy constraint, medium- to long-term doubts about the credibility of the dollar system...
Investment Consulting Business Qualification: CSRC License [2011] No. 1290
Author: Nanhua Research Institute, Xia Yingying (Investment Advisory License No.: Z0016569)
Report Date: August 7, 2026
This week, gold prices broke above 4,100, marking an upside breakout following a triangle consolidation pattern. Recently, London spot gold broke out of its $4,000–$4,100 trading range, technically confirming a valid upside breakout from the triangle consolidation pattern that has persisted since July. On the capital flow front, significant inflows into both domestic and international futures positions and gold ETFs further underscore a clear improvement in market sentiment. The core drivers behind this rally are twofold: First, easing tensions between the U.S. and Iran pushed oil prices lower, and weaker-than-expected U.S. employment data released during the week reduced market expectations for further Fed tightening. Second, U.S. Treasury yields have taken on a 'bull steepener' structure—short-end yields declined, reflecting cooling rate hike expectations, while long-end yields fell more slowly due to fiscal debt repayment pressures. This yield curve configuration itself signals that elevated Treasury yields are exerting significant pressure on U.S. public finances, implicitly constraining the Federal Reserve’s policy maneuverability. Notably, the Bank of Japan recently intervened in the yen through FIMA repo operations, complemented by a strategy of selling euros to buy yen. The immediate goal was to alleviate additional selling pressure on the U.S. Treasury market and prevent a sharp spike in yields that could result if Japan were to dump Treasuries en masse to defend the yen. However, this also objectively highlights a dilemma facing the Federal Reserve within the current dollar system: it must simultaneously control inflation and ensure sufficient demand in the Treasury market while managing fiscal debt servicing costs. If markets continue to price in this 'one-hand-tied-behind-the-back' policy constraint, medium- to long-term doubts about the credibility of the dollar system...
Risk Disclaimer: The above content only represents the author's view. It does not represent any position or investment advice of Futu. Futu makes no representation or warranty.Read more
36K Views
Report
Comments
Write a Comment...