
HK Stock Market Barometer | Super Earnings Week for HK Stocks!

Hong Kong stocks ended higher amid volatility—what signals are hidden in the capital flows? Can tech stocks prop up the market and open upside potential for the Hang Seng Index?
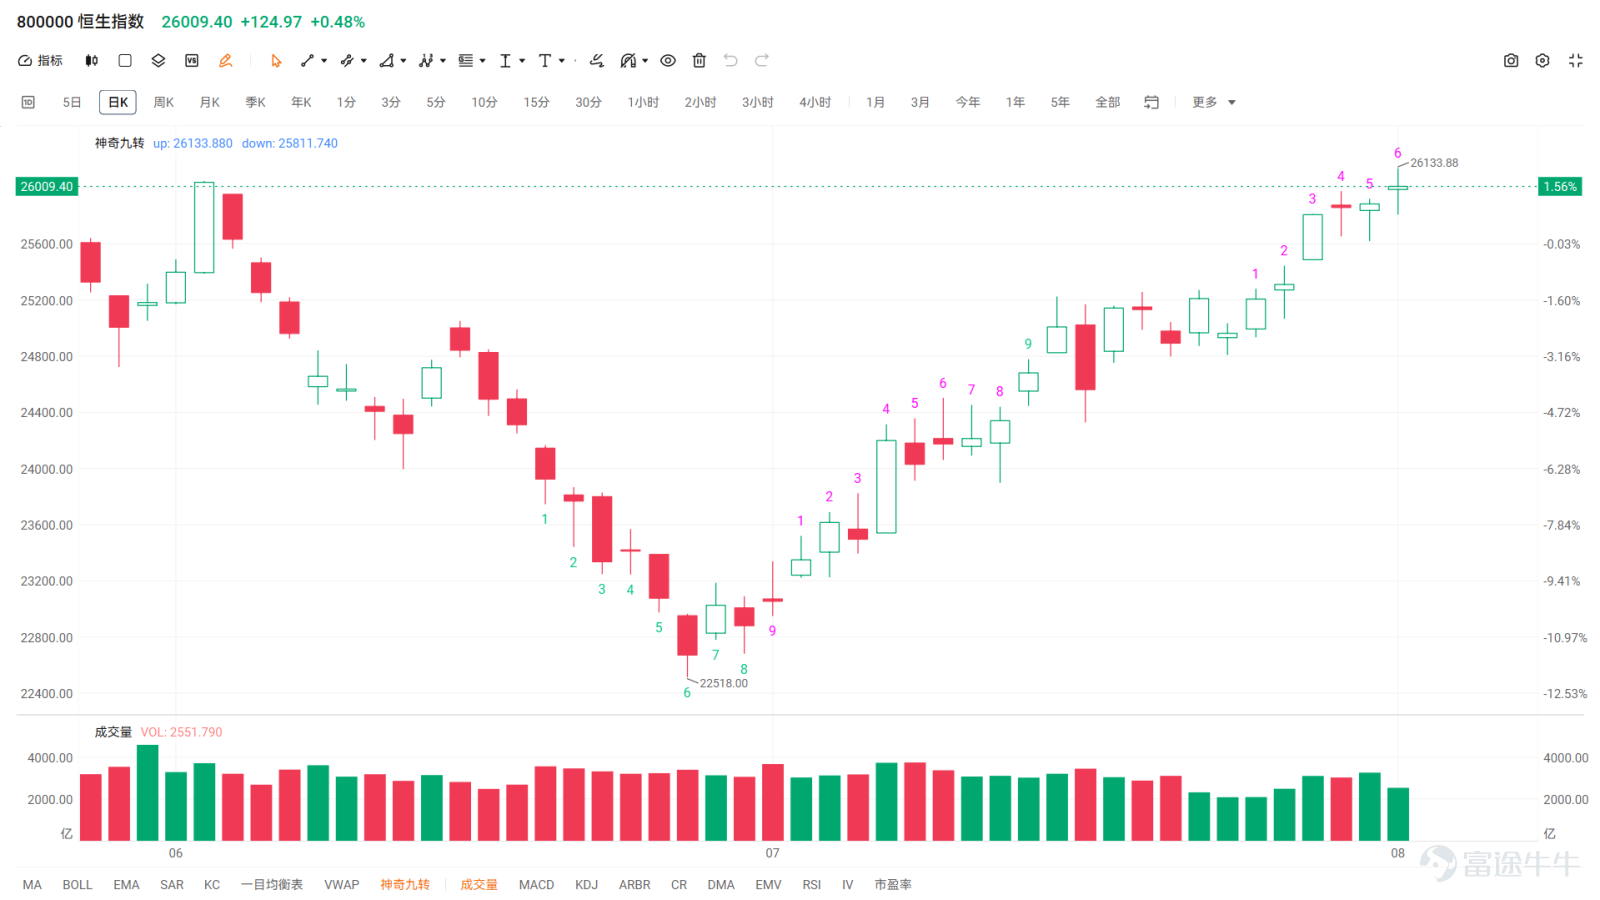
The Hang Seng Index closed at 26,009.4 points today, up 0.48%, with total main board turnover reaching HK$255.179 billion. The Hang Seng Tech Index rose 0.96% to close at 4,875.61 points. Hong Kong equities traded in a volatile range throughout the session: after an early rally that tested the intraday high of 26,133, the market pulled back slightly; it then stabilized and rebounded during the afternoon, holding above the key psychological level of 26,000 by the close. The index dipped as low as 25,811 during the session, but encountered clear buying support. However, the rally lacked follow-through from incremental capital—a classic sign of a low-volume bounce. Overall price swings remained limited, with heightened tug-of-war between bulls and bears, and selling pressure gradually emerging during rallies.
Leading gainers:
Internet & tech: Alibaba surged over 7%, Tencent rose 3.2%, while Baidu, Kuaishou, and Bilibili all strengthened in tandem, reflecting a recovery in sentiment toward AI application plays. The photovoltaic sector saw a breakout, with Xinyi Solar and Flat Glass Group surging sharply, driven by policy tailwinds that spurred valuation repair across the sector. Robotics, cloud computing, and power equipment concepts also showed resilient gains.
Laggards:
Semiconductors and memory chips faced persistent pressure all day. Cyclical sectors such as base metals and oil & petrochemicals retreated. Mainland property developers, Chinese banks, and local real estate stocks edged lower. Within the tech sector, notable divergence emerged—Xiaomi and select new energy vehicle names declined against the broader trend, underscoring that capital is rotating selectively rather than driving a broad-based rally.
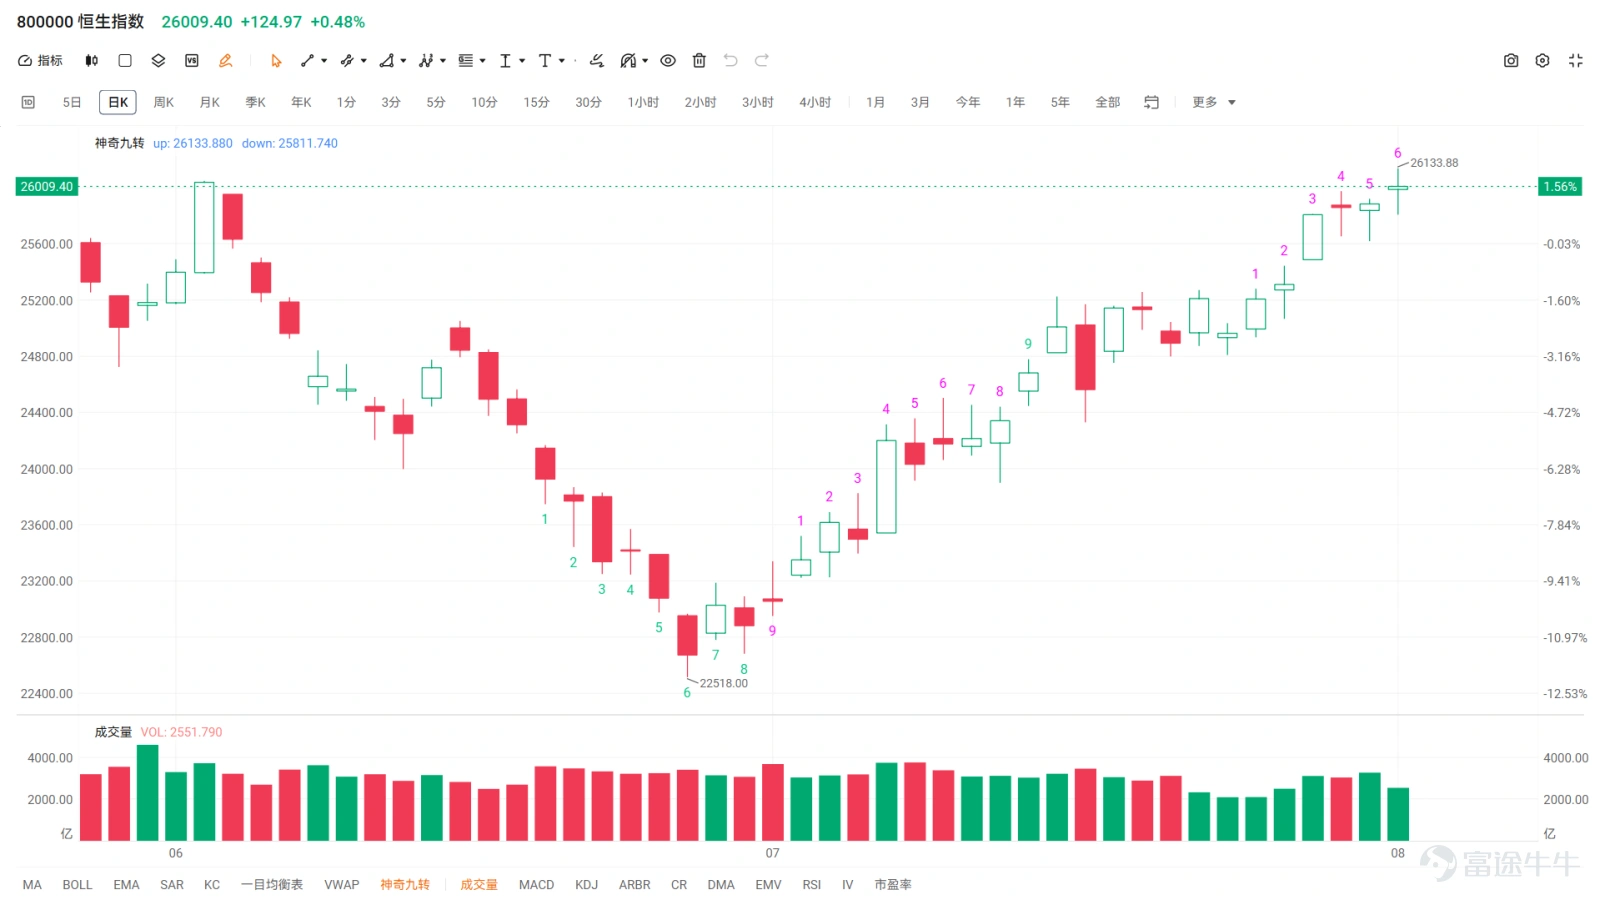
From a technical standpoint, as mentioned in last Friday’s wrap-up, sentiment recovery is largely complete, and the market remains strong at this level. On the weekly chart, a double-sized bullish ‘sentiment candle’ has appeared. Historically, such a pattern often leads to a rally followed by a pullback within the next one to three weeks. However, the weekly chart also shows a consecutive bullish ‘golden column’ formation. Even if a pullback occurs, as long as the index holds above the support line—the low of the second bullish candle at 23,229—there remains upside potential ahead. On the monthly chart, the index is now approaching a key resistance zone. The first institutional target is calculated as the high of the third candle plus the length of its lower shadow, yielding 26,315.78 (for details on this calculation, refer to Friday’s review). The recent correction clearly broke below this level, so the focus now shifts to whether the monthly chart can break and sustain above this resistance—such a move would signal further room for gains.

Content Disclosure: Personal opinion
Risk Disclaimer: The above content only represents the author's view. It does not represent any position or investment advice of Futu. Futu makes no representation or warranty.Read more


Comments
to post a comment
8