
NVIDIA is pushing hard on 800V—so who’s selling the shovels in power semiconductor?

Sector Deep Dive | Silicon Carbide (SiC): From EV Growth Driver to AI Essential Mainstream Sector
I. Key Takeaways
Silicon carbide has evolved from an automotive support material to a core, mission-critical component of AI computing infrastructure. New energy vehicles currently form the earnings baseline, while AI servers represent the key long-term growth driver.
The current industry upcycle exhibits strong structural characteristics:High-end substrates and devices tailored for automotive and AI applications are recovering first, while general-purpose industrial-grade products remain in oversupply.
High-end qualified capacity is constrained by yield rates and certification barriers, representing the true bottleneck in the industry today. This tightness in high-end capacity is expected to gradually propagate across the entire supply chain.
💡 Growth Drivers:Rising power consumption of AI computingWidespread adoption of high-voltage DC architectures in data centers, coupled with800V electric vehicles are accelerating market penetration, jointly driving triple growth in silicon carbideproduct specifications, per-unit content, and value per watt。
Technical barriers in upstream crystal growth and epitaxial processes have caused qualified capacity expansion to lag significantly behind demand growth, supporting sustained industry prosperity.
🔍Positioning:Prioritize downstream power device leaders, whose integrated capabilities in device design, manufacturing, and ecosystem partnerships create high-end barriers and offer greater medium- to long-term certainty. Midstream and upstream substrate and epitaxy leaders are rapidly scaling wafer sizes and capacity, giving them strong elasticity under industry-wide beta.
⚠️ Risk warning: Industry capacity expansion exceeding expectations could reignite repeated price wars; yield ramp-up for large-diameter wafers may progress slower than anticipated.
II. Key Highlights
As a core material of third-generation semiconductors (representing wide-bandgap semiconductors),silicon carbide’s fundamental physical advantages ensure its irreplaceability in high-end manufacturing.:
🔵 Bandgap is that of silicon3 times → High-temperature resilience, with a maximum operating temperature exceeding 600°C
🔵 Breakdown electric field strength is that of silicon10 times → High voltage tolerance, suitable for platforms above 800V
🔵 Thermal conductivity is that of silicon3 times → Excellent heat dissipation, aligning well with AI's high power consumption requirements
Demand is shifting from being driven solely by new energy vehicles to a multi-engine growth model powered by 'vehicles + AI computing power + advanced packaging.'
III. Industry Chain Segmentation
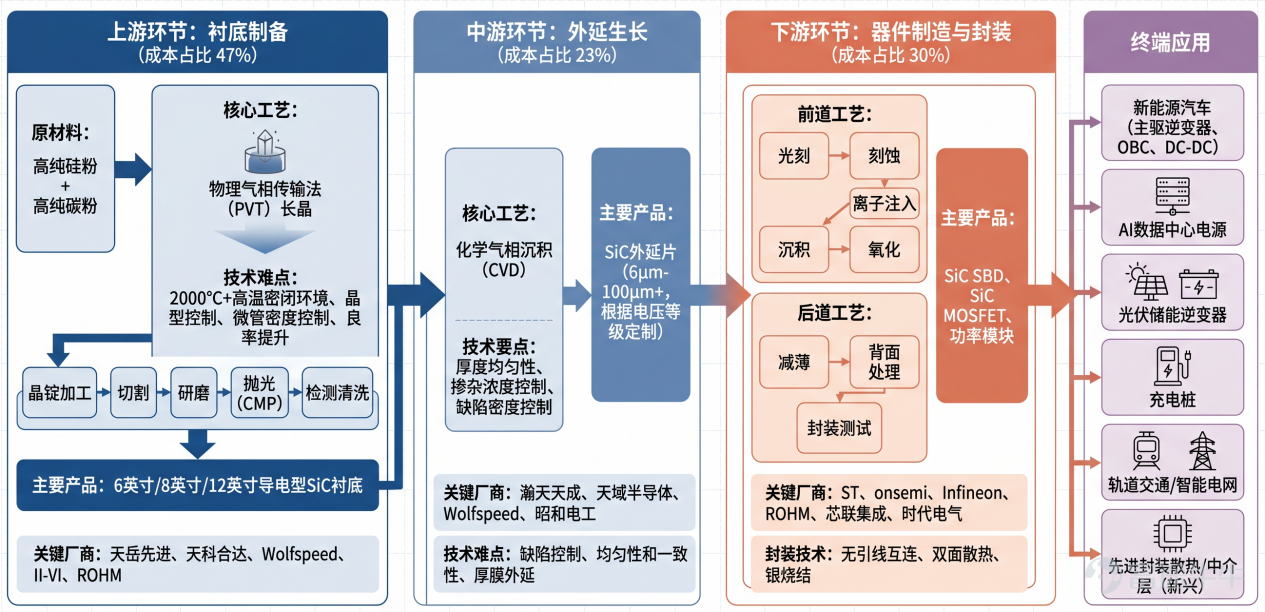
[Upstream: Raw Materials and Substrates] Silicon carbide powder → Crystal growth via PVT method → Cutting/grinding/polishing → Substrate wafers (conductive type for power devices, semi-insulating type for RF/GaN epitaxy)
[Midstream: Epitaxy] High-quality single-crystal thin films are grown on substrates via CVD epitaxy, with precise control over thickness and doping uniformity. Two technology paths:
🟢 Homoepitaxy: Growing silicon carbide thin films on silicon carbide substrates → Used for power devices
🟢 Heteroepitaxy: Growing gallium nitride thin films on silicon carbide substrates → Used for RF devices, with higher technological premium and barriers to entry
[Downstream: Device Fabrication + Applications] Epitaxial wafers → Device design/fabrication (MOSFETs, diodes, power modules) → Packaging and testing → End applications
💡 Value distribution: Substrates account for [X]% of SiC power device costs47%, epitaxy accounts for [X]%23%, and device fabrication accounts for [X]%30%。
Core elasticity is concentrated in substrates and epitaxy, but downstream device design and ecosystem integration are erecting 'high-end barriers.'——
🏭Generational technological gaps in chip architecture (e.g., shifting from planar to trench structures) cannot be bridged by raw materials alone.This is also the fundamental rationale behind downstream IDM vendors leveraging their barrier advantages to sell silicon carbide modules at premium prices to automotive and AI data center markets.

Silicon carbide industry chain structure diagram
III. Price Trends
In 2024–2025, the silicon carbide industry underwent intense price competition: 6-inch substrates dropped from approximatelyRMB 6,000 per waferat the end of 2023 to aroundRMB 1,500 per waferrepresenting a decline of approximately75%. This reflects the typical downcycle pattern of 'rising shipments, declining revenue, and eroding profits,' caused by rapid capacity expansion in 2024–2025 following heavy capital investment in 2022–2023, while downstream demand growth fell short of expectations.
📈 A clear recovery is expected in 2026: 6-inch substrates rebound fromRMB 1,500 per waferto approximatelyRMB 4,900 per piece, an increase of more than110%; 8-inch substrates are also gradually stabilizing after declines.
Key assessment: This recovery does not involve uniform price hikes across the entire market; instead, the pricing structure has significantly diverged:
🔶 Consumer/industrial-grade substrates remain at low prices,with continued intense competition
🔶 Demand for high-end automotive-grade products remains robust,prices remain elevated
🔶 Capacity utilization rates at leading substrate manufacturersover 90%,delivery lead times for chip/module companies have lengthened
robust order books at equipment suppliers indicate this recovery cycle is not merely driven by inventory restocking, but by genuine supply-demand tightness for high-specification products.
the essence of the current price rebound is not that the industry has suddenly shifted from oversupply to shortage, but rathera rapidly widening divergence in supply-demand dynamics between low-end and high-end wafers, as well as between high-spec automotive-grade and general-purpose components.thus, over the next 2–3 quarters, the industry will continue to exhibit“structural tightness, structural price increases, and structural profit improvement”characteristics.
6-inch vs. 8-inch spread: China’s 800V electric vehicle market is expected to surge in 2026, causing a temporary structural shortage of high-quality 6-inch substrates for automotive applications; meanwhile $INFINEON TECHNOLOG (IFNNY.US)$ (Kulim, Malaysia plant), $ON Semiconductor (ON.US)$ The 8-inch yield at the Bucheon, South Korea plant will achieve scaled breakthroughs in the first half of 2026, with wafer splitting dividends driving a sharp decline in per-wafer 8-inch costs.
Price outlook for the second half of this year:
🔵6-inch automotive-grade: trading sideways at high levelsRMB 4,500–5,000 per wafer, shortages persist during peak installation periods
🔵6-inch consumer-grade: continuing to slog through1,500 yuana muddy quagmire of cutthroat competition
🔵8-inch: prices to fall further toRMB 3,500–3,800 per wafer, leading IDMs are deliberately widening the price gap to force the supply chain to migrate to 8-inch wafers
🔵2027: Automotive-grade 6-inch prices will decline rapidly, with full replacement by 8-inch wafers

Price trend of 6-inch/8-inch silicon carbide substrates
IV. Demand Upgrading and Iteration
According to Yole Group data, the global silicon carbide power device market size in 2024$2.6 billion, is expected to reach13.6 billion US dollars, representing a CAGR of40%。
Pricing power for SiC demand is shifting from the automotive sector alone toward multiple applications. Expected demand structure by 2030:
🟢AI-related: accounts for [X]% of total 6-inch demand41%
🟢New energy vehicles: accounts for26%
🟢 AR glasses: position held23%
Automotive remains the core revenue base at this stage, with domestic shipments of new energy vehicles equipped with silicon carbide reaching2.5 million units, and有望突破 in 20264 million units by 2026, with a year-over-year increase of60%with silicon carbide penetrationratiorising from approximately15%in 2025 to around20%。
in 2026. AI is the key variable lifting the long-term ceiling.Even though automotive-grade adoption remains the main driver, major future incremental opportunities may come fromhigh-power AI servers, HVDC power supplies, solid-state transformers, advanced packaging interposers, and next-generation consumer electronics。
🔵 Delivery lead times for silicon carbide MOSFETs dedicated to AI servers have extended to52-week
🔵 At the same specifications, high-end AI silicon carbide MOSFETs cost at leasttwo times(AI customers have urgent and massive order demands, while qualified production capacity remains insufficient in the short term)
🔵 Industry estimates: In a 1-megawatt high-voltage DC data center power system, the value of silicon carbide components can reachUSD 5,000–6,000
🔵 Global newly added AI data center power installation capacity is projected to reach80 gigawatts, and if the penetration rate of high-voltage DC reaches100%, the corresponding incremental market size for silicon carbide components would beUSD 400 million to 480 million

Global silicon carbide power device market size forecast

Expected global 6-inch substrate demand structure by 2030
V. Company Highlights
🥇 Upstream Substrates and Equipment
1. $SICC (02631.HK)$ Global leader in silicon carbide substrates. Affected by price competition, its attributable net profit in 2025-208 million yuan, with a full-year gross margin of13.05%。but overseas revenue reachedRMB 677 million, and overseas gross margin as high as35.97%, significantly higher than domestic salesIndicating its high-value-added products command extremely strong pricing power in international markets.
💡 Key highlights:
· Global market share of conductive SiC substrates27.6%, surpassing $Wolfspeed (WOLF.US)$ to become the global leader
· 8-inch conductive substrate market share51.3%, also ranking first globally with a significant lead
· One of the few companies globally capable of mass-producing 8-inch SiC substrates, and the first to launch 12-inch SiC substrates
· Gross margin rebounded to in Q1 202619.12%, up sequentially25%, net profit margin improvement43%, clear signals of bottom recovery
The industry is currently shifting from a 6-inch price war to volume ramp-up in 8-inch production, $SICC (02631.HK)$ is not only a participant but also a key beneficiary.As the market leader in silicon carbide substrates, it will substantially benefit in the long term from expanding demand across multiple applications.
Note that the full-year 2026 price trend for 8-inch substrates remains downward, which will continue to pressure profit margins.

Tianyue Advanced Materials' capacity expansion and production volume trend

Comparison of substrate companies
2. $Veeco Instruments (VECO.US)$ A leader in the precision instruments segment, Small market cap, high elasticity. Core processes focus on epitaxy, ion beam, laser annealing, and back-end packaging lithography. VECO's epitaxy equipment directly benefits from $INFINEON TECHNOLOG (IFNNY.US)$ 、 $STMicroelectronics (STM.US)$ capital expenditures by global power semiconductor leaders such as on their 8-inch capacity expansions.
💡 Key highlights:
· LSA (Laser Spike Annealing) technology meets the low thermal budget requirements of advanced logic and DRAM/HBM processes and has already received PTOR (Process Tool of Record) certification from the three Tier-1 giants: Taiwan Semiconductor, Intel, and Samsung. Inclusion in leading customers’ roadmaps does not immediately translate into substantial revenue, but rather signifies thatonce evaluation transitions to mass production, the revenue ramp will be significantly steeper.
· Near-term fundamentals bottoming out and rebounding:Q1 revenue was $158 million, slightly down year-over-year due to cyclical weakness in traditional memory/LED markets.;Q2 revenue guidance is$170–190 million,a significant sequential increase.7%-20%, non-GAAP EPS is expected to rebound from $0.14 in Q1 to$0.20-$0.32, maintaining full-year 2026 revenue$740–800 millionstrong guidance
Management emphasized that visibility into 2027 performance is already very high, given the acceleration of orders in the second half of the year.
· Key characteristics:Faster growth, higher ASP, higher customer switching costs, and greater elasticity from rising penetration rates.

VECO's business segment revenue breakdown and technology upgrade timeline
3. $Tokyo Electron (8035.JP)$ A global leader in front-end semiconductor equipment platforms, covering nearly all major equipment categories including etch, coat/develop (near-monopoly), thermal processing, cleaning, and deposition.
💡 Key highlights:
· Q1 2026 quarterly revenue surged sequentially28.9%, with operating profit margin significantly recovering from21%to28.9%
· Fiscal year 2027 sales growth target is nearly40%, no longer primarily reliant on mature-node production in China or front-loaded orders, with confidence stemming fromhigher ASP, greater technological barriers, and stronger sustainability of advanced processes.
· Advanced packaging revenue (including HBM wafer bonding) reached approximatelyJPY 200 billionin fiscal year 2026, with expectations for growth next year60%The above
· DRAM is the fastest-growing segment in wafer fabrication equipment,Tokyo Electron holds the leading market share in the industry
· Price adjustments have been initiated across all equipment categories, and the pricing benefits will be reflected in gross margins in the second half of fiscal year 2027
· High-energy plasma etchers dedicated to SiC trench devices are essential for manufacturing high-performance SiC trench chipsan absolute technological barrier

Tokyo Electron's global regional sales structure changes (FY2025–FY2026 forecast)
$Tokyo Electron (8035.JP)$versus$Veeco Instruments (VECO.US)$ : Tokyo Electron is a "high-certainty growth core asset," with strengths inlarge revenue scale, broad product coverage, and deep leadership market share; Veeco is a high-volatility, high-beta play driven by "technological breakthroughs and order realization"High景气度 in niche segments, with advanced packaging and high-end annealing businesses exhibiting greater marginal elasticity。

🥈 Midstream epitaxy
$EPIWORLD (02726.HK)$ Global leader in the silicon carbide epitaxy market, serving 8 of the world's top 10 power device manufacturers, with products from at least 3 customers successfully entering NVIDIA's megawatt-scale AI data center supply chain. Global market share exceeds30%, indicating structural leadership.
💡 Key highlights:
· First domestic company to achieve mass production of 8-inch SiC epitaxial wafers
· World’s first company to achieve a technological breakthrough in 12-inch silicon carbide epitaxial wafers
· 8-inch capacity expanded from 40,000 wafers per year to463,000wafers by 2029, with partnerships with 18 companies on 8-inch technology
· Full-year revenue for 2025RMB 765 million, with an adjusted net profit ofRMB 198 million; healthy cash flow, with net cash flow from operating activities ofRMB 123 million
Gross margin declined from 44.7% in 2022 to24.8%, currently ata price-to-sales ratio of 50xor so,already partially priced in expectations of a 2026 recovery; fundamentals need to take over。
⭐ However, the company is expanding its 8-inch wafer capacity from 40,000 wafers per year to463,000 wafersits roadmap, partnerships with 18 eight-inch foundries, and significantly stronger earnings resilience compared to peers,it still offers solid upside elasticity under industry beta, presenting tactical opportunities.

Hai Tian Tian Cheng's epitaxial wafer sales mix and capacity utilization rate

Peer Company Comparison
🥉 Downstream manufacturers
1. $INFINEON TECHNOLOG (IFNNY.US)$ The only company globally mastering core technologies for silicon, silicon carbide, and gallium nitride power semiconductors, enabling it to provide customers with a one-stop power semiconductor solution.
· Automotive semiconductors: revenue share in 202550%, global market share in automotive power semiconductors13%, ranked No. 1 globally for six consecutive years; automotive-grade MCU market share to rise to in 202536%。It is a preferred supplier for domestic high-end customers in high-reliability segments such as MCUs, MOSFETs, and automotive sensors, where technological and functional safety barriers are substantial.Improved product pricing, combined with asset optimization in the automotive high-voltage power semiconductor business, is expected to drive the automotive segment's gross margin higher by several hundred basis points in fiscal year 2027.
· Power systems business: revenue accounts for30%, with revenue ofEUR 700 million in 2025, and targets ofEUR 1.5 billion / EUR 2.5 billion for fiscal years 2026/2027, respectively.
💡 Key highlights:
· A leading supplier of power semiconductors for AI data centers, whose growth is constrained only by insufficient capacity, as actual market demand significantly exceeds expectations.
· Higher processor power consumption drives a corresponding increase in the bill-of-materials (BOM) value for power delivery; should the power architecture shift from lateral to vertical, the per-kilowatt product value would jump substantially, targeting$100–250 per kilowatt
· AI CPU power delivery represents an entirely new growth segment; the fiscal year 2027 guidance of €2.5 billion does not yet include CPU-related business.
· One round of price increases has already been implemented, and further hikes may occur if conditions permit.
Beyond traditional GPU and ASIC power delivery demand, the AI CPU power delivery market has emerged as a completely new growth area, where the company holds a distinct competitive advantage.The number of power delivery chips required for CPUs scales proportionally with core count, and industry-wide CPU core counts continue to rise.
The fiscal year 2027 guidance of €2.5 billion does not include CPU-related business. Therefore,As inference-focused and agent-type AI applications drive increased CPU demand, Infineon is highly likely to raise its revenue outlook for the AI power delivery segment going forward.

Infineon's Automotive MCU and Power Semiconductor Global Market Share
2. $ON Semiconductor (ON.US)$ A silicon carbide IDM manufacturer with full in-house capabilities spanning substrates, epitaxy, device design, and packaging. In 2024–2025, it faced headwinds from automotive inventory drawdowns and underutilized capacity, causing gross margins to decline from 45% to around 38%—a 'bottoming-out' that has now been confirmed through margin recovery.
💡 Key highlights:
· Full-year 2025 free cash flow1.4 billion US dollars, a record high
· Q1 2026 revenue$1.513 billion, GAAP gross margin38.5%, continuing to improve sequentially; operating margin19.1%, higher year-over-year than18.3%
· Capacity utilization increased to77%, management considers low-90% utilization as "fully utilized," implying significant remaining operating leverage going forward
· AI data center business Q1 2026 sequential growthOver 30%, more than doubling year-over-year; targeting $1.2 billion by 2029, implying a CAGR of40%,
· Full-year 2026 capital expendituresonly $150–200 million, awaiting utilization rate recovery rather than aggressively expanding capacity
💡 ON Semiconductor excels in elasticity but exhibits high volatility, making it suitable for aggressive allocations.

VI. Summary and Investment Recommendations
Although the silicon carbide segment does not hold a central role in the AI-driven market rally akin to memory chips, it still presents periodic opportunities.
📊 Allocation priority:
· Highest certainty: $INFINEON TECHNOLOG (IFNNY.US)$ — Among downstream power semiconductor leaders across the entire industrial chain, this one has the strongest medium- to long-term certainty
· Clear catalysts: $SICC (02631.HK)$ — Benefiting from industry-wide substrate demand, second-half capacity supply is a key catalyst; currently, capacity availability is an even more critical driver, despite intense industry competition
· Highest elasticity: $ON Semiconductor (ON.US)$ — A highly elastic play within the silicon carbide (SiC) sector’s beta
· Equipment segment: $Tokyo Electron (8035.JP)$ (industry leader, high certainty) / $Veeco Instruments (VECO.US)$ (better elasticity)
⚠️ Valuation note: Current valuations across the silicon carbide supply chain are at historical highs, especially for overseas leaders. We recommend waiting for a short-term pullback to identify better entry opportunities.

Valuation Comparison
[Investment Advisory Information]
Tim Yang | SFC Central Reference Number: BUR210
Disclaimer
This report has been prepared by Futu Securities International (Hong Kong) Limited ("Futu Securities"). Without the prior written consent of Futu Securities, this report and the information contained herein may not be (i) reproduced, copied, or stored in any form, or (ii) distributed or transmitted directly or indirectly to any other person for any purpose. The information in this report is derived from sources that Futu Securities believes to be accurate and reliable as of the date of publication; however, this report is not intended to contain all information necessary for investor decision-making and may be affected by factors such as delivery delays, obstructions, or interceptions. Futu Securities makes no express or implied representation or warranty regarding the adequacy, accuracy, completeness, reliability, or fairness of any such information or opinions. Accordingly, neither Futu Securities nor its affiliates (collectively, the "Futu Group") shall bear any liability for any losses of any kind (including, but not limited to, direct, indirect, or consequential losses) arising from actions taken by any third party in reliance on the content of this report. The views, recommendations, suggestions, and opinions expressed in this report do not necessarily reflect the positions of Futu Securities or its affiliates and are subject to change without notice. Futu Securities undertakes no obligation to update any such information or opinions. This report is provided for general informational purposes only and is intended solely for general reading by clients of Futu Securities, without regard to the specific investment objectives, financial situation, or particular needs of any individual recipient. Nothing in this report constitutes or should be construed as an offer, recommendation, or solicitation by any member of the Futu Group to buy or sell any securities. Any investment or other financial instrument mentioned herein should not be interpreted as an offer or invitation to purchase or sell securities. Any decision to purchase securities referenced in this research report should take into account publicly available information, including any applicable prospectuses relating to such securities. The products mentioned in this report may not be suitable for all investors, and readers should fully consider relevant factors and seek professional advice before making any investment decisions. This report is provided to a recipient on the basis that such recipient is deemed capable of independently evaluating investment risks and exercising independent judgment in making investment decisions. In certain jurisdictions or countries, the distribution, issuance, or use of this report may violate local laws, regulations, rules, or other registration or licensing requirements. This report is not intended for distribution to, or use by, any person or entity in such jurisdictions or countries. Hong Kong investors with any questions regarding Futu Securities’ research reports should contact Futu Securities directly. The Central Entity Number of the Hong Kong Securities and Futures Commission license held by the author of this report is disclosed next to the author’s name on the first page of the report. The analyst primarily responsible for preparing this report confirms that: (i) the opinions expressed herein accurately reflect his/her personal views regarding the listed corporation(s) covered in this research report; and (ii) none of the compensation he/she has received, is receiving, or will receive—directly or indirectly—is linked to the specific recommendations or views expressed in this report. The analyst further confirms that neither he/she nor any associate has traded in the securities of the listed corporation(s) covered in this report during the 30 days prior to its publication or within three business days following its publication. Neither the analyst nor any associate serves as a senior officer of the listed corporation(s) covered in this report or holds any financial interest therein. In this report, Futu Securities does not hold any financial interest amounting to 1% or more of the market capitalization of the listed company and has had no investment banking relationship with the company in the past 12 months. None of our employees are employed by the listed company.
Risk Disclaimer: The above content only represents the author's view. It does not represent any position or investment advice of Futu. Futu makes no representation or warranty.Read more

Comment (1)
to post a comment
8
8