
⚽ The World Cup reaches its peak showdown! How to position for the event-driven economy?

Event Play | World Cup Economics: When 'Selling at Higher Prices' Matters More Than 'Selling More'
I. The Economic Scale of the Largest Single-Sport Event in History
The 2026 FIFA World Cup marks the first return to North America since 1994. The tournament will be unprecedented in scale: 48 participating teams, 104 matches across 16 cities in three countries, with 78 matches held in 11 U.S. cities.
🎟️ Strong demand signal: FIFA reported over 500 million ticket applications competing for 7 million seats—equivalent to 70 people vying for one seat.
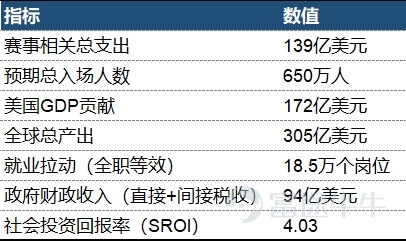
Key findings from FIFA’s Socioeconomic Impact Analysis Report (released March 2025, using OECD-aligned methodology):

FIFA Socioeconomic Impact Key Data
🔍 Other perspectives:Goldman Sachs analyzed GDP data from all World Cups since 1982 and found that the economic boost for host countries is statistically insignificant, with long-term effects close to zero.Core argument: Standard forward-looking economic models fail to adequately account for consumption substitution effects and economic leakage.
💡 Our view:The macroeconomic GDP contribution may be overstated, but the concentrated catalytic effect on specific sectors is real.
II. Which sectors truly benefit?
In June, according to JPMorgan estimates, the value-added contributions by U.S. industries due to the World Cup were as follows:
▪️ Accommodation & Food Services:USD 2.4 billion(largest value-added contribution)
▪️ Real Estate:2 billionThe US Dollar
▪️ Wholesale & Retail: Approximately1.5 billionThe US Dollar
JPMorgan believes thatThe greatest opportunity to capture excess returns lies in: secondary ticketing, online travel and accommodation, digital advertising, ride-hailing and food delivery, media, airports, car rentals, restaurants, and consumer goods.
📈 Historical performance of host-country equity markets: median return in the tournament year of approximately+10%(relative to MSCI ACWI), but with significant dispersion: Qatar in 2022+10%, Russia in 2018+5.4%, Brazil in 2014-19.5%。The tourism absorption ecosystem in the U.S., Canada, and Mexico is far superior to that of previous host countries.
⚖️ Market mispricing: High event expectations contrast sharply with extremely low market expectations for related beneficiaries—macro uncertainty, geopolitical risks, and weak consumer sentiment have made investors broadly cautious about 'World Cup-themed' plays.Once the catalyst materializes, upside potential could exceed expectations.
💡 Our view:With U.S. large-cap stocks heavily concentrated in the semiconductor hardware sector, domestic consumer stocks still offer opportunities to benefit from sector rotation or inflation-related narratives.; for relevant stocks, refer to Futu’s World Cup-themed stock list (List24230):
3. Focus on the beer sector: BUD and ABEV
$Anheuser-Busch Inbev (BUD.US)$ is an official FIFA World Cup sponsor, $Ambev SA (ABEV.US)$ is its Brazilian subsidiary.The two represent the 'global premiumization' story and the 'Brazilian regional growth' story, respectively, and belong to the same industry chain. Both stocks have risen by approximately 30% year-to-date.
🔵 BUD (Anheuser-Busch Inbev ADR)
[Q1 2026 Highlights]
▪️ Maintained or increased market share in 75% of markets (including the U.S., Mexico, and Brazil)
▪️ Megabrands revenue+8.2%, non-alcoholic beer+27%, Beyond Beer +37%
▪️ Premium + Beyond Beer categories now contribute to the group>40%revenue
▪️ Emerging markets contribution to the group~70%EBITDA
▪️ Brand portfolio shifted from~400brands to 50 megabrands
🏆 World Cup impact: Management guided that the World Cup would contribute approximately30 bpsof additional volume growth for the full year. Historically, the World Cup has contributed20–30 bps.。This year, with the U.S. as host nation, favorable time zones, and stronger local activation efforts, the expected impact will exceed previous tournaments.The effect will be primarily reflected in Q2 (front-loaded shipments) and Q3. There is no World Cup impact in Q1.
💡 Our view: $Anheuser-Busch Inbev (BUD.US)$ is transitioning from a 'synergy amplification' story to a 'higher-quality revenue growth' story:(1) 4–8% organic EBITDA growth; (2) premiumization and efficiency gains offer ~500 bps of margin expansion potential; (3) strong FCF supports over $6 billion in buybacks.

BUD Key Financial Metrics
🟢 ABEV (Ambev ADR)
[Q1 2026 Highlights]
▪️ Market share gainsOver 100 bps(Largest quarterly share gain in five years)
▪️ Premium brands (Original, Stella Artois, Corona) performed strongly, while 'better-for-you' categories (Michelob Ultra, Stella Pure Gold) saw exponential growth and now account for a significant portion of the beer portfolio in Brazil~4%
▪️ Core brand (Skol) stabilized, ending continuous market share losses into 2025
▪️ Record Q1 volumes in Brazil, supported by strong commercial execution

ABEV Key Financial Metrics
🏆 World Cup Impact: $Ambev SA (ABEV.US)$ Management explicitly stated that they observed no World Cup effect in Q1—This means Q1's beat was driven purely by fundamentals.The actual World Cup benefit will start to materialize from Q2 onward.Key point: Q2/Q3 2025 were the quarters with the steepest volume declines (weather-driven), resulting in an extremely low base.Historically, the World Cup has contributedan additional 0.3–0.4 percentage pointsto annual volume growth for Brazil’s beer industry.
💡 Our view:Although the earnings inflection point is visible and FCF yield is attractive, it is still too early to confirm structural shifts in market share dynamics; the company trades at a modest premium.
IV. Core question: Why are volumes falling, prices rising, and the stock price still hitting new highs?
This is the most significant narrative shift currently unfolding in the global beer sector.
📉 Western Europe retail data: Anheuser-Busch InBev volume-7.5%, sales-6.6% — underperforming the industry (industry volume down 4.7%)
📉 Brazil: April year-over-year industrial production of alcoholic beverages-3.1%
📉 North America: FY26E volume still in negative territory (-1%, the only region with negative growth)
But why is Anheuser-Busch InBev's $Anheuser-Busch Inbev (BUD.US)$ , $Ambev SA (ABEV.US)$ share price continuing to hit new highs?The market is pricing in successful premiumization, using Anheuser-Busch InBev as an example:
1. The Price/Mix engine fully offsets the decline in volume.
Anheuser-Busch InBev's Q1 Price/Mix reached+4.5%(of which+3-3.5%driven by inflation-matching pricing, with the remainder coming from structural mix improvement). When premium/Beyond Beer categories grow faster than core brands,3–5 timesrevenue and profit growth trajectories remain upward, even if total volumes are flat or slightly down.
2. Portfolio streamlining puts margins on a structurally upward path.
Anheuser-Busch InBev expects mid-term~500 bpsof margin expansion potential (from its current~36%EBITDA margin toward40%+).
Drivers:Brand rationalization (400 brands → 50 megabrands) → improved supply chain efficiency → execution at scale。
3. Stronger capital returns
Net leverage has declined below3.0xfor the first time since 2015. Management committed to at least$6 billionin share buybacks. For a stock with an FCF yield of 8.5%, this implies approximately3%% annual EPS accretion from buybacks, on top of low-teens organic profit growth.
4. Long-term demand decline is already fully priced in
Market expectations for long-term volume growth in the beer industry have already become very conservative. Anheuser-Busch InBev16.5x 2027E P/EThis valuation implies that investors do not expect volume to recover. However, as Price/Mix continues to outperform expectations, the market is gradually realizing that EPS can grow even without higher volumes.
We believe:This perception gap is a key driver behind the stock's continued upward movement.。
5. The World Cup acts as a catalyst against a low base, not a long-term fundamental driver.
The World Cup contributes30 bpsof volume growth, which is negligible in absolute terms.
Its function is:It provides a clear, short-term positive data point at a time when investor sentiment on consumption trends is pessimistic.This helps maintain sentiment and valuation levels, buying time for the premiumization thesis over the medium to long term.
5. Risk Warnings
▪️ Emerging market currency depreciation (particularly in Latin America) eroded USD-denominated profits
▪️ Re-inflation in raw materials (aluminum prices up 12.2% YTD)
▪️ Premiumization growth slowing or consumer downtrading
▪️ US beer volumes accelerating their decline (currently -1%; further deterioration could impact sentiment)
▪️ GLP-1 drug penetration exceeding expectations, structurally compressing long-term demand
[Investment Advisory Information]
Jason Huang | SFC Central Reference Number: BRO307
Disclaimer
This report is prepared by Futu Securities International (Hong Kong) Limited (“Futu Securities”). Without Futu Securities’ prior written consent, this report and the information contained herein may not be (i) reproduced, copied, or stored in any form, or (ii) distributed or transmitted, directly or indirectly, to any other person for any purpose. The information in this report is derived from sources that Futu Securities believes to be accurate and reliable as of the date of publication. However, this report is not intended to contain all information that may be required by investors and may be subject to delays, obstructions, or interceptions in delivery. Futu Securities makes no express or implied representation or warranty as to the adequacy, accuracy, completeness, reliability, or fairness of such information or opinions. Accordingly, neither Futu Securities nor its affiliates (collectively, the “Futu Group”) shall be liable for any losses of any kind (including, but not limited to, direct, indirect, or consequential losses) arising from any actions taken by third parties relying on the contents of this report. The views, recommendations, suggestions, and opinions expressed in this report do not necessarily reflect the positions of Futu Securities or its affiliates and are subject to change without notice. Futu Securities has no obligation to update any such information or opinions. This report is provided for general informational purposes only and is intended solely for the general reading of Futu Securities’ clients, without regard to the specific investment objectives, financial situation, or particular needs of any individual recipient. Nothing in this report constitutes or should be construed as an offer, recommendation, or solicitation by any member of the Futu Group to buy or sell any securities. Any investment or other financial product mentioned herein should not be interpreted as an offer or invitation to purchase or sell securities. Any decision to purchase securities referenced in this research report should take into account publicly available information, including any applicable prospectuses relating to such securities. The products mentioned in this report may not be suitable for all investors. Readers should fully consider relevant factors and seek professional advice before making any investment decisions. This report is provided to recipients on the assumption that they are capable of independently evaluating investment risks and exercising independent judgment in making investment decisions. In certain jurisdictions or countries, the distribution, issuance, or use of this report may violate local laws, regulations, rules, or other registration or licensing requirements. This report is not intended for distribution to, or use by, any person or entity in such jurisdictions or countries. Hong Kong-based investors with questions regarding Futu Securities’ research reports should contact Futu Securities directly. The SFC license central reference number of the report’s author is disclosed next to the author’s name on the cover page of the report. The analyst primarily responsible for preparing this report confirms that: (i) the opinions expressed accurately reflect his/her personal views regarding the listed corporation(s) covered in this report; and (ii) none of the compensation he/she has received, is receiving, or will receive—directly or indirectly—is linked to the specific recommendations or views expressed in this report. The analyst further confirms that neither he/she nor any related party has traded in the securities of the listed corporation(s) covered in this report during the 30 days prior to, or within three business days following, the publication of this report. Neither the analyst nor any related party serves as a senior officer of the listed corporation(s) covered in this report or holds any financial interest therein. In this report, Futu Securities does not hold any financial interest amounting to 1% or more of the market capitalization of the listed company and has had no investment banking relationship with the company in the past 12 months. None of the employees of this company are employees of the listed company.
Risk Disclaimer: The above content only represents the author's view. It does not represent any position or investment advice of Futu. Futu makes no representation or warranty.Read more


Comment (1)
to post a comment
2