
Loss-driven selling has improved, with Bitcoin finding buying support around the $60,000 level, leading to a 5.88% weekly rebound | Bitcoin | Research Report | Cryptocurrency Market Analysis | Late-Mid Stage of Bear Market
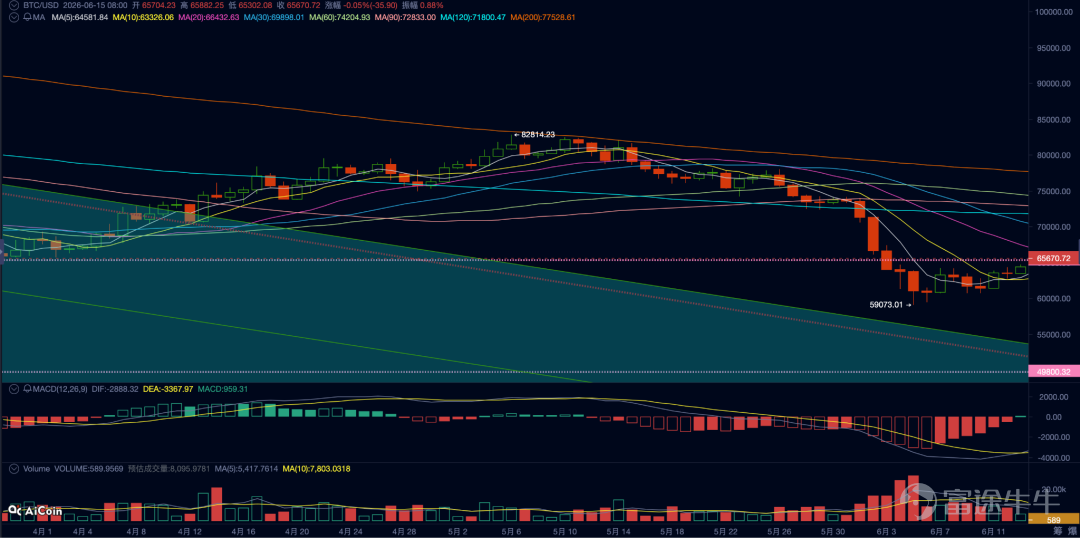
During the reporting period (June 7–June 13), $Bitcoin (BTC.CC)$ It showed an oversold bounce pattern, opening at $60,850.48 and closing at $64,429.99, up 5.88%, with trading volume significantly contracting. The rebound momentum stemmed partly from accumulation after the sharp decline and partly from easing selling pressure driven by renewed optimism around a resolution to the Strait of Hormuz crisis.

Previously, macro-financial conditions faced headwinds due to a broad-based rebound in U.S. May inflation data, fueling expectations of structural monetary tightening. However, this week’s CPI and core CPI readings came in line with expectations, calming market nerves for now. Short-term Fed liquidity rose by 0.68%, and the U.S. Dollar Index declined by 0.32%, offering partial support to markets. On Friday, news that the U.S. and Iran were set to sign an agreement led to positive inflows into BTC ETFs; however, significant contraction in external funding channels meant this week’s price rebound lacked solid external capital inflow support.
The crypto market remains in the clearing phase of a cyclical bear market, but buying interest emerged near the $60,000 level, triggering a modest rebound following the sharp selloff.
Macro-Financial
In the global macro environment, financial markets are exhibiting a deep divergence between short-term hard data improvements and deteriorating medium-to-long-term inflation expectations.
Short-term liquidity and monetary policy show signs of marginal ease. Fed net liquidity increased notably by 0.68% compared to last week, providing necessary short-term funding support for risk assets. Meanwhile, stress in the short-term funding market eased slightly, with SOFR falling to 3.60%, down 0.03% for the week, reflecting a relatively benign interbank short-term liquidity environment.
At the interest rate and valuation pricing level, U.S. Treasury yields and the U.S. Dollar Index traded in a narrow range with a slightly softer bias. The 2-year U.S. Treasury yield closed the week at 3.62%, unchanged week-over-week (+0bp), indicating high market uncertainty over the near-term interest rate path. The 10-year Treasury yield dipped slightly by 5bp to close at 4.49%, suggesting long-end bond investors remain cautious about the sustainability of elevated inflation. In FX markets, the U.S. Dollar Index (DXY) fell 0.32% to 99.75, with dollar weakness partially alleviating valuation pressure on global risk assets. Boosted by this, all three major U.S. equity indices posted modest weekly gains: the S&P 500 closed at 7,431.46, up 0.65%; the Nasdaq closed at 25,888.84, up 0.70%; and the Dow Jones Industrial Average closed at 51,202.26, up 0.66%. Although short-term risk appetite improved modestly on geopolitical optimism from breakthrough progress in U.S.-Iran diplomatic relations, underlying macro data triggered fresh inflation alarms.
Data released by the U.S. Bureau of Labor Statistics on June 10, 2026, showed that May CPI rose 4.20% year-over-year—significantly above the prior reading of 3.80% and marking the highest level since April 2023. Core CPI also climbed to 2.90% YoY (from 2.80% previously). Subsequently, on June 11, May PPI surged to 6.50% YoY (up from 5.70%), the fastest pace since late 2022. These hard inflation figures indicate that geopolitical tensions in the Middle East and energy shocks are driving a sharp transmission of imported and wholesale inflation to the consumer level. The unemployment rate edged down slightly to 4.30% (from 4.40%), showing some labor market resilience, which paradoxically reinforces policymakers’ resolve to combat inflation.
Overall, at the macro-financial level, we characterize the current environment as one of temporary recovery in the U.S. Dollar Index and risk appetite, driven by short-term geopolitical tailwinds and inflation data in line with expectations, all unfolding against a backdrop of medium-to-long-term macro headwinds.
Crypto Market
Bitcoin experienced a dual divergence this week: a price rebound from its lows alongside accelerated outflows from external channel liquidity. Price-wise, BTC bounced back after hitting a low of $60,861, gaining 5.88% with a weekly price range of 6.61%. Despite the recovery, spot market trading activity remained subdued, with the 7-day average spot trading volume declining sharply by 30.67% compared to the previous week. Moreover, the current price remains below the 30-day, 90-day, and 200-day moving averages, indicating that the medium- to long-term moving average system continues to exert clear downward pressure.
On the margin funding flow front, the market faced evident capital outflow pressure. This week, Bitcoin ETFs recorded total outflows of $317 million (including a single-day record net outflow of $213 million on June 10). Simultaneously, the total stablecoin supply contracted by $1.25 billion. This indicates that during the price rebound phase, incremental liquidity from external fiat and channel sources was severely insufficient, and macro tightening expectations have already triggered tangible capital retreat at the margin level.
However, exchange and on-chain holdings exhibited strong signs of spot accumulation and settlement. This week, exchange-held BTC balances decreased by 13,361 BTC. This figure closely aligns with the dynamics showing long-term holder supply increasing by 40,547 BTC while short-term holder supply declined by 24,647 BTC—reflecting a notable concentration of coins shifting from short-term speculators into long-term investor accounts, forming defensive support at lower price levels.
In the derivatives market, leverage has accumulated moderately, and long-short positioning has grown more complex. Open interest rose by 5.01% this week to $56.08 billion, while funding rates dropped to zero. Against the backdrop of a sharp 32.75% contraction in the 7-day average derivatives trading volume, the increase in open interest reflects localized accumulation of short positions. Total liquidations across the market reached $7.47 billion this week, including $159 million in long liquidations and $300 million in short liquidations, indicating that the price rebound exerted significantly greater squeeze pressure on short positions.
From the perspective of holders’ profitability and willingness to sell, the overall Market Value to Realized Value (MVRV) ratio rose slightly by 0.02 to 1.20 this week, placing it in a historical bottom range and highlighting strong defensive characteristics in current valuations. The MVRV ratios for long-term and short-term holders increased to 1.31 and 0.88, respectively, showing that short-term holders still face significantly higher unrealized losses than long-term holders, though their extreme selling pressure has somewhat eased. In terms of the Spent Output Profit Ratio (SOPR), both the aggregate SOPR and short-term holder SOPR held steady at 1.00, suggesting short-term holders did not exhibit panic-driven capitulation during the rebound. Meanwhile, long-term holder SOPR declined to 0.99 this week, implying some non-dominant turnover by long-term holders at minimal profit levels—the first net outflow from exchanges in several weeks.
Integrating various structural indicators, the current Bitcoin market is in a typical phase of short-cycle capitulation by short-term holders and accumulation by long-term investors, primarily driven by spot settlement with light derivatives speculation.
Market Implications
Considering both macro financial conditions and internal crypto market structure, this week’s market dynamics can be summarized as: 'macro tightening constrains channel liquidity, while on-chain spot settlement builds defensive support at lows.'
First, there is a clear divergence between macro conditions and crypto market performance. On the macro front, May’s unexpectedly high inflation reinforced structural tightening headwinds, directly tightening external funding channels into crypto markets—as evidenced by significant outflows from Bitcoin ETFs and stablecoins. Yet despite this capital withdrawal, BTC prices did not break down further; instead, they posted a 5.88% weekly rebound. The core reason for this divergence lies in dramatic adjustments in on-chain coin distribution—long-term holders (LTHs) added 40,547 BTC this week, while net outflows from exchange wallets totaled 13,328 BTC. This locking-in and accumulation by long-term capital effectively offset selling pressure from retreating fiat liquidity, providing strong absorption of coins at lower price levels.
Second, transmission from macro conditions to crypto markets appears only partially effective. Although Fed net liquidity expanded by 0.68%, this failed to translate into inflows into crypto markets, reflecting a blockage in the transmission mechanism from macro liquidity easing to crypto assets. Conversely, negative policy expectations driven by May’s inflation surge were swiftly and acutely transmitted to external crypto funding channels. This has created a classic 'tailwinds muted, headwinds amplified' dynamic: insufficient incremental external liquidity casts doubt on the sustainability of the price rebound, leaving the overall market notably fragile.
Outlook for the Market Ahead
Against the backdrop of a 'tightening' macro-financial environment and deep divergence in crypto market structures ('accumulation'), whether the current short-term market trend continues or reverses hinges on closely monitoring the fulfillment of the following key validation conditions:
1. Validation of a reversal in external marginal capital flows: We need to continuously monitor whether weekly Bitcoin ETF flows can return to net inflows and whether the total stablecoin supply can shift from contraction to expansion, thereby verifying whether the macro-driven inflationary tightening expectations are materially easing their suppression on capital flows into crypto channels.
2. Validation of spot trading activity and breakout above key moving average resistance levels: We need to observe whether the 7-day average spot trading volume can meaningfully rebound and confirm whether Bitcoin’s price can effectively break above and sustain levels beyond the 30-day moving average ($70,766), the 90-day moving average ($73,009), and the 200-day moving average ($77,691), to ensure the rally is not solely driven by a low-volume short squeeze.
3. Long-term holder capitulation and sustained exchange outflows: Around the $60,000 level, long-term holder capitulation has declined somewhat; we need to confirm whether it can decrease further. Additionally, we must verify whether Bitcoin balances on exchanges continue to decline and whether the supply held by long-term holders keeps increasing, to validate that defensive accumulation strength in this lower price zone remains robust.
The above analysis is provided by EMC Labs.
———————————————————————
About EMC Labs
EMC Labs is a partner of Victory Securities, and together they have launched the only virtual asset fund approved by the SEC to accept stablecoin subscriptions—the Victory EMC BTC Cycle Fund. EMC Labs was co-founded by seasoned virtual asset investors and data scientists, with a core team hailing from JD.com Finance, Bell Labs, Marsbit, and other companies. EMC Labs has invested substantial resources in building a professional engine to analyze Bitcoin’s on-chain data and technical indicators.
Disclaimer
Investment involves risks, and investors should take note. The value of securities and investments can go up as well as down and is not guaranteed. Investors may not get back the original investment amount, and past performance is not necessarily indicative of future results. Victory Securities’ securities trading services are provided by Victory Securities Limited (hereinafter referred to as “Victory Securities”). This document was prepared and authorized for release on this platform by Victory Securities Limited, and the information contained herein is for reference purposes only. Victory Securities Limited reserves the right to make changes or terminate at any time without prior notice. All information provided on this platform, including this document and its contents, may not be reproduced, linked, reposted, or otherwise copied for publication or commercial use by any media, website, or individual without prior written authorization from Victory Securities. Authorized users must acknowledge that the source material originates from Victory Securities when using this document and its content, and commit to complying with relevant laws and all international conventions regarding internet usage, refraining from illegal purposes or unlawful use of this document. Violators will bear all associated legal and financial responsibilities. Data or figures quoted in this document may come from third parties; Victory Securities does not guarantee the accuracy of such third-party data or materials, nor will it assume liability for the fairness, accuracy, timeliness, completeness, or correctness of any data, forecasts, and/or opinions contained herein, nor the benchmarks upon which such forecasts and/or opinions are based. Any forward-looking statements in this document do not constitute guarantees of future performance, and actual circumstances or developments may differ significantly. This document is not and should not be considered or construed as an offer, invitation, solicitation, recommendation, advice to buy or sell any investment products, or as a basis for investment decisions, nor should it be interpreted as professional advice. Readers or those making investment decisions should fully understand the risks involved and the legal, tax, and accounting characteristics and consequences, and decide whether investing aligns with personal objectives and risk tolerance. Seek appropriate professional advice if necessary. In certain countries, the distribution and circulation of this document may be restricted by law or regulation, and recipients should be aware of and comply with such restrictions.
Risk Disclaimer: The above content only represents the author's view. It does not represent any position or investment advice of Futu. Futu makes no representation or warranty.Read more
Comments
to post a comment