
SpaceX stock on a rollercoaster ride—how to position in space-related equities?
Bullish Tech Intel Briefing | SpaceX's trillion-dollar IPO sparks market frenzy! Can it propel Tesla to break decisively above the $450 mark?
Recently, news of SpaceX’s impending IPO has ignited significant market enthusiasm. Elon Musk has also discussed the potential future merger of Tesla and SpaceX. The two companies already exhibit synergy in engineering talent, computing power, and energy resources—this narrative has become one of the key drivers behind Tesla’s recent share price rebound. Also noteworthy is Tesla’s strong April sales performance in Europe, which rose 67.2% year-over-year.
In the previous trading session, $Tesla (TSLA.US)$ shares successfully closed above $440. Will the sentiment surge triggered by SpaceX’s IPO provide enough momentum for Tesla’s stock to push further and break through the $450 resistance level in the near term? In this edition of the Tech Intel Briefing, we’ll analyze this move in detail from the perspectives of candlestick patterns and multiple key technical indicators.
Tesla (TSLA)

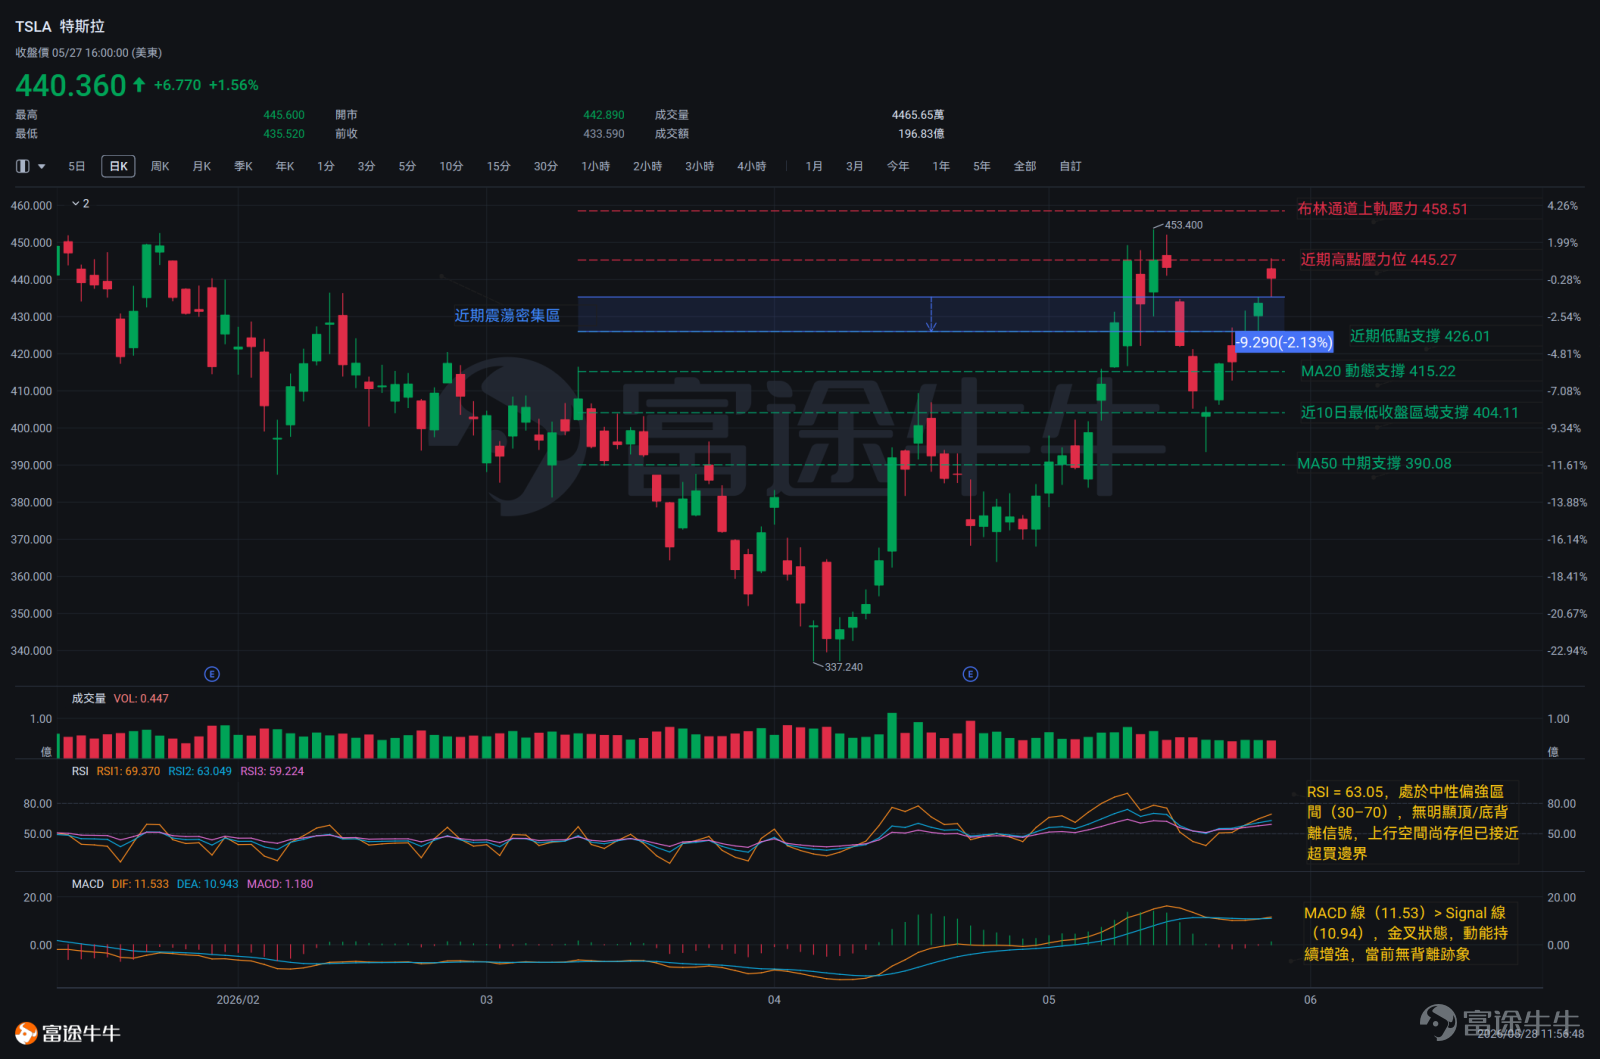
Over the past two weeks, Tesla has traced a classic consolidation-and-recovery pattern:“pressure at highs → bottoming confirmation → gradual recovery → approaching prior highs.”On May 19, Tesla’s share price dipped to around $404.11, forming a short-term low.This was followed by clear signs of buying support at the lows, with bulls quickly stepping in.—a strong bullish candle on May 20 closed at $417.26.Confirmed that the reversal has taken hold.In the following eight trading days, the stock price steadily rebounded to USD 440.36,marking a cumulative gain of over 9%.
Overall, the share price has stabilized above both the 20-day moving average (MA20) at USD 415.22 and the 50-day moving average (MA50) at USD 390.08, forming a complete bullish alignment,and the medium-term uptrend remains intact. Whether the price can effectively break through the dense resistance zone between USD 445 and USD 453 will be key to assessing the sustainability of this rebound.
Key Technical Indicators Interpretation
Moving Average (MA):Currently trading at USD 440.36, the share price sits above both moving averages, with the MA20 above the MA50, confirming a fully intact bullish alignment. The upward slope of the moving averages indicates a relatively strong medium-term trend structure. The current price is approximately 6% above the MA20, creating objective gravitational pull toward mean reversion; should the price experience a short-term pullback, close attention should be paid to whether the MA20 can provide effective dynamic support.
RSI:The current RSI reading is 63.05, which has not yet entered overbought territory (>70). There are no clear signs of bearish or bullish divergence, suggesting theoretical upside potential remains, though it is approaching the overbought threshold. If the price continues to rise without the RSI concurrently making new highs, traders should closely monitor for the emergence of a bearish divergence signal.
MACD:The MACD line (11.53) is above the Signal line (10.94), confirming a golden cross. Both lines remain above the zero axis, indicating that bullish momentum shows no signs of weakening and no divergence has emerged, with volume patterns generally supportive of further upside.
Bollinger Bands:The current share price of $440.36 lies between the middle Bollinger Band ($415.22) and the upper band ($458.51), with rising volatility aligning with the bullish trend. The upper band at $458.51 marks the upper boundary of volatility; close attention should be paid to whether the price can sustainably hold above the middle band and move toward the upper band. If it faces resistance, retreats, and breaks below the middle band, caution is warranted regarding a potential pullback.
Technical Comprehensive Analysis
After May 19, Tesla's stock price steadily recovered, with moving averages in bullish alignment, a MACD golden cross, and an expanding Bollinger Bands channel.Multiple technical indicators collectively support a bullish bias.However, the downtrend from May 13 to May 18 has left behinda dense concentration of trapped long positions in the $445–$453 range, which now forms clear structural resistance.—On May 27, another attempt to break through this zone was again met with resistance and a subsequent decline, further confirming the validity of this resistance band.
Until the price effectively breaks above the $445–$453 zone with confirmed volume support,the current price action favors range-bound consolidation rather than a directional breakout;RSI is approaching overbought territory,and the risk of bearish divergence also warrants vigilance.
Key support to watch on the downside is $426.01 (the lower boundary of the recent trading range). A break below this level would signal potential further downside toward the dynamic 20-day moving average support at $415.22. Should the 20-day MA also be breached, the next short-term support target would be the May 19 intraday low of $404.11.
On the upside, focus on whether the stock price can decisively break through the dense trading zone between $445.27 and $453.40. If it achieves a confirmed breakout accompanied by strong volume and holds above this range, attention turns to the upper Bollinger Band at $458.51 for potential extension.

We have some great news to share with everyone—NiuNiu Desktop has just launched its new 'AI-Custom Indicator' feature!
Want your own personalized technical indicator? Now, with just a single command, AI can generate it for you! What’s more, you can backtest it instantly with one click—no coding required—and clearly evaluate its performance. Give it a try today!
Risk Disclaimer: The above content only represents the author's view. It does not represent any position or investment advice of Futu. Futu makes no representation or warranty.Read more


Comments (4)
to post a comment
36
16