
Hong Kong Market Barometer: CPO, PCB, and memory stocks rally in rotation! Are you on the right trai
Tencent rebounds after hitting a low; 472 yuan becomes an important threshold for transitioning from weak to strong
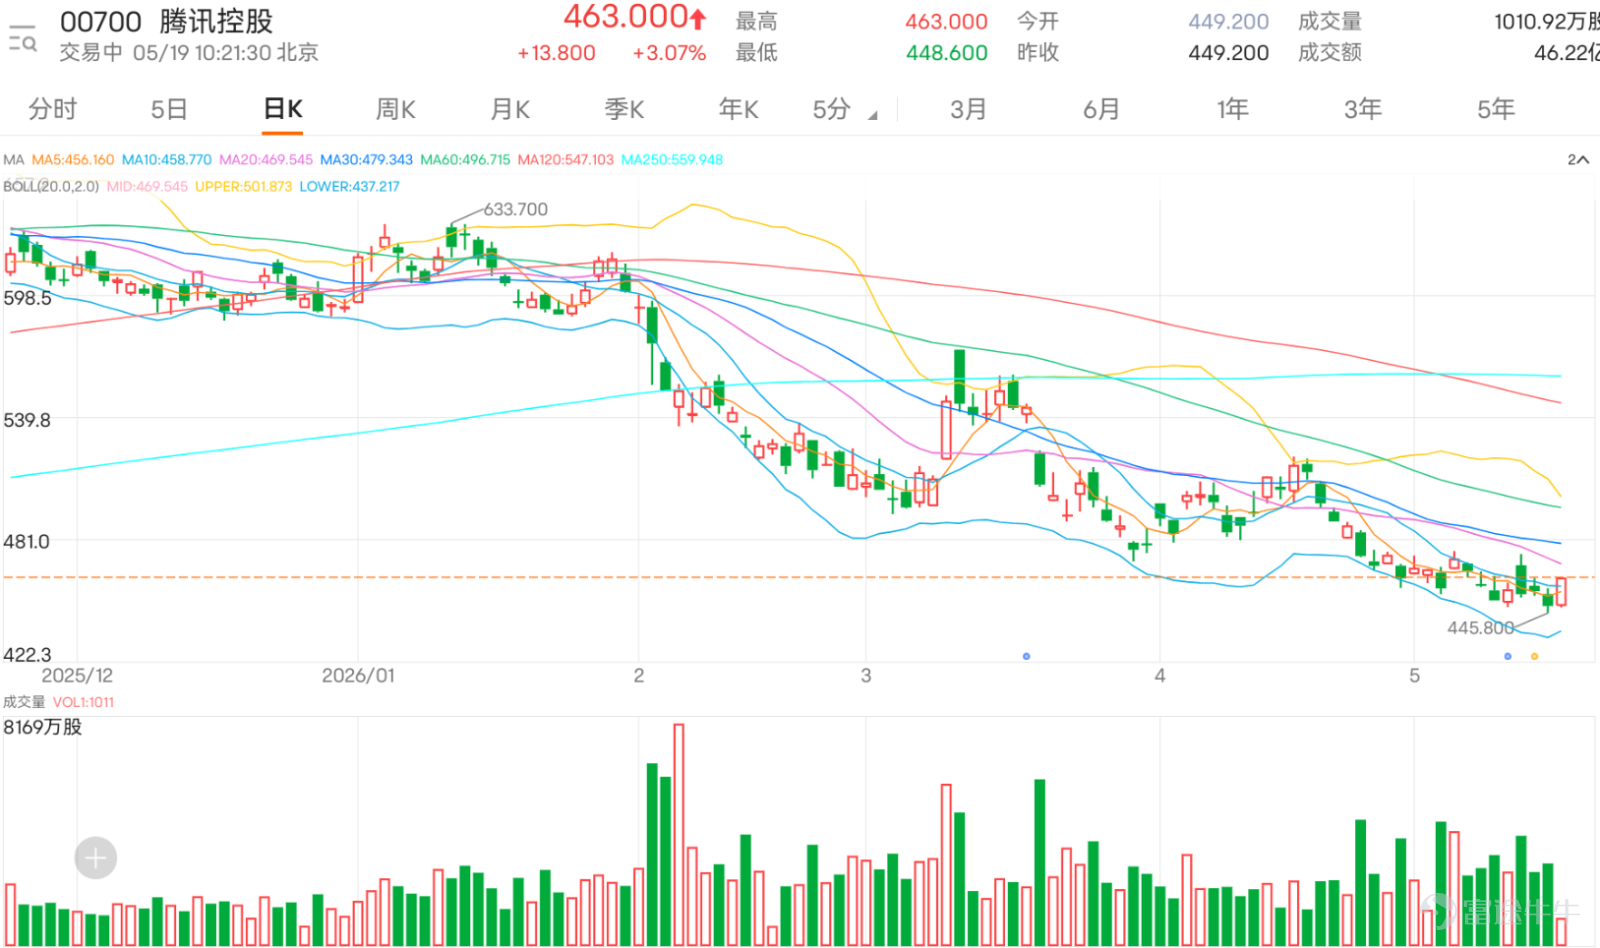
$TENCENT (00700.HK)$ After falling as low as 448.6 yuan, it gradually stabilized and is currently up over 3%, trading at 463 yuan, breaking through the 10-day moving average. However, the short-term trend remains weak, with the 20-day moving average at 472.255 yuan and the 30-day moving average at 480.287 yuan, indicating that the short-to-medium term structure has not yet recovered. The midpoint of the Bollinger Band is approximately 472.255 yuan, the upper band around 510.483 yuan, and the lower band around 434.027 yuan. The current price is below the midpoint and gradually approaching the lower band, reflecting that the market remains in a weak zone. The Relative Strength Index (RSI) is near 31, showing weak momentum, already close to the oversold region, but no clear signs of strengthening have emerged. Therefore, at this stage, one cannot simply assume that the stock has bottomed out just because the price has fallen significantly.
From the sentiment in the comments, Tencent’s biggest issue right now is not the complete lack of bullish funds but rather the erosion of confidence among shareholders due to consecutive declines. Many comments focus on the breach of the 450-yuan level, risks related to 445-yuan bull certificates, whether buybacks can support the share price, and where the next support level might be. This reflects that the market is no longer just debating whether Tencent is cheap, but has started worrying about the possibility of further downside. For retail investors, 450 yuan was originally an important psychological level, and now that it has been breached, the short-term focus naturally shifts to support at 445.800 yuan.
Bullish comments are mainly concentrated in three directions. First, some investors still hope that Tencent will reclaim 450 yuan or even return to around 457 yuan. Such comments reflect that short-term holders’ demands have lowered, no longer expecting large rebounds immediately, but hoping that the stock can first recover from its weakness after breaking below 450 yuan. Second, investors expect dividends, buybacks, and company fundamentals to support the share price. Some mentioned higher dividends per share compared to last year, while others are concerned about whether the company will start repurchasing shares and hope such efforts can stabilize the stock price. Third, some investors still regard Tencent as a high-quality stock, but they wish to accumulate positions at lower levels, such as between 450 yuan and 400 yuan, 380 yuan, or even lower.
However, there is evident unease amidst this bullish sentiment. Some asked whether they should exit after buying at HKD 450, others who bought between HKD 470 and 450 still hoped the share price wouldn't fall further, and some mentioned that continuously predicting a rebound while prices keep falling is the most terrifying scenario. These comments illustrate that confidence in Tencent hasn’t completely disappeared, but most bullish investors have shifted to a defensive mindset. Investors are not aggressively buying but instead asking when the stock will stop falling, when to repurchase, and when it will rebound. When discussions about a large blue-chip stock shift from “how high can it go” to “where is the next support,” it indicates that short-term sentiment has clearly weakened.
Bearish comments reflect more direct pressure. Several investors described Tencent as weak, breaking new lows, “boiling frog syndrome,” and accelerating declines, while others have already cut losses or exited completely. These comments show that the patience of shareholders is wearing thin, especially after the stock fell below 450 yuan, causing many to worry whether it might test even lower levels. Some mentioned buying at much lower levels like 380 yuan, 365 yuan, or 330 yuan, reflecting that a portion of the market funds are not in a rush to accumulate shares but are waiting for a deeper correction.
Technically, HKD 445.800 is currently the most critical first support level. The current price of HKD 449.200 is very close to this position, and if there’s another short-term drop, the market will quickly test the support at HKD 445.800. Comments mentioning “last warning at 445” precisely reflect that the area around HKD 445 has become both a psychological defense line and a key point for bull contracts. If HKD 445.800 holds, Tencent could see a technical rebound near oversold conditions, initially facing resistance at HKD 457.800 and then a pivotal zone near HKD 459. However, if HKD 445.800 fails, market sentiment will weaken further, and the next support will be around HKD 428.888.
On the upside, HKD 459 is the most crucial pivot point. For Tencent to preliminarily reverse its downtrend, it needs to not just regain HKD 450 but break through HKD 459 to reclaim the area around the 10-day moving average. If the price cannot surpass HKD 459, even a rebound from near HKD 445 would only be seen as a weak pullback. A more significant improvement would require the price to stabilize above HKD 472, as both the 20-day moving average and the middle Bollinger Band are near HKD 472, which is an important level for transitioning from weakness to stability. In other words, Tencent's recovery path is quite clear: first defend HKD 445.800, then retake HKD 459, and only afterward discuss improvements above HKD 472.
Observational comments best reflect retail investors’ core anxieties right now. First, why did the stock fail to rise despite increased dividends and the record date? Second, has the company started repurchasing shares, and will these buybacks truly support the stock price? Third, where is the next support level after breaking below HKD 450? Fourth, should positions bought at HKD 450 be cut for losses? Fifth, is it time to pick up bargains, or wait for even lower levels? These questions all point to one central issue: Has Tencent fallen to a level with worthwhile risk-reward potential, or is it still in a weak downward search?
In terms of volume analysis, trading volumes during recent declines have remained relatively stable without noticeable panic selling spikes. This suggests that the market hasn’t experienced extreme selloffs, but it doesn’t mean the decline has stopped either. More importantly, rebounds haven’t been accompanied by significantly increased trading volumes, reflecting weak buying interest. When a stock declines without panic but also lacks buying on rebounds, it often forms a slow-drip bearish pattern — what commenters referred to as “boiling a frog slowly.” Under these market conditions, the stock price may not plummet daily, but each weak rebound will gradually erode market confidence.
Thus, Tencent’s risk-reward ratio is currently neutral to low. It’s not entirely without conditions for a rebound since the Relative Strength Index (RSI) is nearing oversold territory, and the price is gradually approaching the lower Bollinger Band. However, the price remains below the 10-day, 20-day, and 30-day moving averages, and rebounds lack trading volume support, keeping the short-term outlook in a weak downward trend. For short-term traders, HKD 445.800 is the first line of defense, HKD 428.888 is the next support if it breaks, HKD 459 is the initial recovery target, and HKD 472 represents a more meaningful improvement level.
Overall, what Tencent needs most at this stage isn’t just reliance on dividend or buyback stories but rather for the stock price to hold above HKD 445.800. If it holds, there’s still a chance for a technical rebound near HKD 450; if it doesn’t, the market will quickly shift focus to near HKD 428, intensifying fears of “another leg down.” To genuinely turn strong again, it must first break above HKD 459 and then stabilize above HKD 472. Until then, any rebounds should be viewed as weak pullbacks, and short-term operations should remain focused on defense and phased approaches.
Key strategy: In the short term, first watch if support at 445.800 yuan holds steady; if it does, consider a rebound from oversold conditions. A preliminary recovery opportunity arises once the price moves back above 459 yuan. If it stabilizes above 472 yuan, the rebound confirmation is stronger. However, if 445.800 yuan support is lost, there could be further downside towards 428 yuan.

Strategy One | Bet on an oversold rebound after holding steady above 445.800 yuan
$UBTENCT@EC2706A.C (27993.HK)$ | Strike price 500.50 yuan | Actual leverage 4.7x | Strike price close to the upper side of short-term recovery zone; leverage is not overly aggressive, suitable for betting on a rebound towards the 459-472 yuan range after the stock price stabilizes above 445.800 yuan.
$HSTENCT@EC2706A.C (28585.HK)$ | Strike price 500.50 yuan | Actual leverage 4.7x | Also a tool for targeting closer recovery goals, suitable for phased follow-ups after stabilization at lower levels. The key is waiting for the stock price to stabilize at support first—avoid chasing during weak downtrends.
$BITENCT@EC2706A.C (28657.HK)$ | Strike price 500.50 yuan | Actual leverage 4.7x | Balanced leverage and strike price structure, suitable for the early stage of a rebound; not an option for extreme elasticity, more appropriate for observing whether the stock price can re-challenge the 459 yuan threshold.
Strategy Two | After breaking through 459 yuan, aim for recovery above 472 yuan
$UBTENCT@EC2609E.C (27994.HK)$ | Strike price 580.50 yuan | Actual leverage 11.1x | Higher leverage, suitable for chasing a recovery when the stock price breaks through 459 yuan with trading support; mainly used to capture accelerating rebounds, not suitable for premature deployment while still fluctuating around 445 yuan.
$GJTENCT@EC2609B.C (27530.HK)$ | Strike price 580.50 yuan | Actual leverage 12.2x | Higher elasticity within the group, suitable for use when market sentiment improves significantly after breaking through 459 yuan; if the rebound doesn't extend near 472 yuan, risk will reflect more quickly.
$BPTENCT@EC2609D.C (28011.HK)$ | Strike price 580.50 yuan | Actual leverage 11.5x | Suitable for chasing momentum after a breakout; product elasticity lies between the previous two options, ideal when the stock price confirms strength and attempts to re-challenge near the 20-day moving average.
Strategy Three | Chase weakness after breaking below 445.800 yuan
$UBTENCT@EP2608A.P (26333.HK)$ | Strike price 466.46 yuan | Actual leverage 8.2x | Strike price is higher than the current price, reacts more directly to short-term declines, suitable for capturing downward moves towards 428 yuan after breaking below 445.800 yuan.
$BPTENCT@EP2608A.P (26244.HK)$ | Strike price 466.46 yuan | Actual leverage 8.6x | Higher leverage, suitable for pursuing sharper declines after breaking support; applicable when selling pressure intensifies after the stock price falls below 445.800 yuan.
$UBTENCT@EP2611A.P (27130.HK)$ | Strike price 399.80 yuan | Actual leverage 6.9x | Lower strike price, suitable for bearish bets without being overly close to the current price; mainly complements scenarios where the stock price falls below 445.800 yuan, aiming for a bottom near 428 yuan or even lower.
Reply to investor inquiries
@年少多金的睿哥: Breaking below 450 yuan has indeed shaken confidence; the key now is whether 445.800 yuan can hold and whether 459 yuan can be reclaimed.
@投資部Usagi: No increase after purchase, reflecting the current downtrend. It's not advisable to be optimistic too early before breaking through 459 and 472 dollars.
@FionaSummer: If there is one last drop, 445.800 dollars will be the first test level; if it fails to hold, the next support is seen at 428.888 dollars.
@16180762: The stock is currently weak, trading below multiple moving averages. There is no sign of strengthening until it breaks through 459 and 472 dollars.
@利好俠: Confirmation is needed for a bottom, not just relying on a single judgment. At the very least, it needs to hold above 445.800 dollars and break through 459 dollars.
Feel free to share your insights in the comment section. For more market analysis, please continue following ‘Hong Kong Stock Warrants Jenny’ for daily updates!
Reminder: This article does not constitute any investment advice.
This article is for reference only and does not constitute any investment advice. Market data, opinions, and analysis contained herein may change at any time without prior notice. We are not responsible for any loss or damage caused by reliance on the information in this article. Technical analysis only shows whether certain technical conditions are met; asset performance should be comprehensively evaluated using other sources of information, and trading decisions should not be made solely based on this article. Please note that past performance is not indicative of future results.
#HKStocks #Real-TimeAnalysis #WarrantSelection #WarrantGuide #DerivativesHedging #HKWarrantsJenny #Tencent #00700 #Blue-ChipStocks #TechnicalAnalysis$Hang Seng Index (800000.HK)$$Hang Seng TECH Index (800700.HK)$
Risk Disclaimer: The above content only represents the author's view. It does not represent any position or investment advice of Futu. Futu makes no representation or warranty.Read more
Comments (2)
to post a comment