After a sharp rise in a single day, Zhipu has entered an extremely volatile zone; the uptrend is evident but the risk of chasing the stock is extremely high.
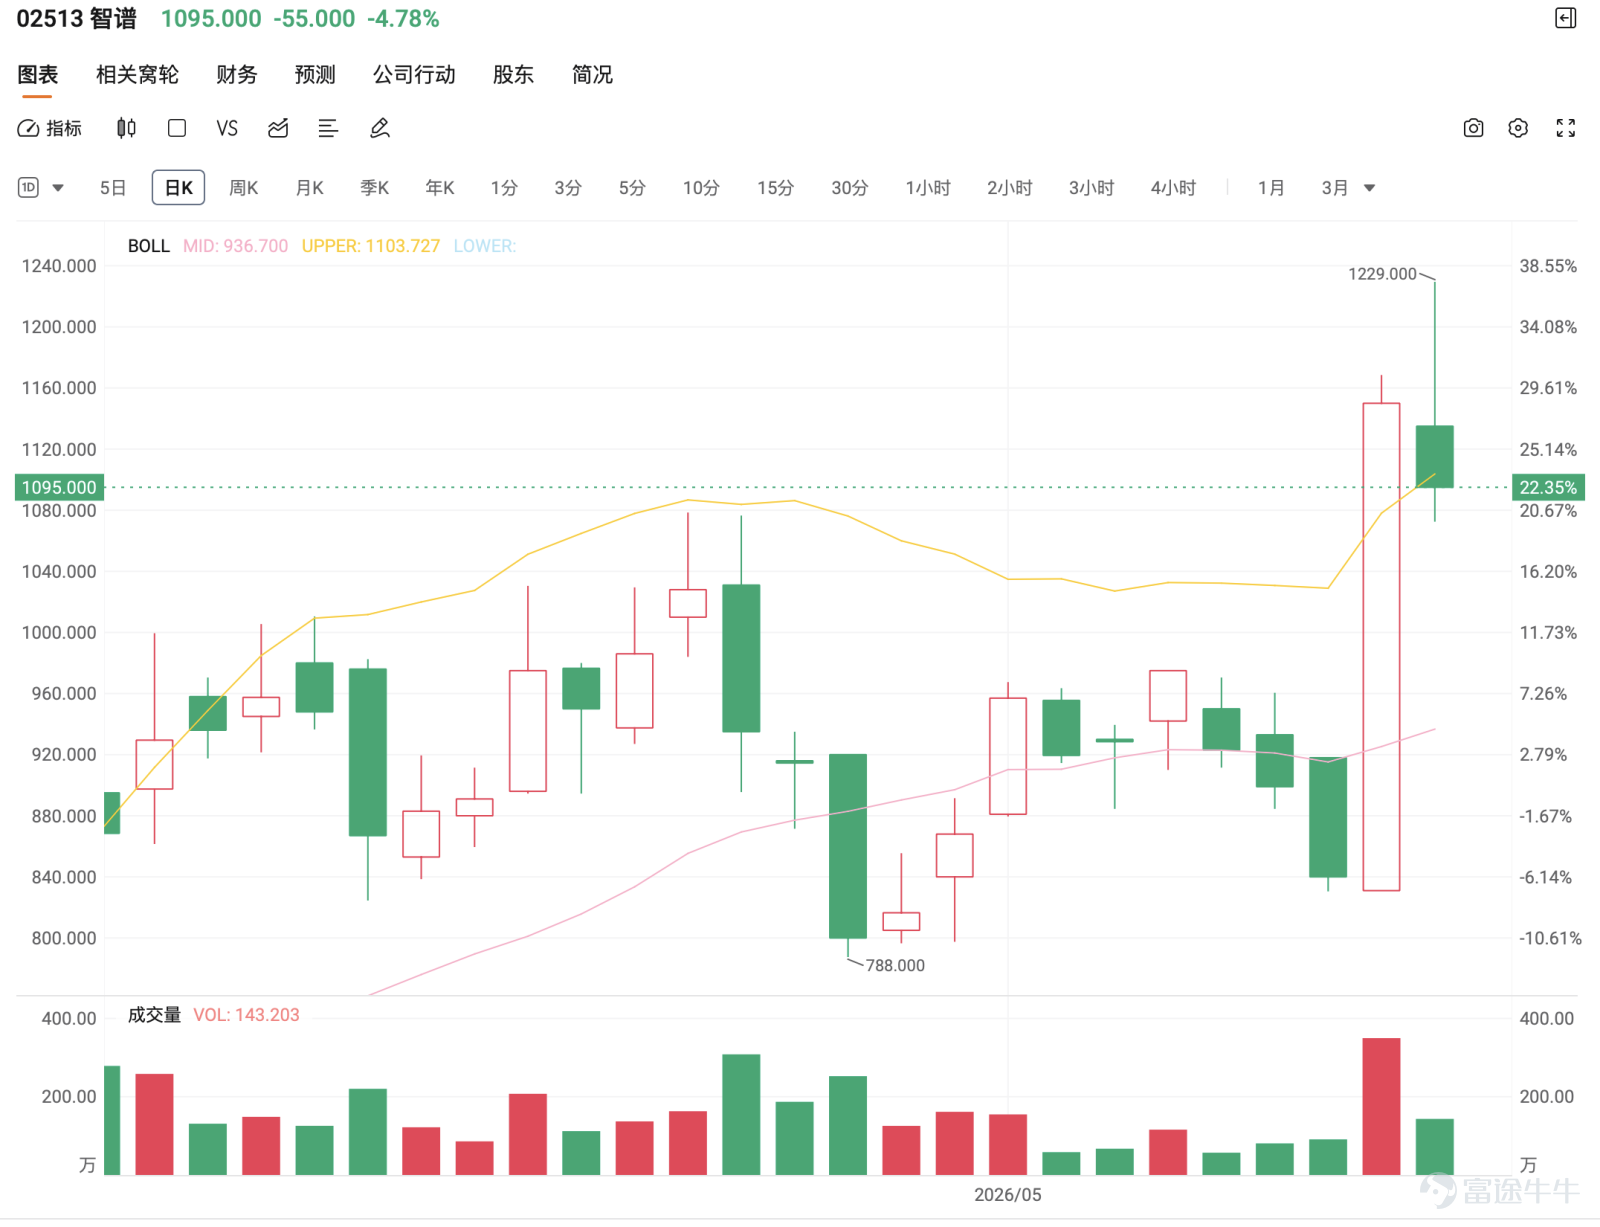
Zhipu (02513) surged 36.90% yesterday (13th), showing very strong short-term momentum, but also entering an extremely volatile zone. The stock price reached a high of 1168.000, hitting a recent peak, and clearly broke through the upper Bollinger Band at 1078.07, reflecting strong buying interest. This type of movement is usually not a normal rebound, but rather an accelerated uptrend driven by sentiment, market themes, and capital inflows. Today (14th), the stock closed at 1095, down 4.78%.

From the daily chart structure, Zhipu had already maintained a clear upward trend, with the stock consistently trading above key moving averages and repeatedly rising along the 10-day and 20-day lines. Currently, the 10-day line is around 927.650, the 20-day line and the middle line of the Bollinger Band are about 925.300, and the 30-day line is approximately 897.817. The current price is significantly higher than these moving averages, indicating a very strong trend, but also suggesting that the stock has moved far away from its short-term average, which means any pullback could result in significant fluctuations.
Regarding the Bollinger Bands, the upper band is at 1078.07, the middle band at 925.300, and the lower band at 772.532. Once the stock price breaks above the upper band, it signifies a short-term acceleration phase, but also reflects a rapid rise in the risk of chasing higher prices. Generally speaking, breaking above the upper band can represent a strong breakout, but if the increase is too sharp, it often requires a pullback or consolidation later on. The most important thing now is not to determine whether the uptrend exists, but to assess whether chasing the current price still offers a reasonable reward-to-risk ratio.
The Relative Strength Index (RSI) is approximately 72.823, entering an overheated region, indicating strong buying momentum, but also signaling that the stock price is no longer cheap in the short term. Combined with today's 36.90% surge, market sentiment is evidently highly excited. If the stock continues to rise from this level, it may experience inertia-driven spikes; however, if buying pressure weakens, the decline could be equally rapid.
Regarding support levels, the first short-term observation level is 1078.07, which is the upper Bollinger Band. If the stock price pulls back but still holds around 1078, it means there’s still buying interest post-breakout, and the uptrend might not end immediately. If it breaks below 1078, be cautious about a retest of the 10-day and 20-day moving averages, around 927 to 925. The distance from the current price to this zone is significant, which highlights the risk of chasing highs.
On the upside resistance, the high at 1168.000 serves as both immediate resistance and a psychological reference point. If the price can subsequently break through and stabilize above 1168, there may still be further upward momentum. However, at this stage, it is not only important to focus on potential gains above but also to pay attention to the downside risk if support at 1078 fails. For short-term trading, with such high-volatility stocks, the most critical aspect is not predicting tops, but managing entry points and stop-loss distances.
In terms of investor sentiment, bullish comments are highly enthusiastic, focusing on phrases like 'Don't miss out, there will be surprises,' 'Buy, buy,' 'A trillion-dollar market cap is not far,' and 'This is real strength.' This reflects that the market has moved from general optimism to a state strongly driven by sentiment. When a stock rises nearly 40% in a single day, it naturally creates a strong atmosphere for chasing gains, with some investors projecting short-term momentum into larger imagined upside potential.
This bullish sentiment can drive the stock price higher, but it also represents a source of risk. When the market generally expects further rises, short-term volatility often amplifies because any pullback could trigger stop-losses for those who bought at higher levels. In other words, Zhipu isn’t lacking upward momentum; the rally is already very evident, but the risk-reward ratio no longer matches the earlier low-price levels.
Bearish comments are mainly focused on 'It will drop tomorrow,' 'This is absurdly overvalued,' and 'How can a company without earnings rise like this?' These views primarily reflect concerns about valuation and the excessive speed of the rally. From a technical perspective, these worries are reasonable because the stock price has significantly deviated from its moving averages, and any short-term weakness could result in substantial pullbacks. However, bears should also note that during a strong acceleration phase, doubts about valuation might not immediately cause the stock price to retreat; instead, market sentiment may push it higher before gradually correcting.
The most representative comments come from those who are waiting on the sidelines. Some are asking what happened, others express fear of both falling and rising prices, some regret selling too early, and others are waiting for an opportunity to enter. This is exactly the typical market psychology during a sharp rally: those without positions are afraid of missing out, those with positions fear a pullback, early sellers regret their decision, and those wanting to chase worry about buying at a peak. When these emotions occur simultaneously, it indicates that the market has entered a high-volatility game stage.
In terms of short-term reward-to-risk, blindly chasing Zhipu at the current price is not advisable. If you already hold the stock at a lower price, you can use 1078 as a short-term defensive reference; as long as the price stays above the upper band, the uptrend may continue. If it falls below 1078, be prepared for a rapid pullback. For those without positions, chasing at the current price carries significant risk. It would be more reasonable to wait for a pullback near 1078 to observe support, or wait for another breakout above 1168 and stabilize before considering an ultra-short-term breakout strategy.
Overall, Zhipu is currently a clearly strong stock but not at a low-risk position. The significant rise today confirms the inflow of capital, pushing the share price into a high volatility and high-risk zone. 1168 serves as a short-term breakout reference level, while 1078 acts as the first line of defense, and the 927 to 925 range provides key moving average support. If 1078 can be held, the upward trend remains intact; if 1078 is breached, be cautious about a rapid pullback following the sharp rise. At this stage, respect the strength, but don’t overlook the risks of chasing higher prices.
Reply to comment
Zhipu is indeed showing strong momentum now, but it has surged above the upper Bollinger Band, indicating significant volatility. If holding the stock, first observe whether 1078 can hold. Stability above this level could extend the positive surprises.
The risk of a pullback tomorrow (the 14th) after the sharp rise does exist. If it breaks below 1078, short-term downward pressure will increase significantly.
The surge has been very rapid, with valuation and sentiment quickly pushed higher. However, strong stocks don't necessarily peak immediately; the key remains whether 1078 holds or not.
Fundamentals and profitability are medium to long-term risks, while short-term movements are driven by capital flow and sentiment. At this stage, pay special attention to the valuation digestion pressure after an overly rapid rise.
Stock Name: Zhipu (02513)
Short-term strategy assessment: Strong upward momentum in the short term, but all products are call options with generally distant strike prices, making them suitable for trend-following upon breakout and high volatility short-term trading; unsuitable for stable low-level rebound strategies.
Strategy One: Breakout Trend Following
28650 | Strike Price 1138.00 | Actual Leverage 1.7x | Closest to current price, suitable for more secure trend-following after breakout confirmation
28604 | Strike Price 1200.00 | Actual Leverage 1.6x | Slightly out-of-the-money, suitable for deployment during continued strength
28361 | Strike Price 1233.33 | Actual Leverage 1.6x | Lower degree of being out-of-the-money, suitable for short-term trend-following post-breakout
Strategy Two: High-Leverage Short-Term Trading
28453 | Strike price 3815.00 | Actual leverage 2.2x | High degree of out-of-the-money, suitable for very short-term high volatility trading
28350 | Strike price 3813.00 | Actual leverage 2.1x | Out-of-the-money call, suitable for short-term strong upward acceleration
28397 | Strike price 2026.00 | Actual leverage 1.9x | Higher elasticity, suitable for short-term trading when volatility expands
Reminder: This article does not constitute any investment advice.
This article is for reference only and does not constitute any investment advice. Market data, opinions, and analyses contained herein may change at any time without prior notice. We assume no responsibility for any loss or damage resulting from reliance on the information in this article. Technical analysis only indicates whether certain technical conditions are met; a comprehensive evaluation of asset performance should combine other information, and trading decisions should not be made solely based on this article. Please note that past performance is not indicative of future results. Follow Jenny’s insights on Hong Kong stock warrants for more professional analysis. $Hang Seng Index (800000.HK)$$Hang Seng TECH Index (800700.HK)$
Risk Disclaimer: The above content only represents the author's view. It does not represent any position or investment advice of Futu. Futu makes no representation or warranty.Read more


Comment (1)
to post a comment
3