Xiaomi's trend is stuck: Overbought pressure coexists with rebound expectations. Is it time to position for a rebound or to wait and see?
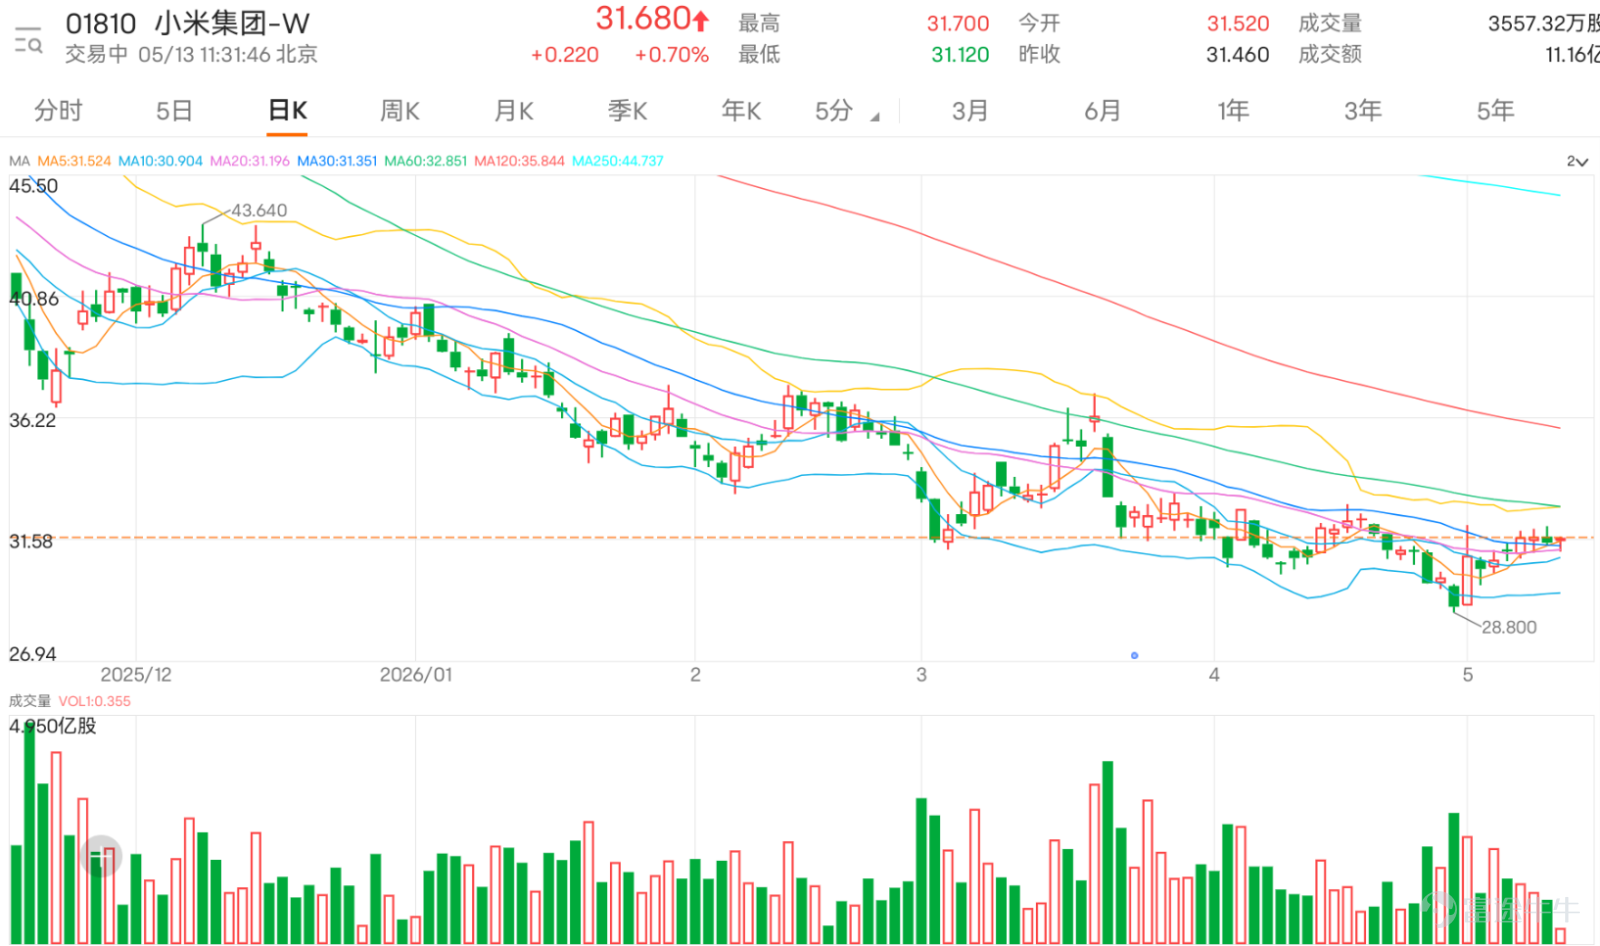
$XIAOMI-W (01810.HK)$ Currently consolidating with narrow-range fluctuations above the 31-yuan mark, with the latest quote at 31.7 yuan. The stock price is oscillating around key moving averages, currently slightly above the 10-day line (30.73 yuan) but constrained below the resistance zone formed by the 60-day line (32.91 yuan), indicating that the mid-to-short-term moving average structure remains entangled, and the trend direction is still unclear.
From the perspective of short-term technical indicators, market momentum shows divergence but hints at potential turning points. Several oscillation indicators are sending noteworthy signals. Among them, the Stochastic Oscillator has issued a 'sell signal,' suggesting that the stock price may have reached a short-term overbought region in recent volatility and started to pull back. However, simultaneously, the CCI has given a clear 'buy signal,' which usually indicates that the current price deviation from the norm may soon correct, presenting potential reversal momentum. Additionally, the Momentum Oscillator (MTM) and Rate of Change (ROC) indicators also show 'buy' signals, reinforcing the view that short-term momentum might strengthen. This divergence and contradiction between indicators precisely reflect the intense tug-of-war near key levels.
In terms of key technical levels, the first important support below is around 30.4 yuan, close to the 10-day line. If this support fails, the next stronger support zone at 29.4 yuan will be tested. The resistance above is initially seen at 32.7 yuan; once broken through, the next target will point to 33.6 yuan. Notably, the Moving Average Convergence Divergence (MACD) maintains a 'buy' signal, providing some bullish confidence for the medium-term structure, but confirmation from an actual price breakout above the moving average pressure is needed.
In summary, Xiaomi's stock price is at a short-term technical decision point. Although the Stochastic indicator suggests overbought pullback pressure, indicators like CCI, Momentum, and MACD imply that downward momentum may weaken, and rebound forces are accumulating. If the stock price can hold firmly above the 30.4-yuan support and successfully reclaim 31.38 yuan (the 30-day line), it could attract short-term capital inflows and challenge the resistance at 32.7 yuan. For professional investors, the current situation is not a one-sided trending market but rather a phase where range trading and breakout preparation coexist. Operationally, close attention should be paid to whether the price stabilizes near the support level with positive momentum indicators as a reference for deploying short-term technical rebounds, using the breakout of resistance levels as validation for whether the trend can strengthen further.


Regarding call warrants, if you are optimistic about Xiaomi’s future performance, you can consider... $UBXIAMI@EC2609E.C (28195.HK)$ Its exercise price is 37.01 yuan, offering approximately 6.7 times leverage. The key feature of this product is its relatively low implied volatility, which helps to reduce the impact of time decay, making it suitable for investors expecting a gradual rise in share price. $HSXIAMI@EC2609E.C (28627.HK)$ The exercise price is also 37.01 yuan, with leverage of about 6.8 times. The advantage of this warrant lies in its premium being the lowest among similar products, along with favorable implied volatility and leverage levels, resulting in relatively attractive overall cost efficiency.
For put warrants, if you are bearish on Xiaomi's future performance, consider $BIXIAMI@EP2608A.P (26045.HK)$ With an exercise price of 28.16 yuan and leverage of around 7.2 times. This product stands out as having both the lowest premium and implied volatility in its category, effectively reducing the cost of misjudging market direction. Another option is $BIXIAMI@EP2610B.P (27348.HK)$ With an exercise price of 28.78 yuan, providing leverage of about 4.4 times. Its implied volatility is also relatively low, making it appropriate for investors with a mild outlook on potential stock price pullbacks.
For bull contracts, investors who are optimistic about the future market and want to capture a rebound efficiently can look at $HS#XIAMIRC2611K.C (54160.HK)$ With a stop-loss level of 29 yuan, providing actual leverage of about 9.7 times. This bull contract has the lowest premium and higher actual leverage, amplifying returns from rising stock prices. Another choice is $UB#XIAMIRC2610D.C (53951.HK)$ With a stop-loss level also at 29 yuan, offering actual leverage of about 9.5 times. This product’s leverage is relatively high, making it equally suitable for aggressive bullish strategies.
For bear contracts, if you are bearish on the future market and wish to capitalize on a potential stock price correction, pay attention to $UB#XIAMIRP2812L.P (66577.HK)$ With a stop-loss level of 33.8 yuan, providing actual leverage as high as 13.7 times — the highest in its category — and the lowest premium, maximizing returns from downward movements efficiently. Another option is $JP#XIAMIRP2811A.P (62139.HK)$The recovery price is 33 yuan, with an actual leverage of approximately 18.5 times. This warrant offers high actual leverage and low premium, making it suitable for investors with a higher risk tolerance and a clear bearish outlook on the market.

Xiaomi has been consolidating around 31 yuan for several days. Do you think this level is a suitable short-term entry point, or would it be more prudent to wait for a breakout above the 60-day moving average before entering?
Feel free to share your insights in the comment section. For more market analysis, please continue following ‘Hong Kong Stock Warrants Jenny’ for daily updates!
Reminder: This article does not constitute any investment advice.
This article is for reference only and does not constitute any investment advice. Market data, opinions, and analysis contained herein may change at any time without prior notice. We are not responsible for any loss or damage caused by reliance on the information in this article. Technical analysis only shows whether certain technical conditions are met; asset performance should be comprehensively evaluated using other sources of information, and trading decisions should not be made solely based on this article. Please note that past performance is not indicative of future results.
#HKStocks #LiveAnalysis #WarrantPick #WarrantGuide #DerivativesHedging #HKWarrantsJenny #Xiaomi #01810 #BlueChipStocks #TechnicalAnalysis$Hang Seng Index (800000.HK)$$Hang Seng TECH Index (800700.HK)$
Risk Disclaimer: The above content only represents the author's view. It does not represent any position or investment advice of Futu. Futu makes no representation or warranty.Read more

Comment (1)
to post a comment
3