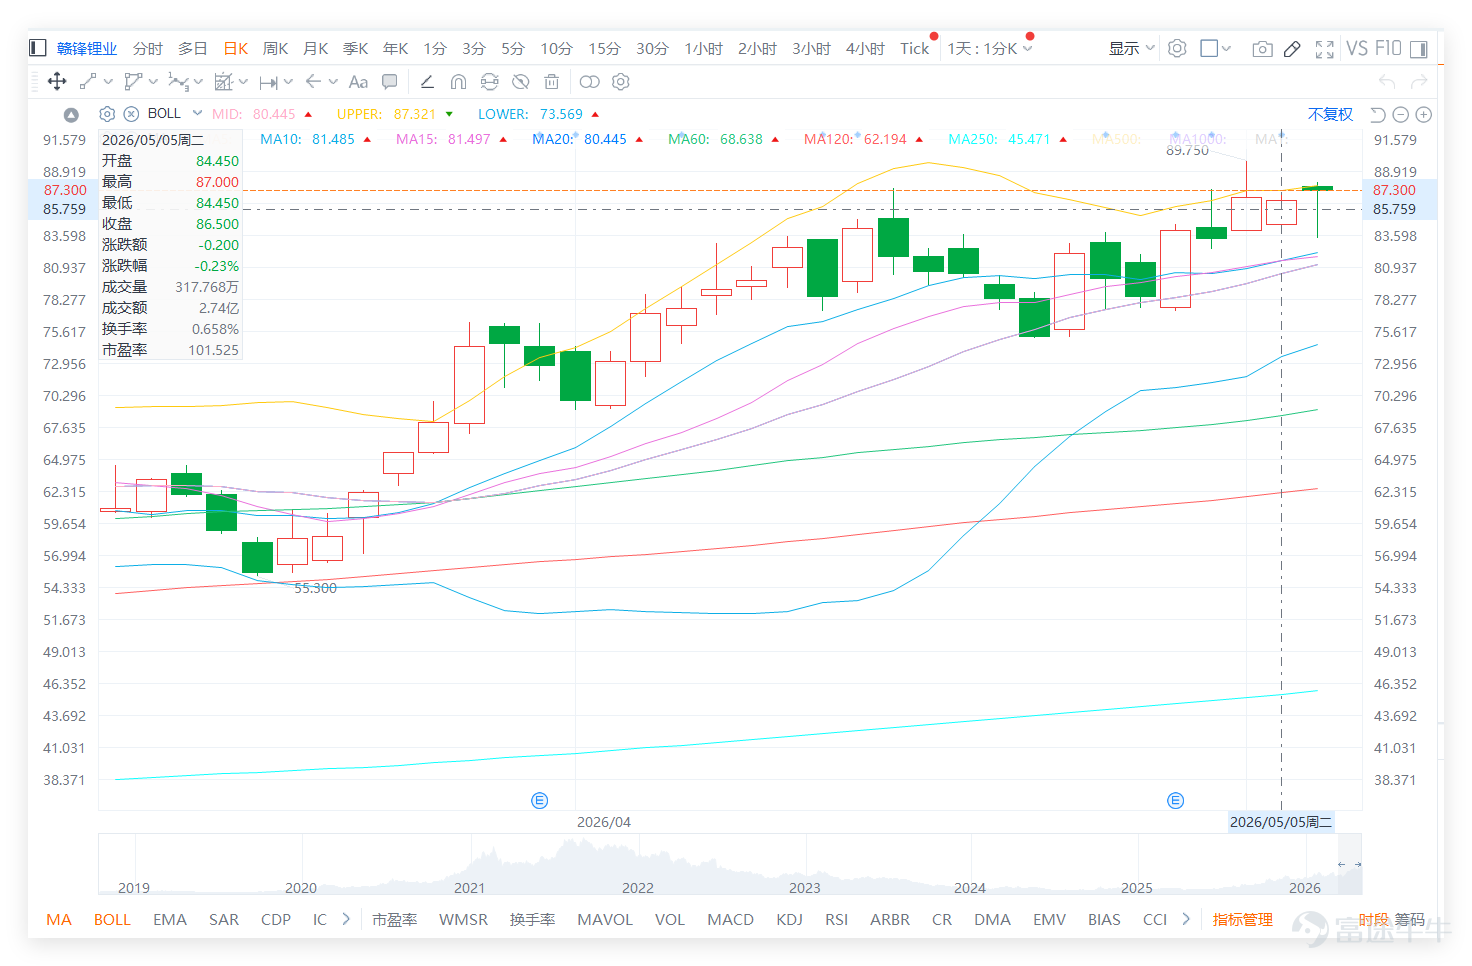

Ganfeng Lithium is approaching the resistance level near 88 yuan. The market's real misjudgment is treating the strong rebound as if the high-level risks can already be ignored.
Looking at the leading lithium resource stocks, $GANFENGLITHIUM (01772.HK)$
and$TIANQI LITHIUM (09696.HK)$ The summary signals of technical indicators are all ‘sell’, with their RSIs reaching as high as 71 and being at elevated levels, indicating that the sector as a whole has entered an extremely overbought region. This suggests that Ganfeng’s strong upward movement is occurring in an environment where peer technical ratings are becoming cautious and the system consistently issues sell warnings. The ‘sell’ signal diverges from its still-high share price, technically confirming the risks hidden within market optimism. This also means that if it wants to successfully break through the resistance zone of 87.321-87.750, it will not only need strong momentum but also reverse the technical disadvantage aligned with its peer (Tianqi), making it quite challenging.
Ganfeng Lithium closed at 86.500 on the previous day (the 5th), falling 0.23% in a single day. Judging from investor comments, market sentiment is clearly leaning towards optimism, but this optimism is not unanimous buying; instead, it is mixed with taking profits at highs, waiting for a pullback to buy, concerns about a broader market correction, and divergence over whether lithium prices can trend upward again. This emotional structure indicates that Ganfeng remains a strong stock but has now entered a short-term resistance verification zone.
The most prominent view in the comments is that Ganfeng still has room to rise further. Some believe 'it will shake off and move higher,' some are looking forward to it reaching 90, while others connect factors like the Middle East situation, acceleration of green energy, and the strengthening lithium price cycle, thinking that 120 is not an unrealistic target. These comments reflect that the market has put Ganfeng back into the main trading narrative of resource stocks and new energy materials.
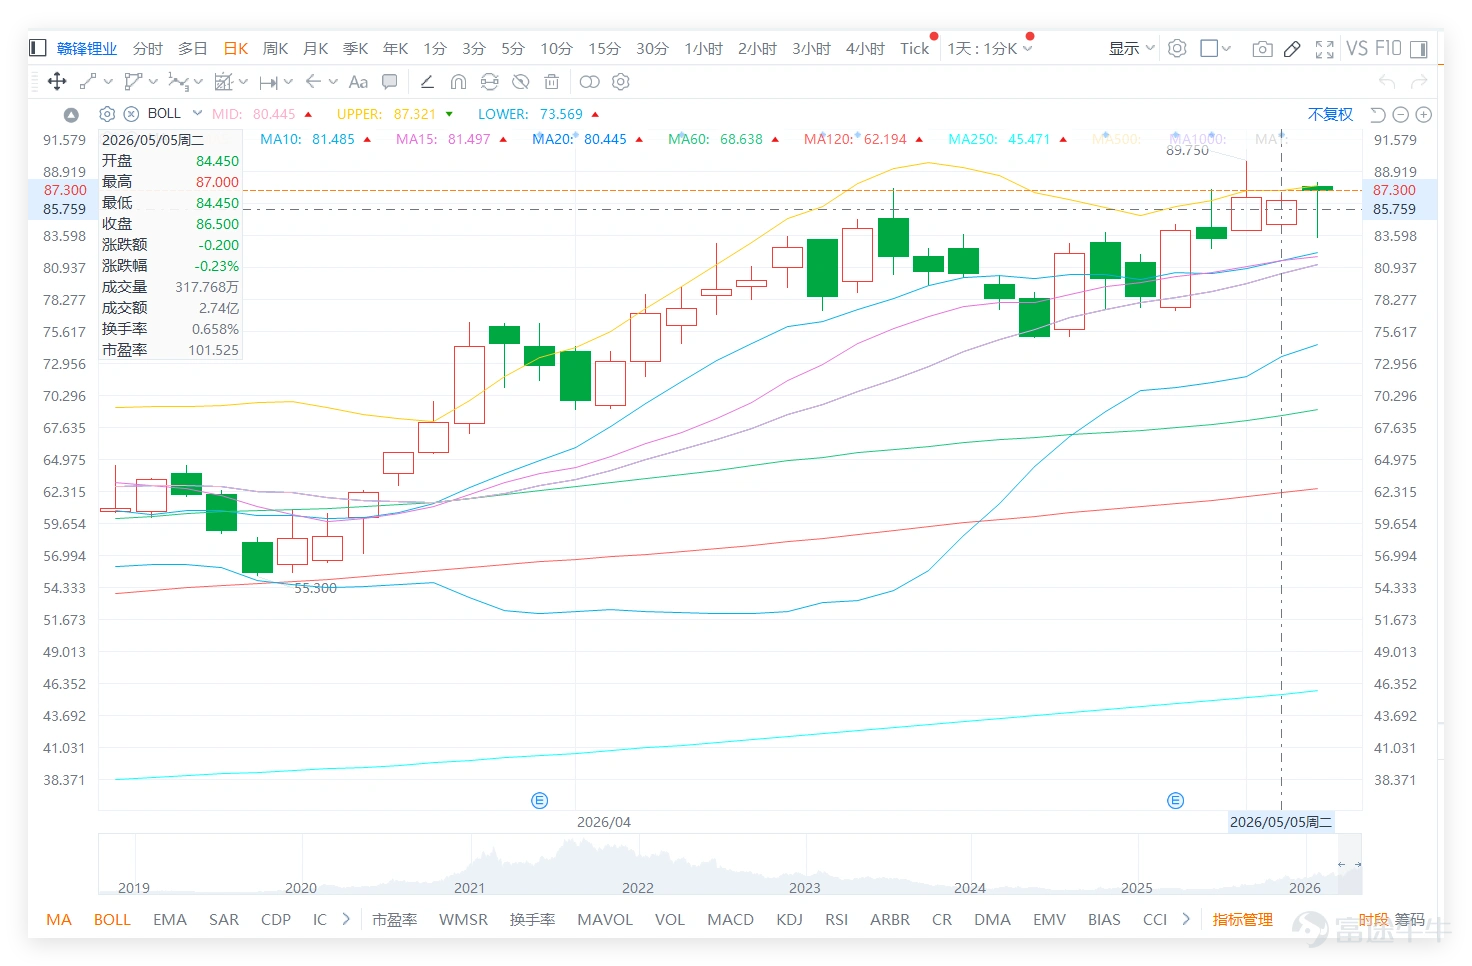
But there’s an important distinction here: A positive medium-term narrative does not mean blindly chasing the stock ahead of resistance in the short term. Ganfeng is currently priced at 86.500, which is still above the 10-day line at 81.485, the middle Bollinger Band axis at 80.445, and the 30-day line at 75.620, indicating the short-term structure remains strong. However, the current price is very close to the upper Bollinger Band at 87.321 and the previous high of 87.750. This means the stock is now at a position where a breakout confirmation is needed, rather than being in its initial stages from a low point.
Another type of comment reflects that some funds in the market have started to turn cautious. Some investors exited near 88.5 to 88.9, planning to buy back around 80; others think the Hang Seng Index might still correct, and they want to wait and see after the mainland holiday. These investors aren't rejecting Ganfeng but believe the risk-reward ratio decreases when nearing previous highs, requiring first an assessment of whether the broader market and trading volume can support further gains.
This thinking is quite consistent with the technical structure. The biggest issue with Ganfeng right now isn't weakness, but rather the contraction in trading volume as it approaches its recent highs. The latest trading bar shows a clear contraction in volume, indicating that buying pressure begins to weaken as the stock price nears the resistance zone of 87 to 88 yuan. Strong stocks can consolidate on low volume, but if they fail to break through after such contraction, short-term funds are likely to take profits early.
The market's easiest mistake at the moment is interpreting Ganfeng's strong rebound as a sure breakout. In reality, when a strong stock approaches previous highs, the most important factor isn’t how bullish the market sentiment is but whether there’s sufficient trading volume to support the breakout. Without adequate volume, even if the stock briefly rises toward 88 yuan, it could easily fall back from those levels.
While bearish voices aren’t dominant, they still hold some value for consideration. Some have pointed out capital outflows and unreliable institutional trading data, while others remind investors not to focus solely on certain share accumulation news but instead return to financial reports and genuine technical analysis. Such reminders are valuable because stocks like Ganfeng, which are cyclical, risk being driven purely by news without considering price levels. Whether the lithium cycle is turning upward again to support medium-term expectations remains debatable, but whether it can break above 87.750 in the short term will ultimately be determined by price action.
Ganfeng’s current watershed level remains at 80.445, meaning as long as the stock stays above this level, the overall rebound structure hasn’t been broken. However, short-term trading shouldn’t rely solely on the watershed; one must also consider the distance between the current price and resistance levels. With the current price at 86.500 nearing 87.321 and 87.750, there’s limited upside for chasing entries. Moreover, if the breakout fails, the pullback towards 81.485 or even 80.445 would be significant. Hence, the short-term reward-to-risk ratio is only neutral.
The Relative Strength Index is approximately 71, showing strong momentum but nearing high levels. This state is most suitable for waiting for a breakout confirmation rather than impulsively entering below resistance. If the stock price can break above 87.321 and 87.750, and trading volume picks up again, the market will have a basis for imagining levels of 90 or even higher. At that point, funds that previously exited or remained on the sidelines near 88 may reassess whether they need to chase back in.
On the other hand, if Ganfeng continues to struggle below 87.750 and drops below 81.485, market sentiment will shift from 'strong consolidation' to 'profit-taking at highs.' At that time, 80.445 will become a critical defensive line. If even 80.445 is breached, the short-term structure will notably weaken, and attention should then turn to 75.620.
Overall, Ganfeng Lithium remains in a relatively strong pattern and is not considered weak. However, strength does not equate to an absence of risk, especially since the stock price is already close to upper resistance, and trading volume has yet to show enough support for a breakout. Market optimism surrounding the lithium price cycle and green energy themes can persist, but short-term trading should still focus on the key levels of 87.321 and 87.750.
For short-term strategies, Ganfeng should aim to confirm a breakout above 87.321 and 87.750. A successful breach and sustained hold above these levels could extend the uptrend, while failure to do so requires caution regarding potential consolidation or profit-taking at highs. On the downside, 81.485 serves as the first defensive level. If breached, attention should shift to the risks around 80.445 and 75.620.
In conclusion, Ganfeng is not currently bearish, but excessive optimism ahead of resistance is unwarranted. The true determinant of the next directional move isn’t speculative hopes around 120 or fears around 80, but whether 87.750 can be decisively broken.
Based on the above analysis, the strategies for deployment can be divided into the following main approaches:
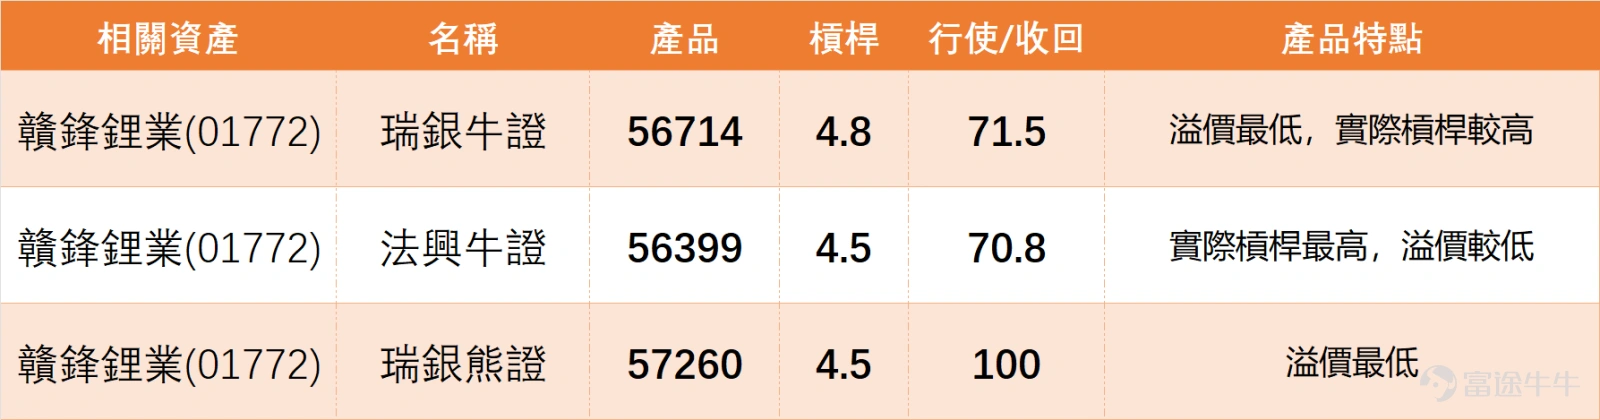

For more market analysis, stay tuned to Jenny's daily updates on 'Hong Kong Stock Warrants'!
Reminder: This article does not constitute any investment advice.
This article is for reference only and does not constitute any investment advice. Market data, opinions, and analysis contained herein may change at any time without prior notice. We are not responsible for any loss or damage caused by reliance on the information in this article. Technical analysis only shows whether certain technical conditions are met; asset performance should be comprehensively evaluated using other sources of information, and trading decisions should not be made solely based on this article. Please note that past performance is not indicative of future results.
#HongKongStocks #GanfengLithium #RealTimeAnalysis #WarrantPicks #WarrantStrategy #DerivativesHedging #HKStocksWarrantsJenny #BlueChipStocks #TechnicalAnalysis
Risk Disclaimer: The above content only represents the author's view. It does not represent any position or investment advice of Futu. Futu makes no representation or warranty.Read more


Comments (3)
to post a comment
5
1