
CATL (3750) sees a sharp increase in trading volume, with technical indicators showing signs of bottoming out
CATL's stock price experienced a significant pullback, currently trading at RMB 627, down 7.11%, with trading volume surging to RMB 7.831 billion, reflecting intensified selling pressure. The 5-day volatility expanded to 16.9%, indicating severe short-term fluctuations. The stock price has fallen below several key moving averages and is in a short-term consolidation phase.
Technical Analysis
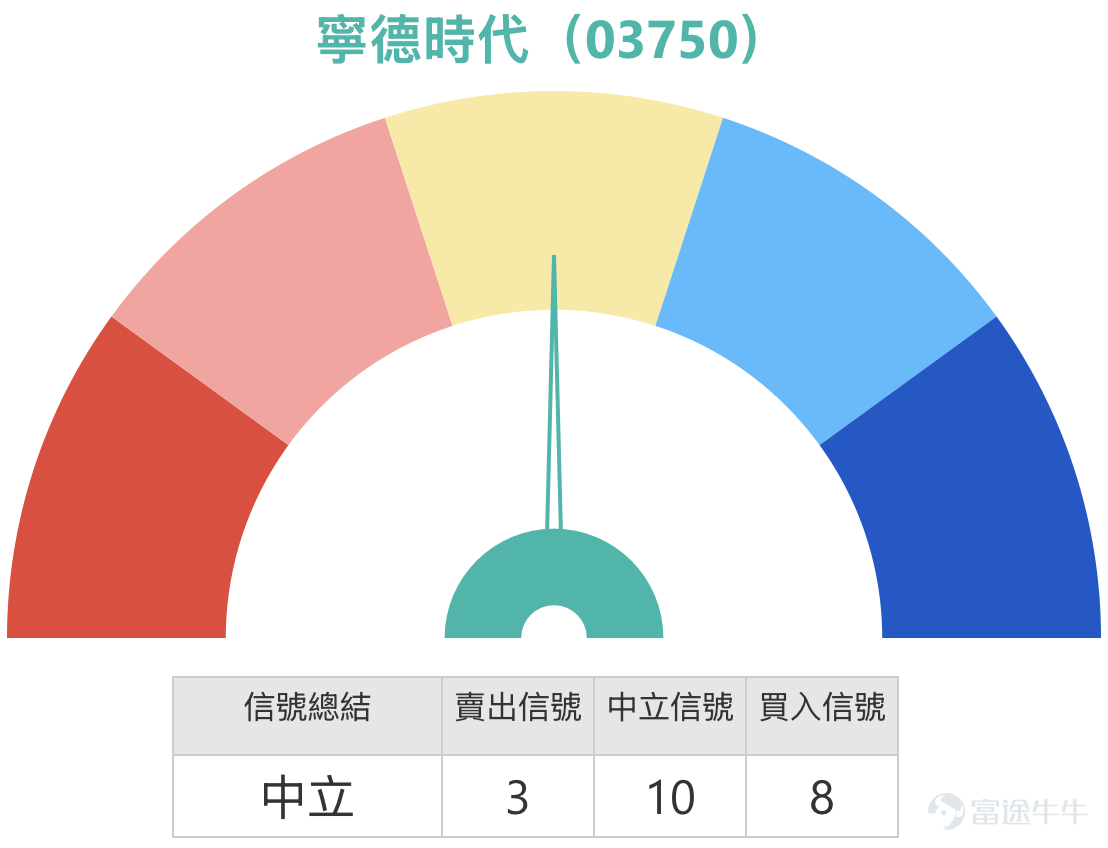
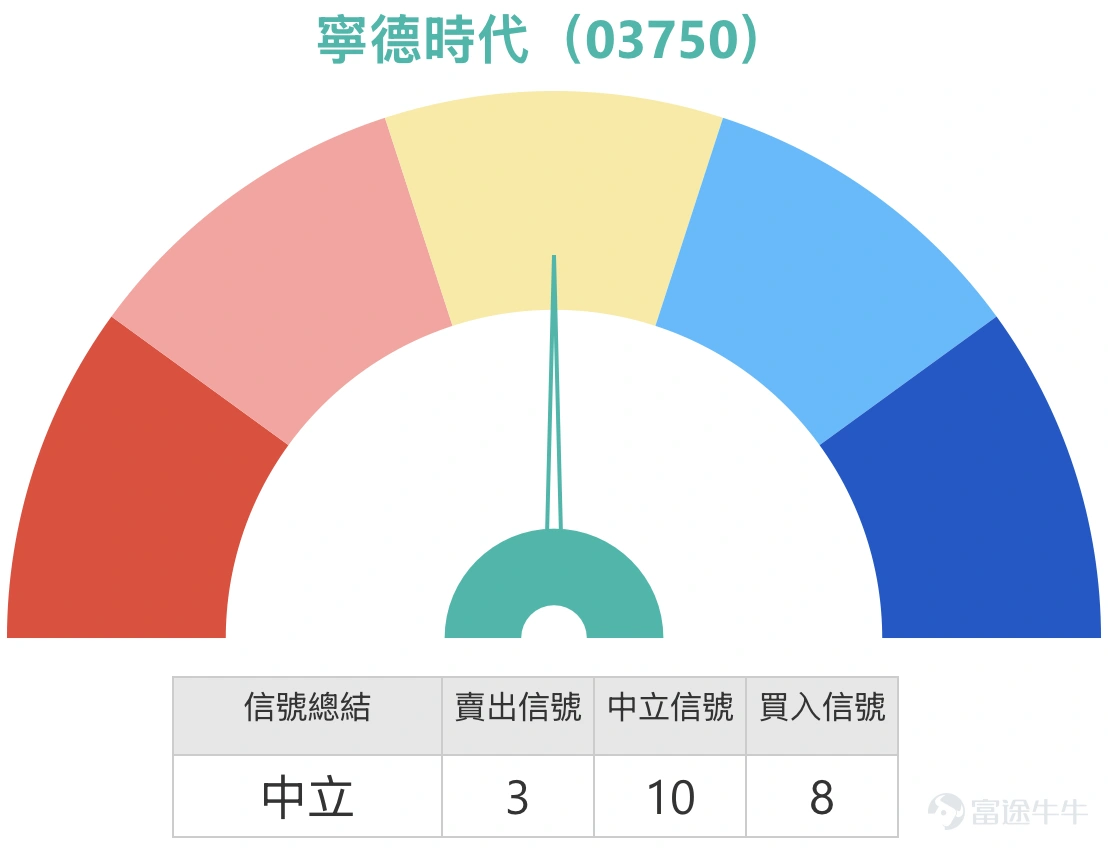
Today’s share price is RMB 628, significantly lower than the 10-day line at RMB 690.15 and the 30-day line at RMB 660.98, but still above the 60-day line at RMB 586.02, with mid-term upward momentum retaining some support. Key support levels are set at RMB 597 and RMB 548, while resistance levels lie at RMB 677 and RMB 710, with a 47% probability of an upward move. The Relative Strength Index (RSI) is at 44, nearing oversold territory but not at extreme levels, suggesting weaker short-term momentum, though further downside may be limited. Bollinger Bands signal neutrality, MACD suggests sell, and the bull-bear power indicator shows “severely oversold, possible bottom formation, buy.” Multiple oscillators (Williams %R, Stochastic, CCI) are in oversold zones and issuing buy signals, resulting in an overall neutral technical summary. Overall, the stock is severely oversold in the short term, indicating potential for a rebound, but it needs to stabilize above the RMB 597 support level to foster a stronger recovery.
Short-term trend analysis
The current stock price is in the bottom-seeking phase after a rapid decline. A rebound to 677 or even 710 resistance levels may occur only if the price stabilizes above 597 yuan and recaptures the 10-day moving average at 690.15 yuan. Conversely, if the price continues to fall below 597 yuan, the next support level will be at 548 yuan, which would put the medium-term uptrend to the test. The risk-reward ratio has improved at this stage, but due to high volatility, the strategy should primarily focus on oversold rebounds, with strict stop-loss levels set.
Warrant Product Recommendations
The following products are analyzed based on today's CATL stock price of 627 yuan and correlated with key support and resistance levels.
Bullish rebound strategy (Suitable for expecting the stock price to stabilize and rebound near 597 yuan)
UBS Group Call Warrant (15872) $UB-CATL@EC2609A.C (15872.HK)$ , exercise price 629.38 yuan, effective leverage 4.9 times. The advantage of this product lies in its relatively low implied volatility, with the exercise price of 629.38 yuan very close to the current price of 627 yuan, making it slightly out-of-the-money. If the stock price confirms support and rebounds near 597 yuan, this warrant will quickly move into the money, reacting directly to any upside recovery. The low implied volatility helps minimize additional losses caused by market sentiment fluctuations, making it suitable for short-term capturing of oversold rebounds.
Bank of China Call Warrant (13229) $BI-CATL@EC2609A.C (13229.HK)$ , exercise price 629.38 yuan, effective leverage 5.4 times. This product's advantage lies in having the lowest premium and implied volatility among similar products, with leverage slightly higher than the UBS product. Alternatively, consider UBS Bull Certificate (58098), with a stop-loss level at 570 yuan and actual leverage of 10.5 times. The advantage of this product is its lowest premium and higher actual leverage. The stop-loss level at 570 yuan is lower than the first support level at 597 yuan, offering an appropriate buffer while maintaining high leverage. HSBC Bull Certificate (58710), with a stop-loss level at 560 yuan and actual leverage of 8.9 times.
Deployment for bearish continuation
BNP Paribas Put Warrant (27289), exercise price 551.38 yuan, effective leverage 2.4 times. The advantage of this product lies in its lowest premium and implied volatility among similar products, with an exercise price about 12% below the current stock price, making it out-of-the-money. If the stock price breaks below 597 yuan and moves towards 548 yuan, this warrant will gradually move into the money, tracking the downside movement. Its low premium and implied volatility design allow it to more accurately reflect declines in the underlying stock during a downtrend, making it suitable for investors with a bearish medium-term outlook.
HSBC Put Warrant (27504), exercise price 551.38 yuan, effective leverage 2.4 times. The advantage of this product lies in its relatively low implied volatility, with terms similar to the BNP Paribas product, but potentially better liquidity provided by HSBC as the issuer. Suitable for bearish strategies after confirming a break below 597 yuan, capturing potential pullbacks to 548 yuan. $HS-CATL@EP2703A.P (27504.HK)$$BP-CATL@EP2703A.P (27289.HK)$

Feel free to leave a comment and share your thoughts! Follow Jenny's HKEX Warrants for more professional analysis.
Warm Reminder: This article does not constitute any investment advice. It is for reference only and does not constitute any investment advice. The market data, opinions, and analysis contained herein may change at any time without prior notice. We are not responsible for any loss or damage caused by reliance on the information in this article. Technical analysis only shows whether certain technical conditions are met; a comprehensive evaluation of asset performance should be made using other data, and trading decisions should not be based solely on this article. Please note that past performance is not indicative of future results. Follow HK Stocks Warrants Jenny for more professional insights.
Risk Disclaimer: The above content only represents the author's view. It does not represent any position or investment advice of Futu. Futu makes no representation or warranty.Read more
Comments
to post a comment