

April 27 [Hong Kong Stock Podcast] Part-1 - Hang Seng Index, Geely Auto, Kuaishou
1. The short-term upward momentum of the Hang Seng Index has weakened, with the range between 26,093 and 26,120 points becoming a key level for an intraday rebound.
The Hang Seng Index closed at 25,925.65 points on April 27 (closing price), below the 5-day moving average of 26,093.93 points and the 10-day moving average of 26,120.49 points, indicating that short-term upward momentum has weakened somewhat. However, the index remains above the 20-day moving average of 25,708.13 points and the 30-day moving average of 25,621.10 points, so overall it is not yet significantly bearish, and for now, it can be considered as consolidation at higher levels.
Technically, 25,858.24 points is the short-term tipping point. As long as the index can hold above this level, there will still be support underneath, and there may still be opportunities to retest the resistance zone between 26,093.93 and 26,120.49 points. Breaking through this range would indicate that rebound momentum has improved again.
Conversely, if the index falls below 25,858.24 points, then attention should be paid to a potential retest of the midline of the Bollinger Bands at 25,708.13 points, or even support at 25,387.50 points. The Relative Strength Index (RSI) stands at 46.660, reflecting that momentum has receded to slightly weak levels, so at this stage, it's not advisable to aggressively chase long positions.
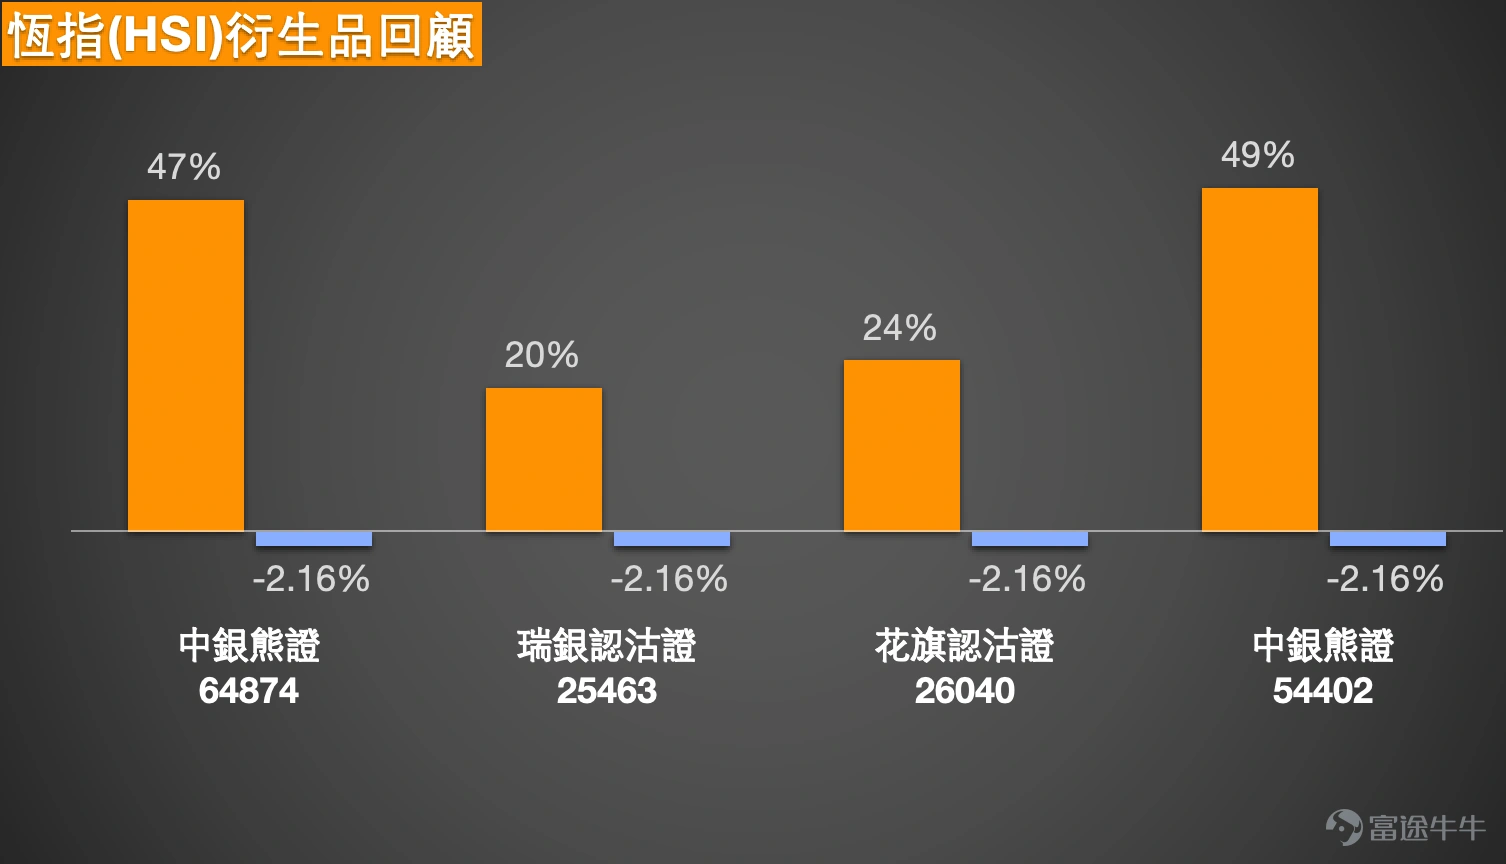
In terms of investor positioning, some investors chose to take profits on bull contracts with a recovery price of 25,638 points before the market close, indicating short-term caution about the risks associated with closely-priced bull contracts. Others opted for bull contracts with a recovery price of 24,848 points, showing a clear preference for maintaining a larger safety margin, suitable for handling volatile market conditions near highs.
The bearish side believes there is a possibility for the index to retreat to between 24,300 and 24,500 points, holding bear contracts with a recovery price of 26,600 points. From the current technical perspective, the index is indeed constrained by resistance at 26,093 to 26,120 points in the short term. However, to confirm an extended downturn, the index would first need to fall below 25,858.24 points. If the index does not break below this level, short positions should still be wary of rebound squeeze risks.
In terms of short-term strategy, the current level for the Hang Seng Index should be 25,858.24 as the dividing line between bullish and bearish sentiment. If this level is maintained, it can be seen as consolidation at higher levels; breaking back above 26,093.93 to 26,120.49 would indicate improved rebound momentum. If the 25,858.24 level is breached, then attention should be paid to potential support at 25,708.13 and 25,387.50. $BI#HSI RP28041.P (64874.HK)$$UB-HSI @EP2607A.P (25463.HK)$$CT-HSI @EP2607A.P (26040.HK)$$BI#HSI RP2803R.P (54402.HK)$
2. Geely Auto (00175.HK) shows short-term weakness, with 21.938 yuan being the key to whether the short-term bottom can hold.
Geely Auto closed at 22.380 yuan on April 27, below the 5-day moving average of 23.668 yuan, the 10-day moving average of 24.076 yuan, and the 20-day moving average of 23.409 yuan, indicating a clear weakening of the short-term uptrend. Although the share price remains above the 30-day moving average of 21.938 yuan and the 60-day moving average of 19.149 yuan, and the medium-term rebound structure has not been completely broken, it is still viewed as a pullback consolidation unless it breaks back above 23.409 yuan.
The Relative Strength Index (RSI) is at 29.856, which is indeed approaching oversold territory. This indicates that short-term selling pressure has eased somewhat, but it does not automatically confirm an immediate bottom. If the stock price can stabilize above 21.938 yuan and break back above the 20-day moving average of 23.409 yuan, a short-term bottom is more likely to form, after which resistance at 24.076 yuan should be monitored.
If the price falls below 21.938 yuan, it would indicate that consolidation pressures persist, with the next support level at 20.418 yuan. At this stage, the risk-reward ratio remains relatively low, as although the RSI is low, the stock price has yet to stabilize above key short-term moving averages.
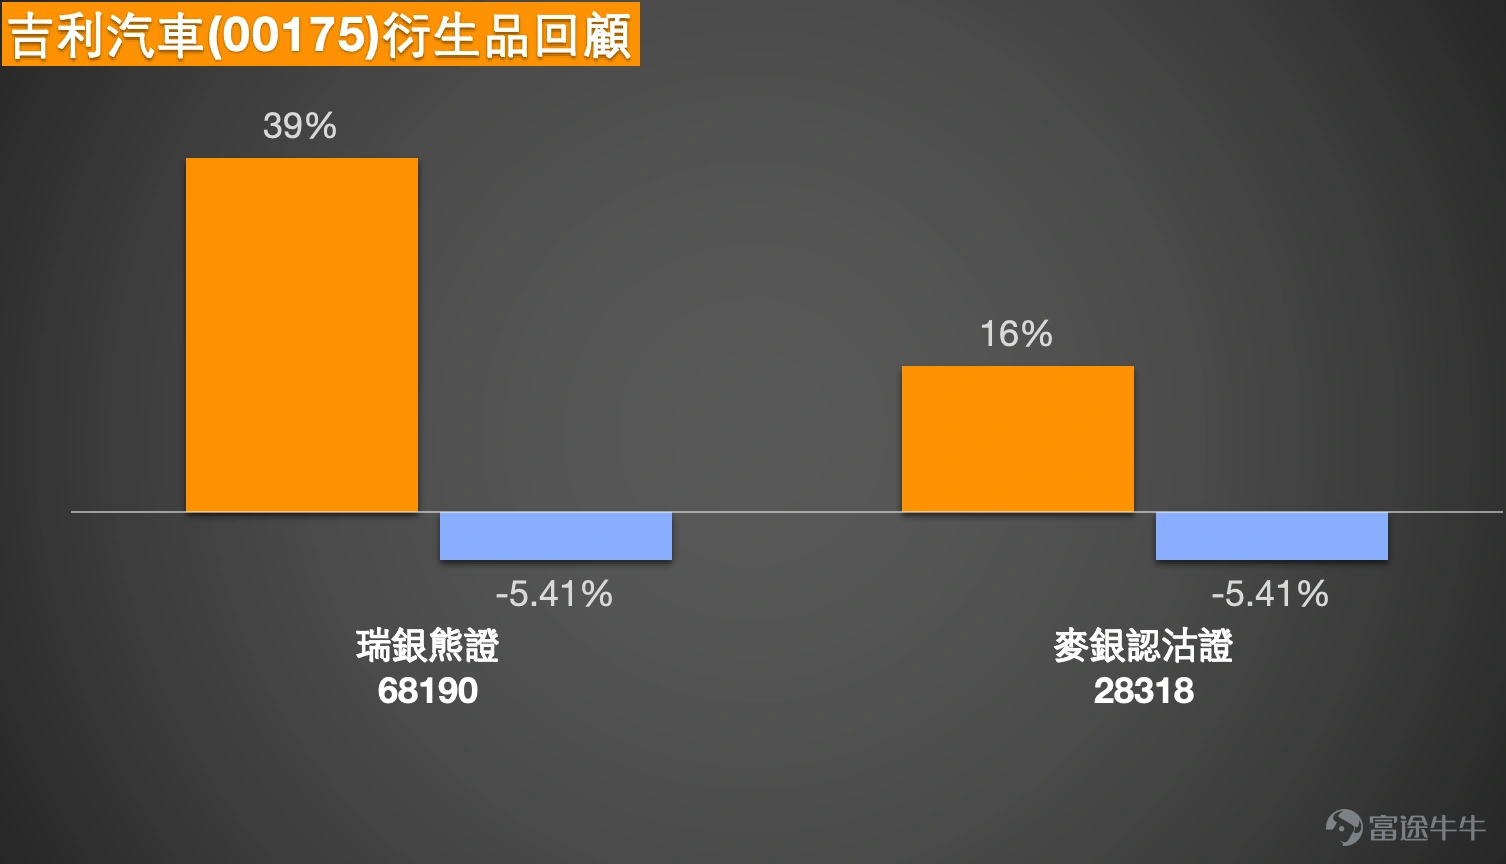
For investors interested in put warrants, those with a strike price of 18.47 yuan represent a bearish strategy. From the current technical standpoint, if the stock price cannot recover above 23.409 yuan, the weak trend remains intact; however, if stabilization begins around 22 yuan, short positions should be cautious about potential rebound risks.
In terms of short-term strategy, Geely Auto should use 21.938 yuan as the defensive level. Holding above this point provides conditions for an oversold rebound to potentially evolve into a short-term bottom; breaking below 21.938 yuan requires caution against further testing of 20.418 yuan. $UB#GEELYRP2612F.P (68190.HK)$$MBGEELY@EP2610A.P (28318.HK)$
Kuaishou-W (01024.HK): Hovering at lows, 43.425 yuan becomes the short-term defensive level
Kuaishou-W closing price on April 27 was 43.640 yuan, below the 5-day line at 44.640 yuan, the 10-day line at 45.400 yuan, the 20-day line at 45.416 yuan, and the 30-day line at 49.107 yuan, indicating that the short-term trend remains weak. The closing price on April 27 approached the lower Bollinger Band at 43.425 yuan, reflecting that the stock price is still hovering at a low level, with no clear signs of strengthening yet.
Technically, 45.400 to 45.416 yuan represents the main short-term resistance zone. Unless the stock price can rise above this range again, any rebound would still be considered a weak rebound. If it holds steady above 43.425 yuan and rises above 45.400 to 45.416 yuan, there may be a chance to retest 47.407 yuan in the short term.
On the other hand, if the stock price breaks below 43.425 yuan, further support around 42.940 yuan needs to be watched. The Relative Strength Index (RSI) stands at 27.169, which, although close to the oversold region, only indicates that the decline has reached a certain extent, and does not mean that the stock price has confirmed a bottom.
In terms of investor comments, some investors mentioned continuing to add to short positions, believing that there is a chance the stock could fall below 40 yuan this week, while also paying attention to bull contracts above 35 yuan. Based on the current trend, Kuaishou’s short-term outlook indeed appears weak, but for the downtrend to confirm further expansion, it must first break below 43.425 yuan.
Some investors continue to monitor call warrants with a strike price of 58.93 yuan. For long positions, the key lies in whether the stock price can rise back above 45.400 to 45.416 yuan; until then, deploying call warrants remains a contrarian move, with relatively low odds of success.
As for investors focused on bear contracts with a stop-loss price at 49 yuan, the current stock price remains below multiple moving averages, making the bearish direction more favorable. However, since the RSI has dropped to 27.169, if the stock price stabilizes and rebounds near 43.425 yuan, bear contract holders should be cautious about short squeezes in the short term.
In terms of short-term strategy, Kuaishou-W should use 43.425 yuan as the defensive level. Holding firm at this level could lead to a weak rebound from lower levels; breaking below 43.425 yuan means the next support will be at 42.940 yuan. $MS#KUASORP2809A.P (53285.HK)$$BIKUASO@EP2612A.P (17484.HK)$$MSKUASO@EP2612A.P (18224.HK)$$HU#KUASORP2808B.P (54324.HK)$

Reminder: This article does not constitute any investment advice.
This article is for reference only and does not constitute any investment advice. The market data, opinions, and analysis contained herein may change at any time without prior notice. We are not responsible for any loss or damage caused by reliance on the information in this article. Technical analysis only shows whether certain technical conditions are met; a comprehensive assessment of asset performance should combine other data and should not solely rely on this article to make trading decisions. Please note that past performance is not indicative of future results. Follow Jenny's insights on Hong Kong stock warrants for more professional analysis.
Risk Disclaimer: The above content only represents the author's view. It does not represent any position or investment advice of Futu. Futu makes no representation or warranty.Read more
Comments
to post a comment